Week Ending 12/15/2017

HIGHLIGHTS

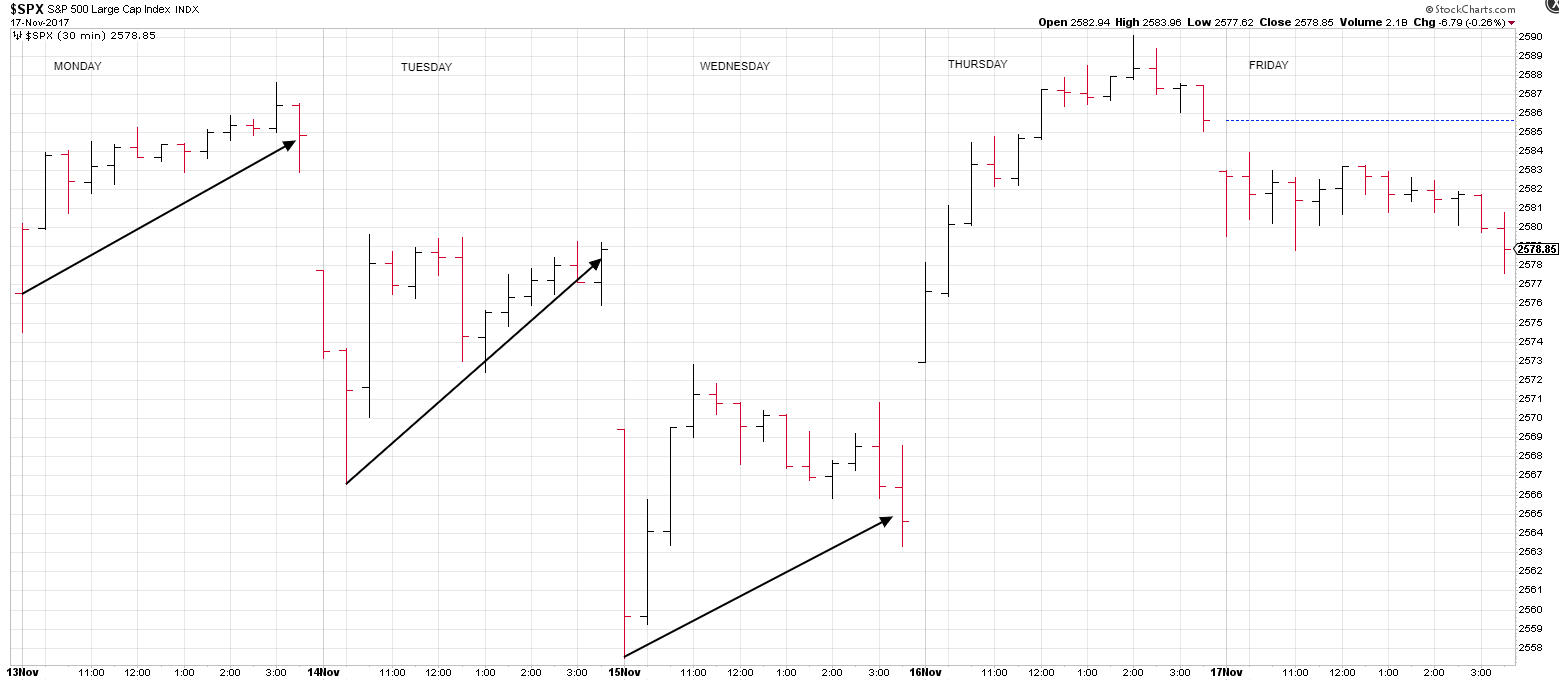
  • Equities up 0.78% to close at another record.
  • The tax plan is close to becoming law.
  • The Fed increases rates by 1/4%.
  • Disney buys most of the assets of 21st Century Fox.
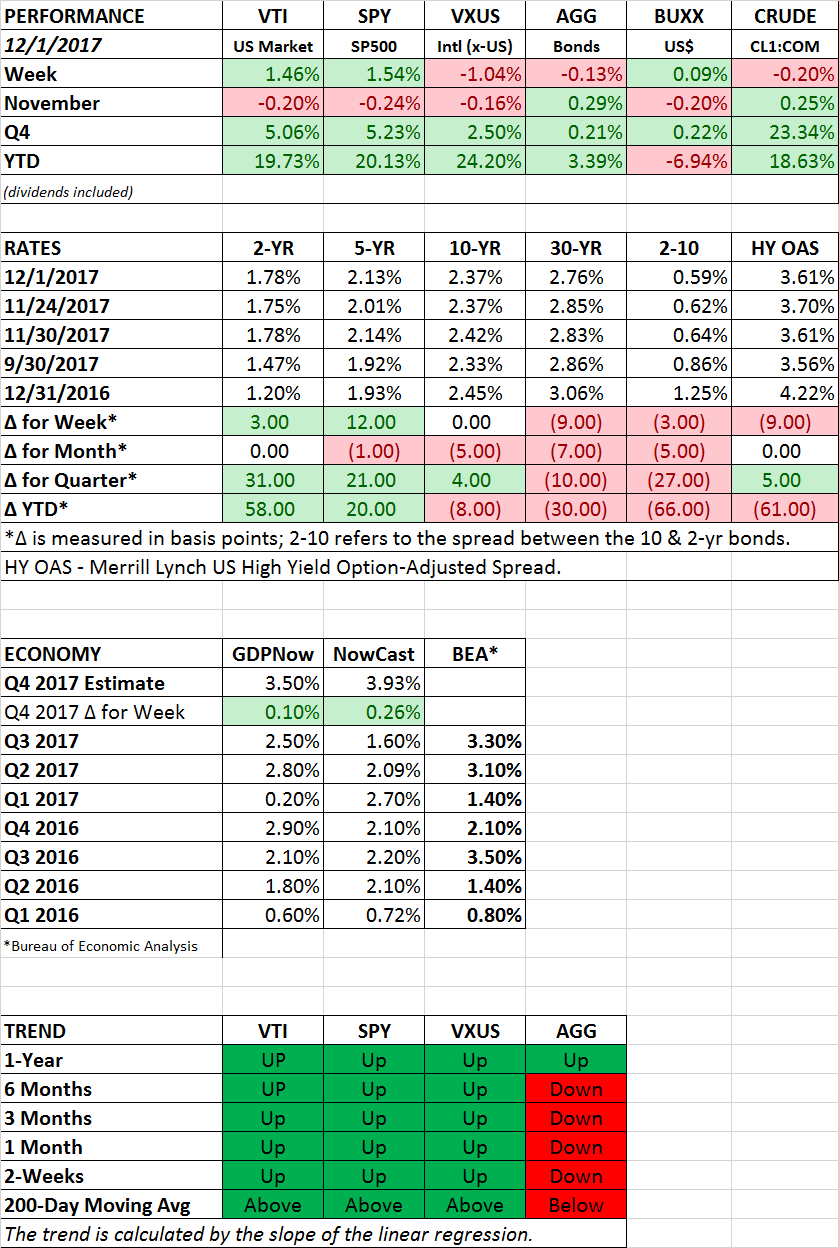
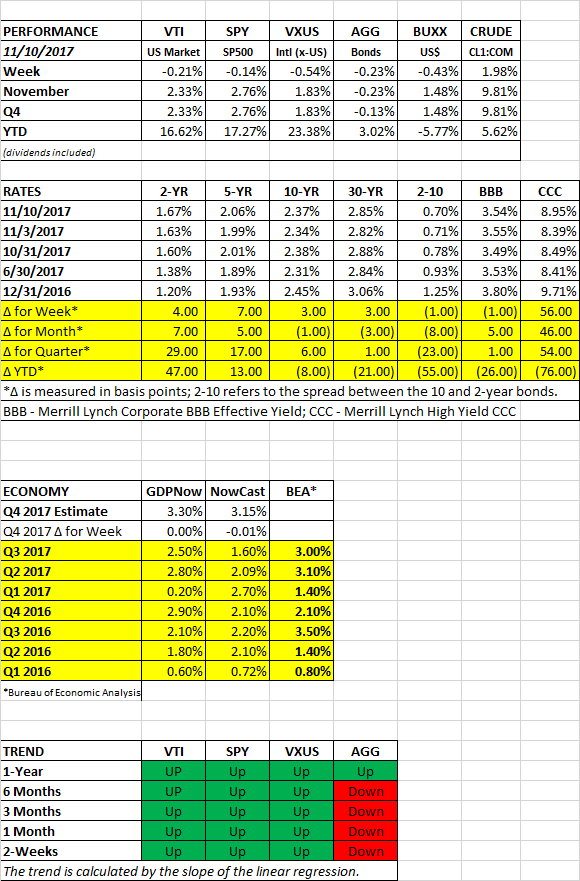
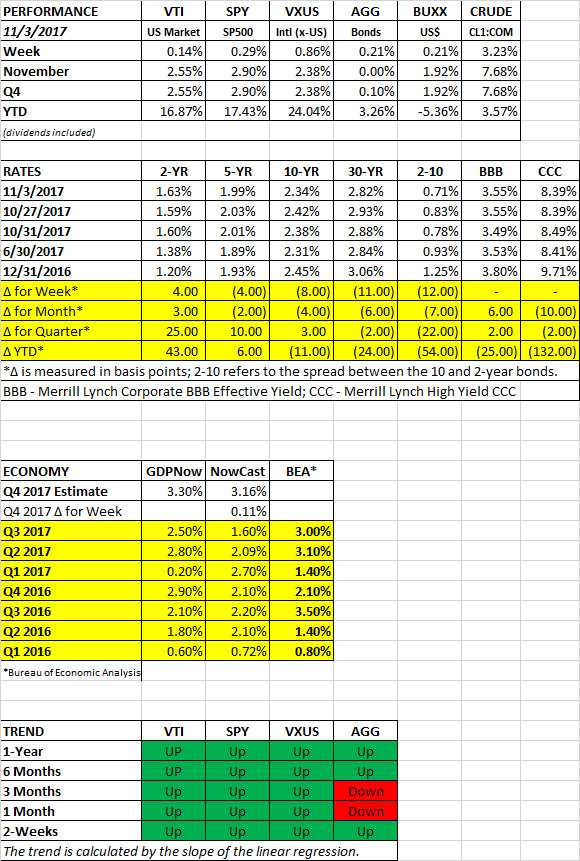
PERFORMANCE

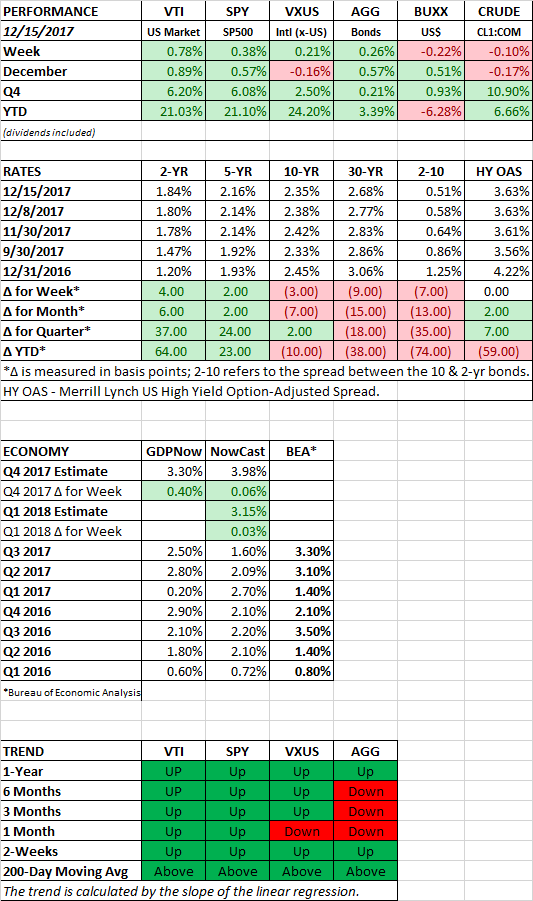
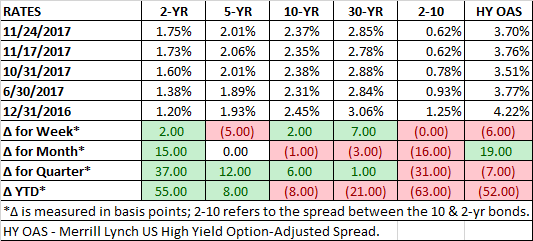
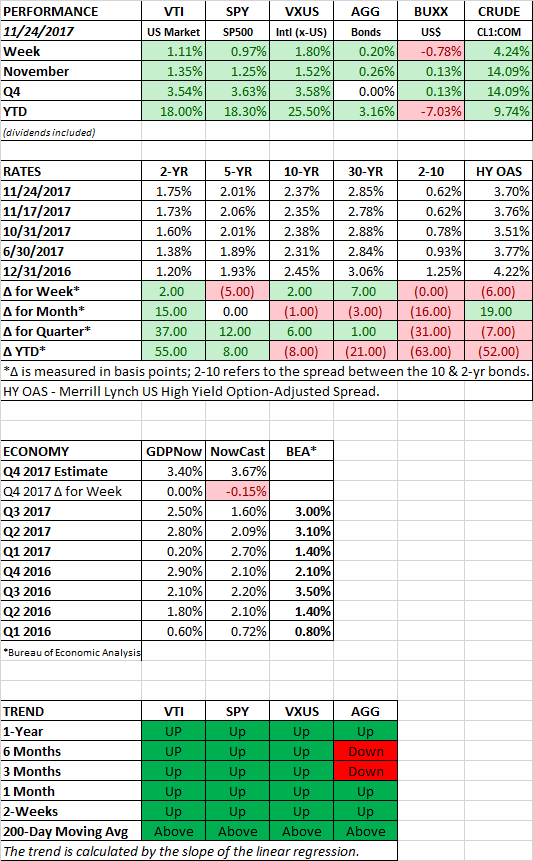
US stocks increased by 0.78% to hit another record. International equities moved ahead by 0.21% and bonds increased by 0.26%. Higher corporate profits powered by the tax bill are getting the credit for the recent stock run. Profits on the S&P 500 might improve by $10 per share due to the tax cut. On the yield front, the 2-year rate increased by 4 basis points and the 10-year fell by 3, dropping the spread to 0.51%

TAX PLAN

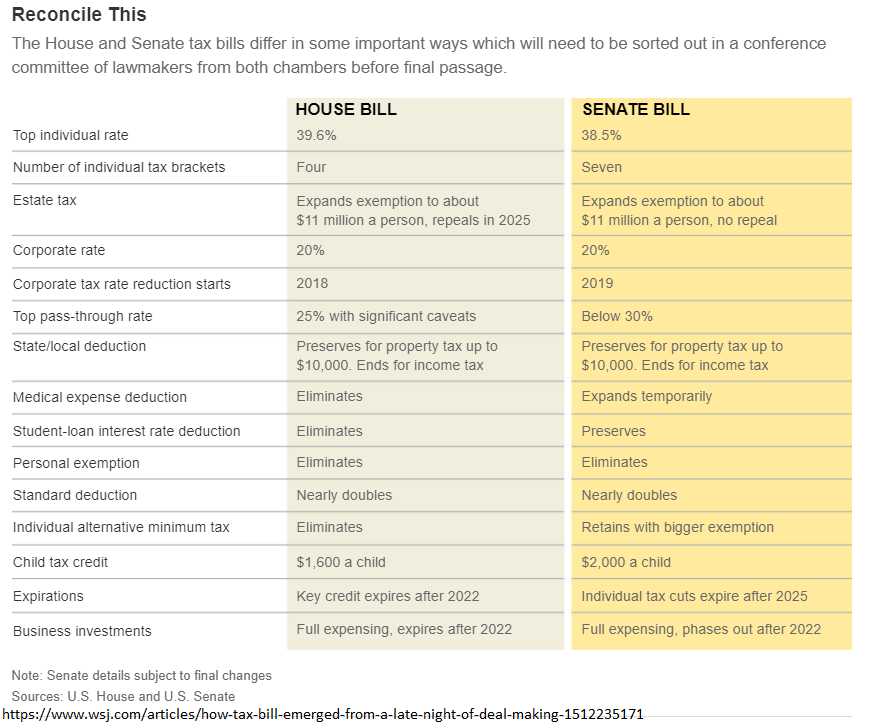
Lawmakers are close to passing a $1.5 trillion tax cut. The plan does not simplify the tax system. The bill is filled with staggered dates, new rates, and complicated new provisions. The pass-through legislation will lead to unintended consequences. The bill overall will add to a deficit that the US cannot afford to make any bigger.

The legislation does have needed relief for repatriation of overseas earnings (almost $3 trillion) and a lower tax rate for corporations to make the US more competitive with other countries.

FED

In Janet Yellen’s final session as Chair, the Fed increased the federal funds rate by 1/4% to 1.25% to 1.50%. The Fed currently plans to increase rates another three times in 2018 and twice in 2019. The market is currently pricing in two rate increases, but there are some economists predicting four. In addition, the Fed has begun the process of unwinding their balance sheet.

A combination of lower tax rates and higher interest rates in the US could pose a problem to China in keeping capital at home. In response to the Fed, the Chinese central bank also increased rates, first, to slow capital flight out of China, and two, to try to tame all the leverage throughout the Chinese system. While higher interest rates might lower the appeal of taking on more debt in China, it also increases the carrying cost of current loans in the very highly leveraged Chinese system. It is a tricky balance that the Chinese central bank will have to thread.

It remains to be seen what the European Central Bank will do. But at some point, they will probably slow the pace of their bond purchases and will eventually begin to increase rates.

All the above points to a world with slightly higher interest rates and less central bank stimulus, traditionally a formula that would slow down the pace of the equity market due to a falling p/e ratio.

DISNEY

Disney bought most of the assets of 21st Century Fox for $66 billion (stock + debt – cash) in a monumental deal as it scales up to take on Netflix. Netflix currently trades at an enterprise value to EBITDA ratio of 47, compared to 10.5 for Disney.
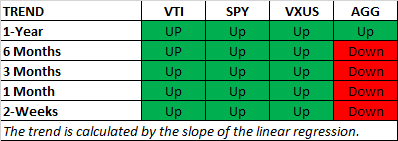
SCOREBOARD

Week Ending 12/8/2017

HIGHLIGHTS

  • US equities up by 0.30% to hit a new high.
  • Bitcoin futures launch today after a wild week.
  • Wall Street strategists all project higher US market in 2018 in Barron’s Outlook.
  • Nonfarm payrolls up by 228,000 in another strong labor report.
  • Congress extends deadline on the debt ceiling for another two weeks.

PERFORMANCE

The market dipped on Monday and Tuesday but rallied just enough over the remainder of the week for US equities to hit new all-time highs. The US markets were up by 0.30%. International markets fell 0.21%. Bonds were flat and the dollar advanced by 0.92%.

BITCOIN

Bitcoin futures trading begins today (Sunday, December 11) at the CBOE Global Markets Exchange. Later in the month, the CME Group launches its own bitcoin product. And then the NASDAQ will launch early next year. The futures are set to settle in US dollars, not bitcoin.

The talk of bitcoin is now everywhere and the consensus by the old-timers is we are watching a bubble in the making. Judging by the chart, it sure looks that way. From Monday to Thursday, the price rose by 53%, only to fall by 22% two days later. Depending on your perspective, buying bitcoin is akin to “investing” in past manias such as Dutch Tulips, or maybe like Beanie Babies (on a much grander scale). To others, bitcoin represents the future of currency and just about everything else.

WALL STREET FORECASTS

Barron’s interviewed 10 investment strategists for their 2018 forecasts. None of the ten forecast a fall in prices in 2018. Tobias Levkovich from Citi Research is forecasting a flat market. He projects a 2018 price of 2675, just about 24 points from here. All of the others are more on the bullish side. At the high end is Ed Yardeni, forecasting a price of 3100. The projection calls for a 7.2% gain, fueled by higher projected earnings of about 10%. But those earnings increases are counting on a tax cut worth about $10 in earnings. Take out the tax cut and earnings would only be estimated to increase by about 3%. The strategists also forecast an increase in the 10-year treasury rate to 2.77%, up from the current 2.38%.

Last year the group projected the S&P 500 to end 2017 at 2380, that turned out to be much too low (barring any major sell-off in the final few weeks of the year).

Fears that the strategists cited include inflation, aggressive rate increases by the Fed, regulations against social media companies, and a bitcoin crash.

LABOR MARKETS

Labor markets continue to show strength. Nonfarm payrolls were up by 228,000. The average workweek increased by 0.1 hours to 34.5 hours. The unemployment rate remained steady at 4.10%. Average hourly earnings moved ahead by 0.2% and the year over year change is now at 2.5% compared to 2.3% last month.

SPENDING BILL

The House and Senate both passed a bill that provides funding for the US government for another two weeks.

SCOREBOARD

Week Ending 12/1/2017

HIGHLIGHTS

  • US equities up by 1.46%, international stocks fall. Lots of volatility Friday.
  • North Korea test fires a missile that threatens the entire continental United States.
  • Former Trump advisor Michael Flynn pleads guilty and agrees to cooperate with the special counsel.
  • The Senate passes tax legislation, now it moves to a conference committee.
  • GDP growth is revised higher to 3.3% for Q3 and forecasts for Q4 are for higher growth

PERFORMANCE

It was a bumpier ride than normal, but the market continues to travel in the same direction, up, as US equities advanced by 1.46%. North Korea even test fired a new missile that can supposedly hit anywhere in the United States, and that didn’t shake the market advance. International markets dropped by 1.04% and the bond aggregate was down slightly by 0.13%.

Markets moved higher on progress on tax legislation. On Friday, news broke that former advisor to President Trump, Michael Flynn, was going to please guilty and cooperate with the special counsel’s inquiry regarding election interference. That sent equities into a tailspin. Stocks immediately tumbled and were down 1.6% from the open by midday. But the buy the dip mentality prevailed and the market rallied to close down just 0.2% for the day.

TAX LEGISLATION

Tax legislation now goes to a committee with the House and Senate. The resulting legislation, if passed, will impact almost every area of the US economy. The original hope was that tax legislation would simplify the tax system, encourage economic growth and be somewhat revenue neutral. Most likely, the end result coming out of committee will be a tax system that is more complicated, especially in terms of pass-through entities (leading to unintended consequences), $1 trillion-plus added to the deficit over the next 10-years and a questionable impact on future growth, at least according to the plan’s critics. Similar to Obamacare, there is a rush to pass legislation for the sake of just passing legislation, instead of crafting a well thought out bill that is better understood and debated.

GDP

Real GDP growth for Q3 was revised higher to 3.3% from the original estimate of 3.0%.  It was the fastest growth in three years. Personal income increased by 0.4% in October. Disposable personal income rose by 0.5%, the most in eight months. Initial jobless claims came in at 238,000, a historically low number. Retail sales during the Thanksgiving holiday were good. Overall, the economy continues to look strong. Estimates of Q4 growth increased in both the Atlanta Fed’s GDPNow model and the New York Fed’s NowCast model to 3.50% and 3.93% respectively, up from 3.40% and 3.67%.

SCOREBOARD

Week Ending 11/24/2017

PERFORMANCE

US equities set new highs as the market was up 1.11%. The S&P 500 closed just above 2600.  International equities increased by 1.80%, also a new high. Synchronized economic growth around the world and strong corporate earnings have provided fuel to move prices higher.

Stock prices have run well ahead of analysts’ forecasts from the beginning of the year and even as recent as a few weeks ago. In the chart below, the light blue dot represents the January forecasted price and the dark blue represents the newer, updated forecast (as of October). With the close on Friday, the S&P 500 has now equaled or exceeded the year-end targets for all the banks shown below except for one.

The truth is that it is difficult to make accurate forecasts. And it is not just equity prices. Look below at the track record in recent years for the 10-year Treasury yield. Economists have constantly been predicting rising yields, but they have been mostly wrong, at least so far.

YIELD CURVE

The spread between the 10-year and two-year US Treasury bonds has narrowed dramatically since the beginning of the year, down by 63 basis points (see the column titled 2-10 below). An inverted yield curve, when the near-term rate is higher than the longer-term rate, has often been a leading indicator for a recession. We are not in an inverted state yet, but we might be heading there.

However, some economists think that this time is different. “This time is different” have been dangerous words in financial history, but we have been going through some extraordinary times. Central banks around the world are still artificially holding interest rates at zero or below, increasing demand for US government debt, and thus keeping the 10-year rate lower than it would naturally be. At the same time, inflation expectations have come down, and the Fed is increasing short-term rates, putting upward pressure on the 2-year. Since the beginning of the year, the 2-year has increased by 55 basis points while the 10-year has declined by 8 basis points.

By the way, you can find the weekly update for bond rates in our Scoreboard section each week in this newsletter.

SCOREBOARD

Week Ending 11/17/2017

PERFORMANCE

Markets ended the week flat as US equities were up by 0.08% while the S&P 500 was down by 0.09%, international equities fell by 0.07%. In what amounts to a correction in today’s environment, stocks sold off in the first hour on Monday, Tuesday, and Wednesday, but traders bought the dip each time and the market finished close to its high on each day. The market rallied on Thursday on the House passing tax legislation and on strong earnings from Wal Mart.

CRAZINESS ACROSS MARKETS

Two examples this week of the craziness across different markets. First, bitcoin, the high flying cryptocurrency, fell by 22% and then rallied by 35% to hit new highs, all in a matter of a few days.

And then in the art world, Leonardo Da Vinci’s Salvator Mundi was auctioned off for $450 million, shredding the previous record for the amount most paid for a painting.

EARNINGS

Per Thomson Reuters, earnings for Q3 are now expected to increase by 8.2% year over year. That is significantly higher than the 3.2% estimate in mid-October. Excluding energy, the estimate is 5.9%. In the S&P 500, 72% of companies have reported earnings that beat estimates. The current forward p/e ratio is 18.2.

ECONOMY

GDP growth estimates for Q4 look solid. The Atlanta Fed’s GDPNow model has growth coming in at 3.40% and the NY Fed NowCast is forecasting growth at 3.82%.

SCOREBOARD

Week Ending 11/10/2017

PERFORMANCE

US equities fell by 0.21%. It was the first weekly decline since September 10. Investors were worried about the prospects for tax reform. International equities dropped by 0.54%, the dollar declined by 0.43% and oil continued its rally, +1.98%.

The close on Friday made it official, the S&P 500 set the record for the longest streak ever without a 3% correction. Click here for a link to our article on how the market performs after extended streaks without a correction.

Another streak in progress is days without a decline of 0.5% or more. It has now been 47 days, the longest streak since 1965.

Bonds were down by 0.23% as interest rates increased slightly. The trend, as measured by the linear regression, for the bond aggregate is now negative in all the different time frames that we follow, except for one-year, as shown below.

DIVERGENCE BETWEEN HIGH YIELD AND THE S&P 500

Since late October the S&P 500 has been going in one direction (up) and the high-yield bonds have been going in another (down). Normally the two asset classes generally move together. When they diverge, it sometimes foreshadows direction. High-yield is often the leading indicator. A lot of the decline in high-yield is traced to the sell-off of a small group of widely held bonds. Sprint and T-Mobile ended their merger talks, and Teva Pharmaceutical’s  and CenturyLink had poor earnings.

SCOREBOARD

Analysis of Performance after Extended Periods Without a 3% Correction

HIGHLIGHTS

  • The S&P 500 is about to have the longest-streak ever without a 3% correction.
  • The longest streak prior to this one ended in December of 1995. Performance over the next 90-days, 180-days and 365-days was positive in all three-time frames.
  • Out of the nine other longest streaks without a 3% correction, the sell-off that ended the streak marked the beginning of correction (a loss greater than 10%) two times, and one of those two times led to a bear market (loss of greater than 20%).
  • In all cases except one, the market did exhibit greater volatility after the rally ended, with an average drawdown during the following 12-months from peak to trough of 10.61%.
  • However, the median return going out 90-days, 180-days and 365-days were positive for all periods.

LONGEST PERIOD EVER WITHOUT A 3% CORRECTION

Barring a last-minute selloff, the S&P 500 will set the record for the longest period without a 3% correction on Friday, November 10th. That is 371 days.  Only the run from December of 1994 until about one-year later is in the same class. After that, there were 8-periods that lasted between 170 and 300 days.

The chart below shows how the market performed over the next 90, 180 and 365 days, as well as the maximum drawdown from peak to trough during the subsequent 12 months.

SUBSEQUENT PERFORMANCE OVER 90, 180 AND 365 DAYS

What happens after these extended, non-volatile rally ends?

Two of the time periods (C and F above) had losses across the board. The period from April of 1993 until February of 1994 (C), and then the period from June of 1965 until February of 1966 (F).

If you at the percentage gain or loss in 90, 180 and 365 days, and ignore any drawdowns in between, the maximum loss was 10.96% in period F, and that was 180 days after the rally had ended.

In four of the nine examples (B, D, E, and J)., the market was up in every time frame measured. The maximum gain was 26.17% one year after the end of rally E.

In two of the examples (H and I), the S&P was down in value 90-days later, but up in the longer time frames of 180-days and one year.

And in the remaining example, G, there was a gain 90-days out but losses at the end of the 180-day and one-year time periods.

The average return over all nine-time periods was -0.63% for the 90-day time-period, 2.91% for 180-days, and 6.34% for 365-days.

The median return was positive across all time frames, 0.76%, 2.04% and 5.90% for 90, 180 and 365 days.

THE END OF THE RALLY LED IMMEDIATELY TO A DECLINE OF 10% OR MORE TWO TIMES

Of the nine periods, two of them, 1966 and 1950 (F and H), were periods where the end of the rally marked the high point before a decline of 10% or more. In 1966 (F), the S&P sold off by 22%, and in 1950 (H), it declined by 14%.

MAXIMUM DRAWDOWN

We also looked at the maximum drawdown over the subsequent 12-month period. The thinking was that maybe the end of the rally does not mark the beginning of an immediate decline, but what if it leads to more volatility which is a tip-off to a larger sell-off at some point in the next 12-months.

The maximum drawdowns averaged -10.61% with a median of -8.94%. The smallest drawdown was 3.55% and the largest was 22.18% over the following 12-months. Thus, in all cases except for one (J), volatility did increase to a certain extent.

CALM BEFORE THE STORM

If there was ever a case of the calm before the storm it was the run that started in July of 2006 and ended in February of 2007. The S&P 500 would move sideways to higher until July by +6.4%, then fall through mid-August by 9.5%, then rally to a new high by 11% into October. That would be the turning point for what would be the bear market of 2007 to 2009. In the one-year after the rally ended in February of 2007, the drawdown was 16.27%, but that was just a hint of what was to come. Ultimately, the market declined between October of 2007 and March of 2009 by 56.30%.

SUMMARY

We looked at nine-time periods and price action over the next year. There is only one period that is similar in length to our current period, and that was the rally from 1994 to 1995 (B). In that case, the market remained positive in the three-subsequent time-frames that we measured. Three other time periods (D, E and J) all had positive returns over 90, 180 and 365 days.  Two periods had negative returns over all three-time frames (C and F). In two cases, the end of the rally marked the immediate beginning of significant declines of 10% or more (F and H), including one of 22.18% (F).  And then in 2007, the bear market began about 8-months later, but most of the damage was done more than 12-months after the end of the rally.

The sample size is too small draw any definitive conclusions, but there is a definite pick up in volatility after these long rallies end as shown by the drawdown numbers, and there were losses of greater than 10% in three of nine examples.


Week Ending 11/3/2017

HIGHLIGHTS

  • Equities hit another high.
  • Oil futures break out to a two-year high.
  • Jerome Powell nominated as the new Fed chair.
  • Another strong employment report.
  • Republican’s release their tax plan.

PERFORMANCE

The market finished the week at another high. US equities were up by 0.14%, international equities increased by 0.86%. The dollar advanced by 0.21%. Bonds were up by 0.21% as the spread between the 10 and the 2-year note dropped by 12 basis points to 0.71%. That is down from 0.93% on September 30th and from 1.25% on December 31.

Oil broke out to a new year two year high, as crude oil futures were up by 3.23%.

NEW FED CHAIR

President Trump nominated Jerome Powell to succeed Janet Yellen as the new Federal Reserve Chair. With Powell, Trump gets a consensus-driven leader that will likely stick to Yellen’s laid out plan of gradual interest-rate hikes and the unwinding of the balance sheet. But Powell is more in tune with the Republican deregulation agenda.

Powell will become the 15th chair in the 103-year history of the Fed. According to Ned Davis Research, the average gain during the first six months after a new Fed chair for the Dow is 2.1%, with a median drawdown of 10.5%.

The Fed is expected to raise interest rates in December.

EMPLOYMENT

Nonfarm payroll increased by 261,000. Average hourly earnings stayed the same month over month and are up 2.4% year over year. The unemployment rate dropped to 4.1%, a 17-year low. But the drop was primarily due to the decline in the labor force participation rate to 62.7% from 63.1%. Hiring in September was revised to a positive 18,000 from an original estimate of -33,000. The tight labor market has some economists now projecting four interest-rate increases in 2017, instead of three.

PROPOSED TAX PLAN

The House made public their proposed tax plan, titled the “Tax Cut and Jobs Act”, with the primary aim of helping businesses. For individuals, while there will be mainly winners, some will end up paying more in taxes. It is likely the plan won’t survive in its current form, and it may end up not being passed at all, like past Trump initiatives. The bill is designed to only cost the treasury $1.5 trillion over the next ten years. Here are the highlights:

  • The top rate for corporations drops to 20% from 35%.
  • For corporations, net interest deductibility is limited to 30% of earnings before interest, taxes, depreciation, and amortization (EBITDA).
  • Repatriation of cash from overseas would be taxed at a one-time rate of 12% and 5% for non-cash.
  • The tax rate on pass-through entities, mostly small businesses, such as sole-proprietorships, partnerships, and Sub-S corporations falls to 25%. Now such entities are taxed at the individual income tax rates, as high as 39.6%.
  • The top-rate for individuals remains at 39.6% but would start at $500,000 instead of the current $418,000.
  • The six remaining brackets now become three: 35%, 25%, and 12%.
  • The alternative minimum tax is eliminated.
  • The estate tax exemption becomes $11.2 million per person instead of $5.49 million.
  • The standard deduction is doubled.
  • The deduction for state and local income taxes is eliminated.
  • The property-tax deduction is capped at $10,000.
  • Only homes up to $620,000 would qualify for full interest deductibility assuming the buyer puts at least 20% down.
  • Private-purpose bonds would no longer be tax-exempt. These are the kinds of bonds often used for sports stadiums.

SCOREBOARD