MARKET RECAP
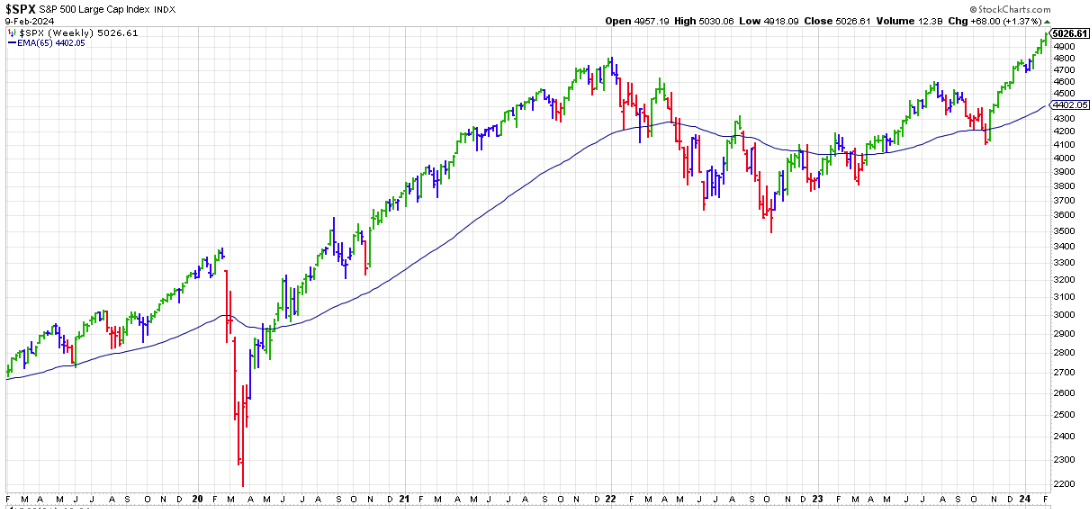
- S&P 500 +1.66%.
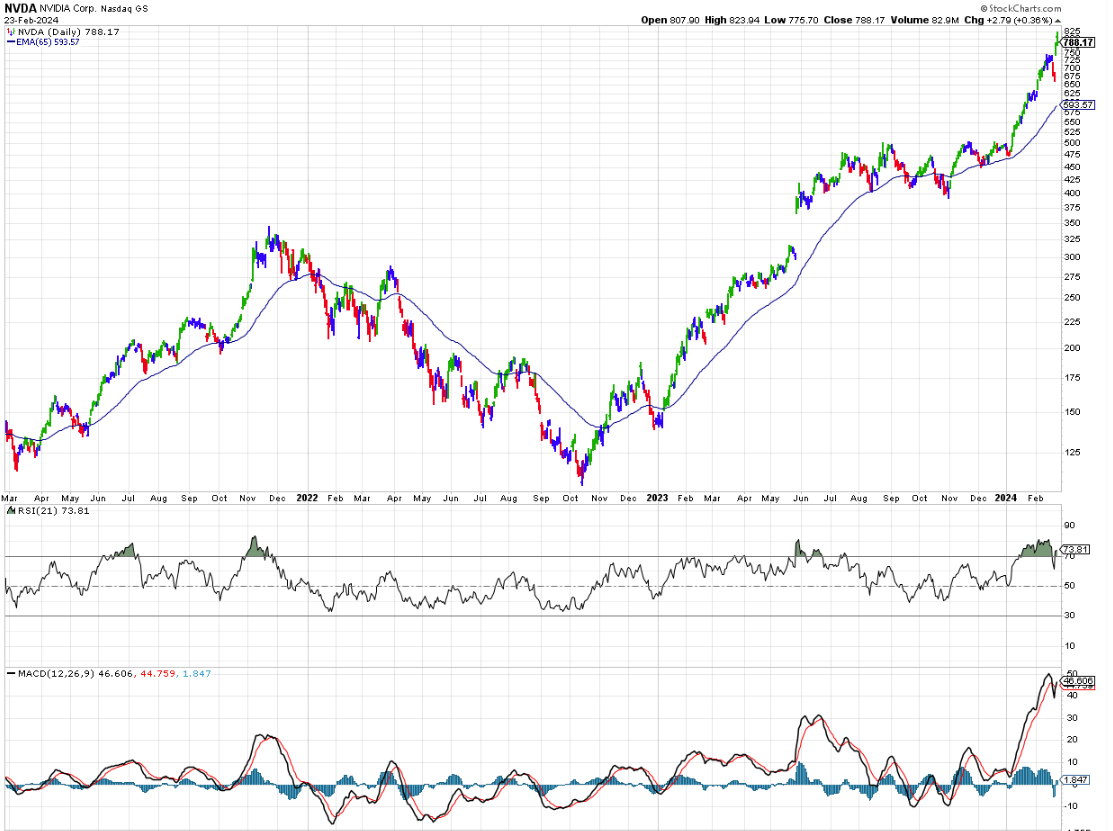
- Fueled by AI demand for their chips, NVDA continues skyrocketing to a market capitalization of almost $2 trillion. CEO Jensen Huang said AI is hitting a “tipping point” and that “Demand is surging worldwide across companies, industries and nations.” Earnings were up eightfold.
- International markets are rallying. Japan’s Nikkei 225 hit a record high for the first time since 1989.
- Unemployment claims fall to 201k.
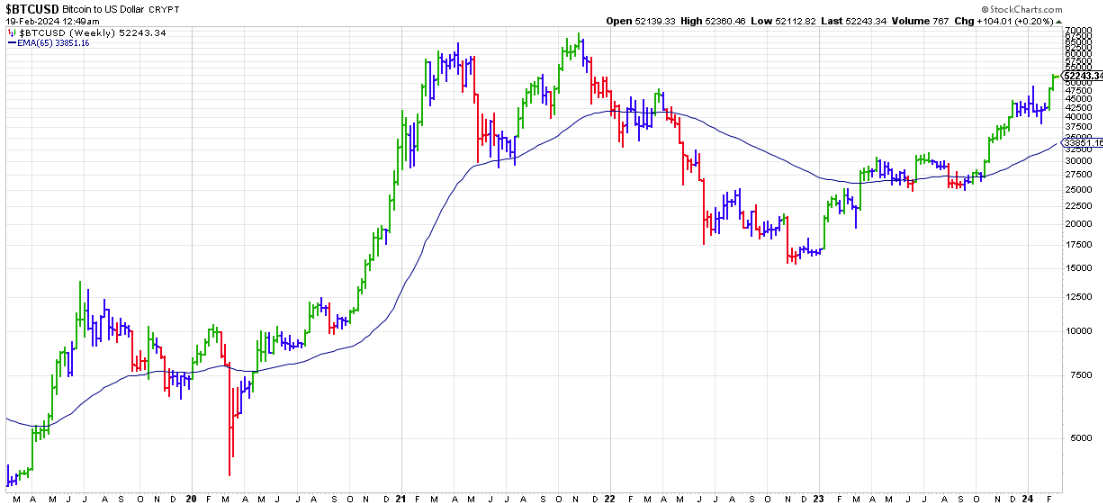
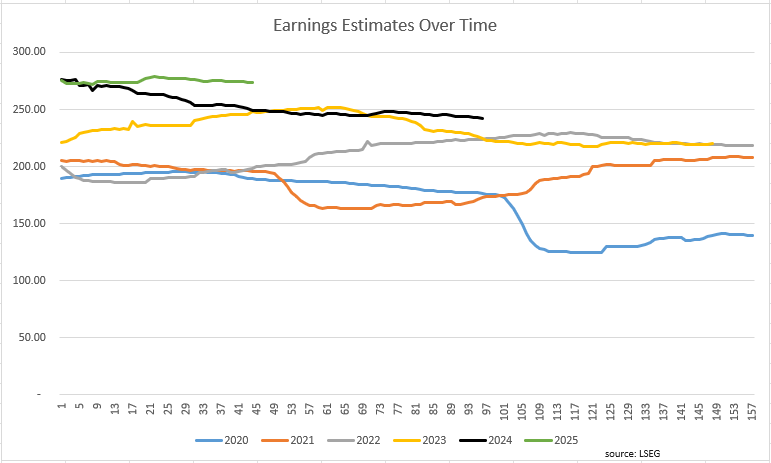
CHART OF THE WEEK
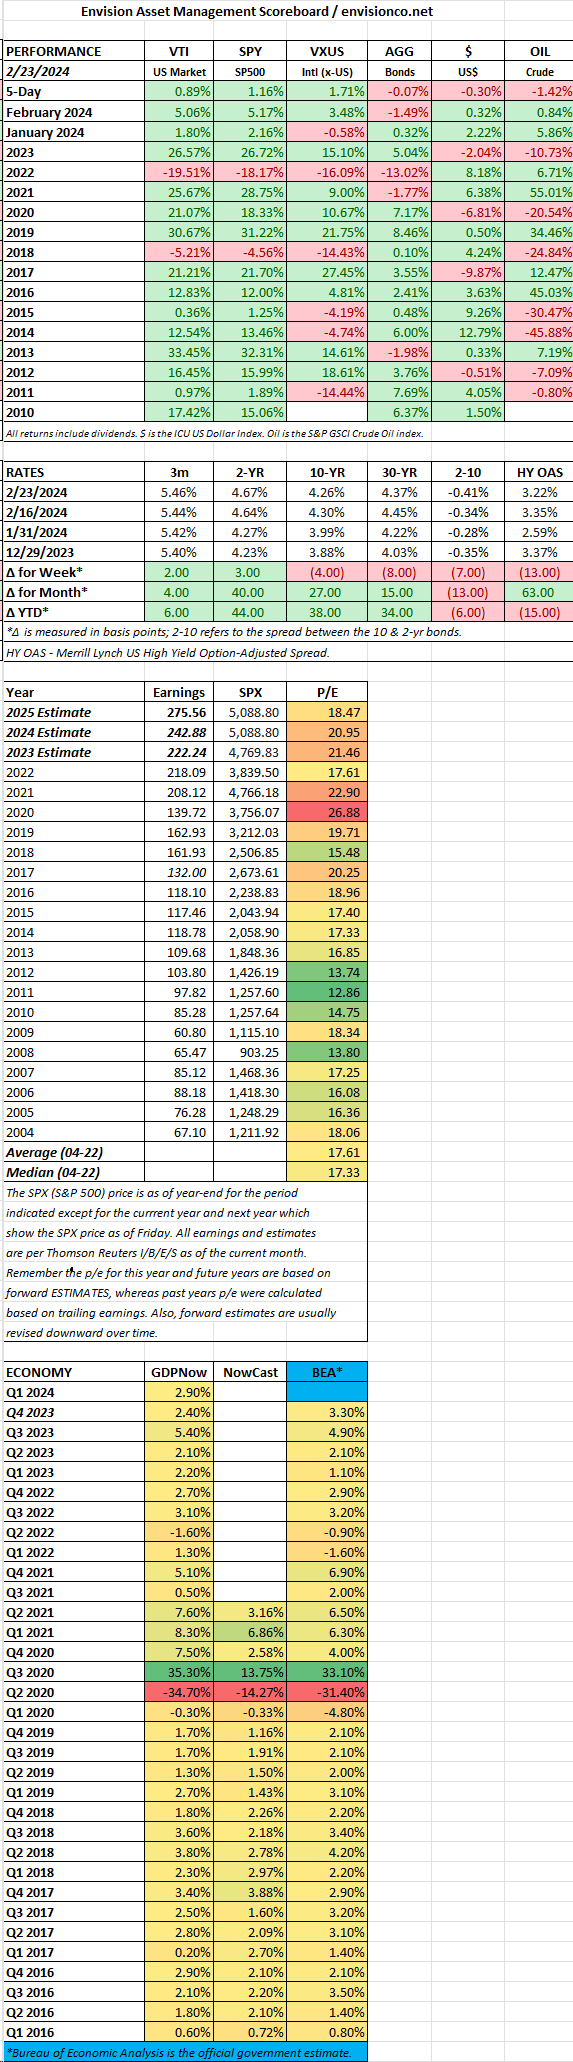
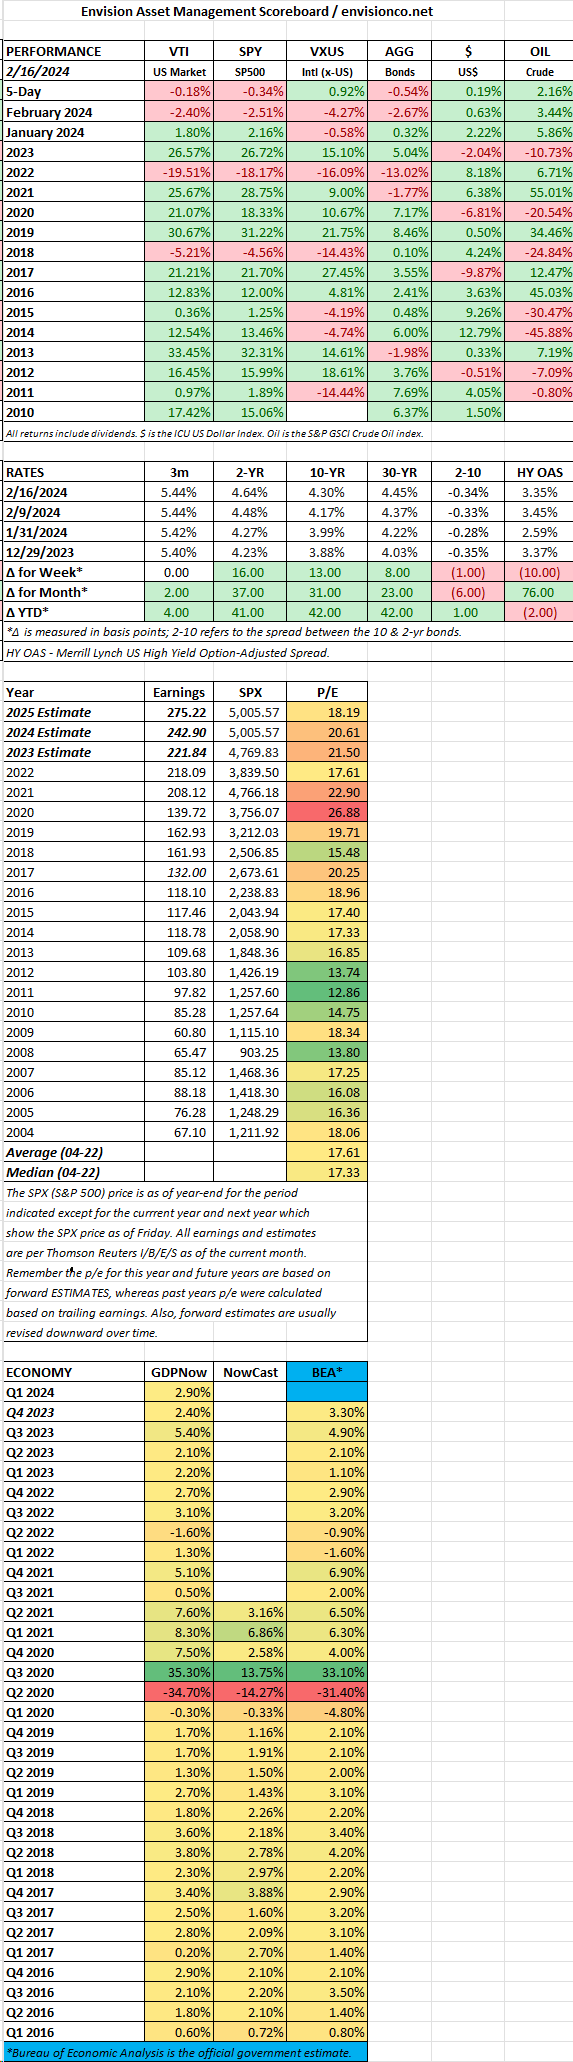
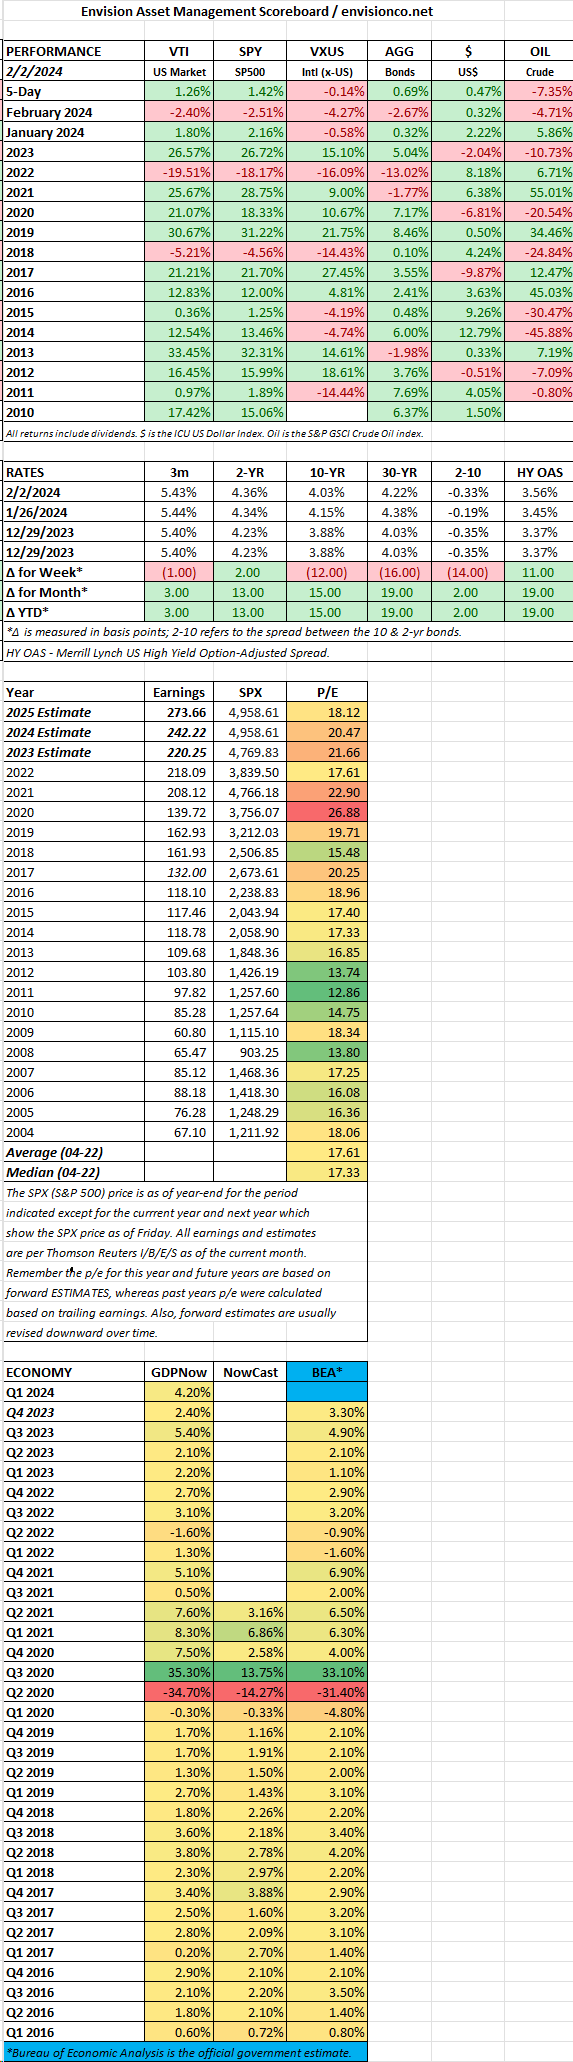
SCOREBOARD