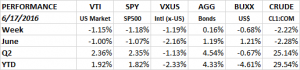
Week Ending 6/24/2016

Performance

Brexit was the driver of the equity markets all week, it moved the market higher through Thursday and then drove the market much lower on Friday in reaction to the “exit” vote.

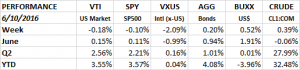
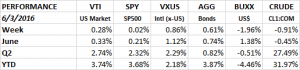
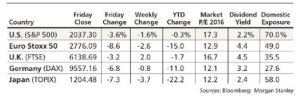
Friday’s losses put the market into the red for the year (excluding dividends). Excluding dividends the SPY is down 0.36%. Including dividends the SPY is up 0.67% on the year. Worldwide, about $2 trillion in market value was erased on Friday. The FTSE 100, made up of the 100 largest companies listed on the London Stock Exchange, fell 3%. However, when taking into account the massive drop in the value of the pound (about 9%), the index fell about 12% in dollar terms. The SP500 dropped 3.6%.

Friday's Performance after Brexit

For the week the US market was down about 1.64% (SPY), overseas was down 2.50%. The aggregate bond index stayed above breakeven, +0.06%, the dollar got a boost as a safe haven, +0.67% and oil fell by 0.98%.

SPY 6 24 16

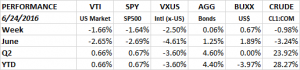
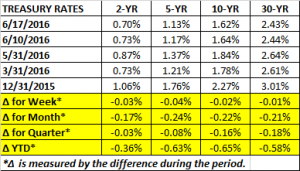
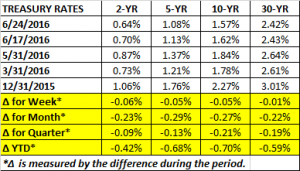
Treasury rates fell about 5 basis points for 10-year bonds and less. The 30-year remained steady falling only 1 basis point.
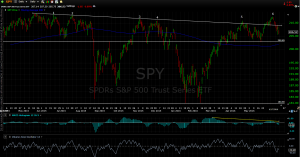
Treasury Rates 6 24 2016

Technical Analysis

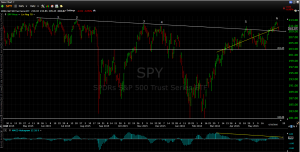
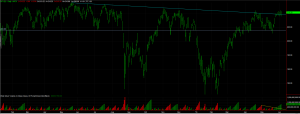
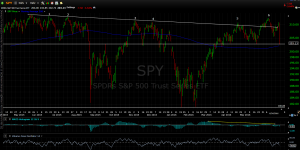
The equity markets rallied from Monday through Thursday. The market was anticipating a “remain” vote on the Brexit. What was interesting is that the close on Monday, Tuesday and Wednesday was towards the low for the day. It was as if the “smart money”, which is generally believed to trade towards the end of the day, was saying “not so fast” on the anticipated “remain” vote. But that caution was thrown to the wind on Thursday as the market shot higher by 1.30%. It looked like the market was setting up for another run at the all-time high. The market was clearly anticipating a “remain” vote but “exit” is what it got, and that set up the market for the 3.6% drop on Friday. The SPY did hold support at about $203 as it has on two recent occasions. The problem would be if the market can’t hold support, there is lots of empty space below.
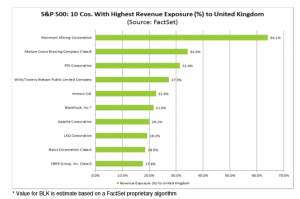
SPY 6 26 2016

Brexit

On June 23, history was made when the United Kingdom voters elected to leave the European Union (EU). While free trade and regulation were on voter’s minds, limiting immigration was likely the main motivation behind the vote. The EU is a union of 28 states and includes four of the world’s seven largest economies. The UK is the world’s fifth-largest economy representing 4% of the global economy. While the result of the election had a huge impact on financial markets, it is important to remember that at least as of now, this is a political event, not a financial event. In other words, the market went down because of politics, not because of a pending immediate threat to the financial system (like a major bank going under).

The vote itself is not binding, and the splitting of the UK from the EU will likely be a long and complicated process, adding a lot of uncertainty to the process. An act of Parliament needs to be passed to give the EU formal notice of the UK’s intent to leave. Then negotiations begin on the terms of the exit. And to make matters worse, the UK Prime Minister, David Cameron, resigned after the vote and will leave office in a few months.

From an economic standpoint, the question is what happens to the trade agreements? Dropping EU membership means a possible loss of the favorable trade agreements that the EU provides. The EU is the largest trading partner for the UK, accounting for one-half of UK exports. The UK also needs to attract foreign capital to help cover its current-account deficit. That might be more difficult now.

Under two scenarios laid out by the International Monetary Fund (IMF), UK GDP will drop by 1% by 2021 (more favorable) or more than 4% (unfavorable).

But the impact on the UK is only one part of the problem. Another part is how this impacts the EU. This will affect the EU economy but it might also result in the EU itself splitting up. Other countries might be tempted to vote themselves out of the EU. Given that UK voters decided to leave mainly because of immigration policies, and because this same immigration policy is the main impetus for other countries to leave the EU, it would probably be smart for the EU to restructure itself to be primarily an economic (free trade) union, and leave everything else to traditional negotiation between countries.

A third impact is the knock-on effect on the US dollar and the Japanese yen. Both currencies are likely to increase in value, hurting exports and lowering domestic profits.

In sum, Brexit opens up a long period of uncertainty and markets do not like uncertainty. However, the world economy is not going to end, although there will probably be some short-term downside. Countries will still trade with each other and people are still going to live and buy products. Slow growth is expected to continue and the world will adjust. Even in the UK, many economists still expect growth. Deutsche Bank Chief Economist Mark Wall  is looking for UK GDP growth of 0.9% versus 2.1% had the UK remained in the EU. He see Eurozone growth of 1.1% instead of 1.5%.
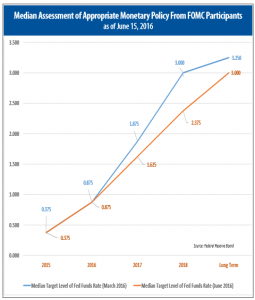
Fed

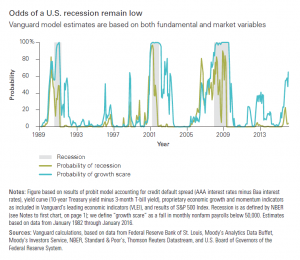
Janet Yellen said the chances of a recession this year are “quite low”. A WSJ survey of economists puts the chances of a recession in the next year at 21%. Yellen noted that wages are picking up and that economic output has improved in the second quarter. Yellen indicated that rates would increase gradually and cautiously, she did not give any hint of when. She also said she was not interested in following Japan and Europe to negative interest rates.

Yellen’s comments were before the Brexit vote. Now after Brexit, the chances of a Fed rate hike, at least this year, have dropped dramatically. We are probably looking at Q2 of 2017 at the earliest.

Inflation

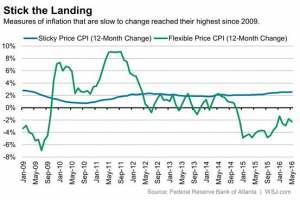
We wrote last week that inflation pressures are building in the system. The WSJ ran a story earlier in the week showing that the “sticky-price” CPI, items that fluctuate in price less, such as household furnishings and personal care products, rose at the highest rate since 2009. According to researchers at the Atlanta Fed, changes in “stick-price” items incorporate expectations about future inflation more so than other measures of CPI.

Sticky Price Inflation

Economy

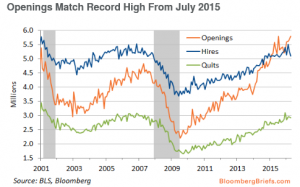
The US Coincident Index rose 0.2% indicating continued slow growth. Existing home sales increased 1.8% in May. Single-family sales were up 1.9%. the highest level since February of 2007. Distressed sales now represent only 6% of the market, a year ago it was 10%. The Architecture Billings Index increased by 2.5 points to 53.1, another good sign for growth. ATA For-Hire Truck Tonnage increased 2.7% in May. That was the first gain in three months and was up 5.7% year over year.
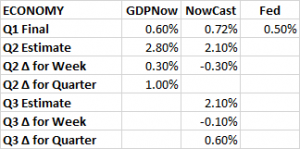
GDP

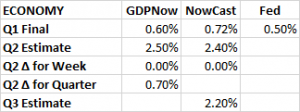
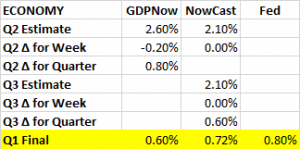
The Atlanta Fed’s GDPNow estimate for Q2 declined to 2.60% from 2.80% last week. The estimate for real residential investment growth fell to 1.7% from 3.6% after the US Census Bureau released data on new home sales, prices, and construction costs. The contribution of inventory investment also declined. Both factors resulted in the lower estimate. There was no change in the Q2 and Q3 estimates for the NY Fed’s NowCast. The NowCast projects growth at 2.10% for Q2 and Q3. If you split the difference between the two forecasts for Q2, and if the estimates hold at these numbers, the growth would be 2.35% versus 0.80% in Q1, an improvement for sure.

GDP Estimates 06 24 16

SUMMARY

The uncertainty created by the “exit” vote will likely dampen economic activity worldwide at least initially. Over the medium and long run markets should adjust. Brexit was a political event not an economic one, although you can make an argument that it can turn into an economic event down the road. Interest rates were pushed lower, which will offset some of the negative impact from Brexit. And with such low rates, equities arguably remain attractive. From a technical perspective, the market is resting on a major support line. If it breaks support expect further downside in the short run.

Week Ending 6/17/2016

Performance

Brexit fears hung over the market as the SPY fell 1.18% (dividends included) on the week. International markets did about the same, the VXUS was down 1.19%. Bonds were up 0.16%, the US dollar fell by 0.68%.

Bond yields in Europe continued to fall. The German 10-year went into negative territory for the first time. Polls at the beginning of the week leaned toward the “exit” camp but in the last day or so the have tilted back to the “stay” camp. Basically it is too close to call right now. Ultimately, an “exit” vote will have to be put into legislation. The vote is not binding although there would be enormous pressure to follow the will of the voters.

Oil was down 2.22% on the week. Rig counts have gone up for three weeks in a row.

Performance 6 17 2016

Treasury rates fell on the week. The 5-year fell 4 basis points and the 30-year dropped 1 basis point.

Treasury Rates 6 17 2016

Technical Analysis

As in the five previous attempts, a failure to crack through to a new high has led to a sell-off. Helped by Brexit fears, the market is off 2.76% from its recent high on June 8th.

The market has now retraced about 60% of its gain from the low on May 19 to the high on June 8th. If the market is going to make a new high in the short run, right about here (206.52 on the SPY) would be a good place to put in a higher low and then advance. The outcome of the Brexit vote might provide the fuel in one direction or another. A “stay” vote will likely push the markets higher and an “exit” vote will send equity markets lower. The impact overseas is likely to be greater.

SPY 6 17 2016

Earnings

Earnings for Q2 are now expected to decline 5.1% per FactSet. At March 31, the estimated decline was 2.8%. However, earnings estimates are normally revised lower during a quarter. The trailing 5-year average is a decline of 4.4%, versus 2.30% currently. The information technology sector has been the biggest contributor to the lower estimates. Earnings estimates for the sector are now -7.3% versus -0.1% at the start of the quarter. The forward p/e for the entire SP500 is 16.4. This compares to the five-year average of 14.6.

Brexit impact on SP500

The Brexit vote takes place on Thursday. According to data compiled by FactSet, the aggregate revenue exposure of the SP500 to the UK is 2.9%. The UK represents the third highest country-level revenue exposure. The US is at 68.8% and China is at 4.9%. Thirty SP500 companies get more than 10% of their revenue from the UK.

SP500 Companies with Highest Revenue Exposure to the UK

Fed

The Fed released their latest version of the dots plot at their meeting this week. The “dots plot” is the Fed Governors estimate of the future path of interest rates. Eleven participants called for two rate hikes this year and six called for one rate hike. The estimate for this year is 0.875%. The 2017 estimate is now 1.625% versus 1.875% in March, implying three rate hikes. For 2018, the estimate is now 2.375% versus 3.00% in March, also implying three hikes. The long term median estimate fell by 25 basis points to 3.00%.  James Bullard of the St. Louis Fed thinks the FOMC should hike one time this year and then leave rates stable for two years.

Median Assessment of Appropriate Monetary Policy From FOMC Participants

Economy

The consumer price index (CPI) was up 0.2% in May and is up 1.0% year over year. Energy prices rose 1.2%. Food prices fell 0.2%.

Core CPI increased 0.2%. Shelter rose by the biggest amount since February of 2007, up 0.4%. Apparel prices jumped 0.8%. Medical services increased by 0.5%. Medical care commodities fell 0.2%. Year over year core CPI is up 2.2%.

Core service inflation hit the highest year over year rate since September of 2008, rising by 0.3% for the month and 3.2% year over year. Given the current tight labor market, higher wages will begin working their way through the pipeline and probably push service prices higher in the near to intermediate term. So while inflation might be slowing building in the system the Fed is reducing estimates for the future path of interest rates.

Housing starts fell slightly, by 0.3% in May. Starts have been stable at around the current 1.164 million annual rate for the last year. Building permits rose by 0.7%.

The Philly Fed General Business Activity Index increased to 4.7 in June, reflecting moderate expansion in factory activity. But the Empire Services Business Activity Index dropped 2.3 points to 3.2, indicating slightly slower activity.

Jobless claims rose to 277k, the first increase in five weeks.

Retails sales were up 0.5% for May. Over the last two months, retail sales are up 1.73%. That is the strongest two-month performance since April of 2014.

Demand for Debt

The yield on Germany’s 10-year bond dropped into negative territory. As of Tuesday it was yielding -0.008%. There is now about $10 trillion in global sovereign debt with negative yields. Corporate debt is also at ridiculously low yields. A Unilever 2020 bond now yields -0.02%. Toyota Finance issued $186 million (in yen) of three year notes yielding 0.001%.

Demand for Debt

GDP Estimates

The Atlanta Fed’s GDPNow increased their Q2 GDP estimate by 0.30% to 2.80% due to improved forecasts for real consumer spending growth and real residential investment growth. The NY Fed’s NowCast decreased by the same amount, falling to 2.10%.

GDP Estimates 06 17 2016

Summary

This week should be all about the Brexit vote. Equities fell slightly last week. German 10-year bonds went negative. The outcome of the vote will likely determine the near term direction of the market. As has been the case for a long time, economic data was mixed as the economy continues in slow growth mode.

Week Ending 6/10/2016

PERFORMANCE

The SPY (SP500 ETF) made a run at its all time high on Wednesday, but fell short. The SPY closed at 212.37, the all-time high was 213.50 set on May 21, 2015. The market sold off after that closing on Friday at 210.07, dropping a little more than 1% from Wednesday. The market has now made six attempts over the last year at cracking the high but has failed. However, it still is holding above the declining trend line dating back from last year.

According to this week’s Barron’s, 23 times since 1929 has it taken 300 days or more to make a new high. But when it has happened, the SP500 has advanced an average of 15.6% during the following year.

Of course, there is also the chance that the failed attempt will lead to a sell off, as did the previous five attempts. There is a negative divergence between the moving average convergence divergence (MACD) histogram on the bottom of the chart and the price action up top (see the yellow lines). The MACD, which measures the relationship between the 26-day and the 12-day moving average, is trending down while the SP500 has been trending up. That is called a negative divergence. Sometimes, certainly not always, such a divergence indicates a weakening of price momentum that will signal a near-term decline in the market.

SPY 6 10 16

For the week, the SPY was down just barely, -0.10%. International markets took the bigger hit, the VXUS (international x-US ETF) dropped 2.09% on the week. There is new concern that the UK may actually vote to leave the European Union. The markets have been pretty much forecasting a “no” result, but if sentiment begins to trend towards the “yes” camp we could be in for a wild ride in equity markets. Bonds and oil were up on the week, although oil fell 4.2% on Thursday and Friday.

Performance 6 10 2016

MARKET VALUATION

There has been a tug-of-war between those in the overvalued versus the undervalued camp. We have stated before that based on traditional metrics the market is somewhat overvalued (you can argue about the degree), but when taking into account low interest rates, the market might be somewhat undervalued. Here is another notch in the undervalued camp, albeit a very slight undervaluation. Bloomberg Intelligence Economics has recreated Nobel Prize-winning economist James Tobin’s Q ratio. The Q ratio measures corporate net worth and compares the total value of corporate shares against the replacement cost. The ratio is currently 0.97 indicating that the stock market is valued just less than the replacement cost of its assets. An even reading of 1.00 would be fair value.

Tobin's Q Ratio for Q1 6 10 2016

FED/INTEREST RATES

Janet Yellen gave a speech on Monday and was relatively upbeat. Yellen says positive economic forces still outnumber negative forces. Yellen did not give any guidance on a June or July rate increase.

Interest rates fell this week across the curve and got slightly flatter. The 2-year dropped 7 basis points, the 10-year was down 9 basis points and the 30-year was down 11 basis points. There is so much debt at negative yields around the world that investors continue to be drawn to higher yielding US securities. In the chart below, Japan, Germany, France and Italy are all yielding negative rates going out a few years.

Yield Curve for Government Bonds in Six Major Markets

JOBS

Jobless claims declined to 264k. It was the third drop in four weeks. The Job Openings and Labor Turnover Survey (JOLTS) report for April showed that total job openings are now at their highest level ever. The rate for all separations (people quitting, terminations and retirements) remained roughly flat. Together, these reports are at odds with the negative non-farm payroll hiring report from last week. There might be a mismatch between job openings and the applicants with the proper skills to fill those positions.

Openings Match Record High from July 2015 - Bloomberg

ECONOMIC INDICATORS

The OECD U.S. Composite Leading Indicator moved up 0.02 points to 98.9 in April. This was the first increase since July of 2014. Service revenues rose 3.6% year over year during Q1, that was the fastest pace in three quarters. The Freight Transportation Services Index was up 1.3% in April, its first increase in three months.

GDP

There was no change in the estimates for Q2 growth for either GDPNow or the NowCast. GDPNow is projecting 2.50% and the Nowcast forecasts 2.40% growth for Q2.

GDP Estimates 6 10 2016

SUMMARY

The market came close, but could not break through to a new high. In the 5-previous attempts, the failure led to a sell-off. However, this was the first attempt above the declining trend line.The market is beginning to get nervous about a “yes” vote on the Brexit.  Economic data was decent for the week.

Week Ending 6/3/2016

PERFORMANCE

The equity markets were flat to slightly up. The SP500 (SPY) was up 0.02%, the overall US market as measured by the VTI was up 0.28%, international markets advanced 0.86% and the aggregate bond index was up 0.61%. The US dollar declined by 1.96% and crude fell by 0.91%.

Performance 6 3 2016

The SPY has held just above the declining trend line that it broke through last week. On Thursday the SPY closed at 210.91. That was the high for the year. The all-time closing high was 213.50 set on May 21, 2015. However, when adjusting for dividends, the Thursday close of 210.91 represents the all-time high. The May 21, 2015 adjusted close is 209.04 after dividends (per Yahoo Finance).SPY 6 3 2016

On each of the first three days of June, the market has started lower and worked its way up to close towards the high of the day. Some market-followers would consider that a bullish sign as supply could not overcome demand, even with the terrible payroll report (see further below).

PAYROLL

Non-farm payrolls rose only 38,000 in May. This was a huge miss. Estimates were for 100,000 plus. It was the lowest number in almost six years. Numbers were also revised downward for March and April.  The number probably would have been about 35,000 higher without the Verizon strike but that is still much lower than expectations. The disappointing payroll number significantly lowered the chance of a Fed rate increase in June, given that one of the conditions to increase rates was continued improvement in the labor markets.

The Vanguard economic model, which we talked about at our April webinar, forecast a high likelihood of a “growth scare.” Vanguard defined that as a fall in monthly nonfarm payrolls below 50,000, exactly what happened. Writing on May 5, Vanguard economist Joel Davis said, “At this stage in our long economic expansion…slowing job growth is not a sign of recession. It’s a symptom of a labor market near full employment…our analysis of financial and economic variables puts the odds of a near-term recession at about 10%. So brace for bad headlines. Prepare to put the data in a broader – and less alarming – economic context. And fight the fear with patience and perspective.”

Vanguard Odds of a US Recession

But economists at JP Morgan are placing a much higher probability of a US recession in the next 12 months. Putting the probability at 36% this week. That is the highest level during this economic recovery.

“Goods-producing” payrolls dropped by 38,000 in May. It was the fourth consecutive month that payrolls have fallen in this sector. According to David Rosenberg, chief strategist and economist at Gluskin Sheff, “this is precisely the sort of rundown we saw in November 1969, May 1974, October 1989, November 2000 and May 2007” that foreshadowed a recession by an average of five months.

The unemployment rate fell to 4.7% but that was due to about 500,000 people leaving the work force.

But even with the fall in new jobs, average hourly earnings was up 2.5%, year over year, indicating a tightening labor market.

On a more positive note, the initial jobless claims report came in at 267k, down 1k from last week. 267k is a historically low number.

GLOBAL RISK

The probability of a global recession is also increasing and is much more likely than a US recession. We have been on recession watch outside the US for several months now. The global manufacturing PMI fell by about 0.1 to an even 50.04 in May, indicating flat manufacturing activity.

NDR Global Manufacturing PMI

One bright spot, 71% of the reporting entities were in expansion mode, up from 60% last month.

PMI for May 2016

OTHER ECONOMIC REPORTS

The ISM Non-Manufacturing Index fell to 52.9. Anything above 50 is considered as expansion, but 52.9 was the lowest number since September of 2013.

There were positive personal income and spending reports. Nominal incomes were up 4.91% year over year and spending rose 0.94% month over month. The savings rate is 5.3% indicating that US consumers are in decent shape.

Factory orders were also a positive. They rose 1.9% in April, the most in six months.

GDP ESTIMATES

Even in the face of the non-farm payrolls report, the GDP estimates held in there. The Atlanta Fed’s GDPNow estimates Q2 growth at 2.50% (down from 2.90% last week). The NY Fed’s Nowcast forecasts Q2 growth at 2.40% (up from 2.20% last week).

GDP Estimates 6 3 2016

SUMMARY

Economic news tilted negative this week but there were some positive reports. The non-farm payrolls report was such a huge miss it is hard to ignore. The global economy did take a step back and appears closer to a global (not US) recession. The equity markets held strong.