Jeremy Grantham’s second quarter letter:
Monthly Archives: July 2014
Notes from Barron’s 7/28/2014
Up & Down Wall Street
The column talks about the growth of part-time jobs, especially at the expense of those who want to work full-time. The June survey shows that about 23% of those who got part-time jobs would rather work full-time.
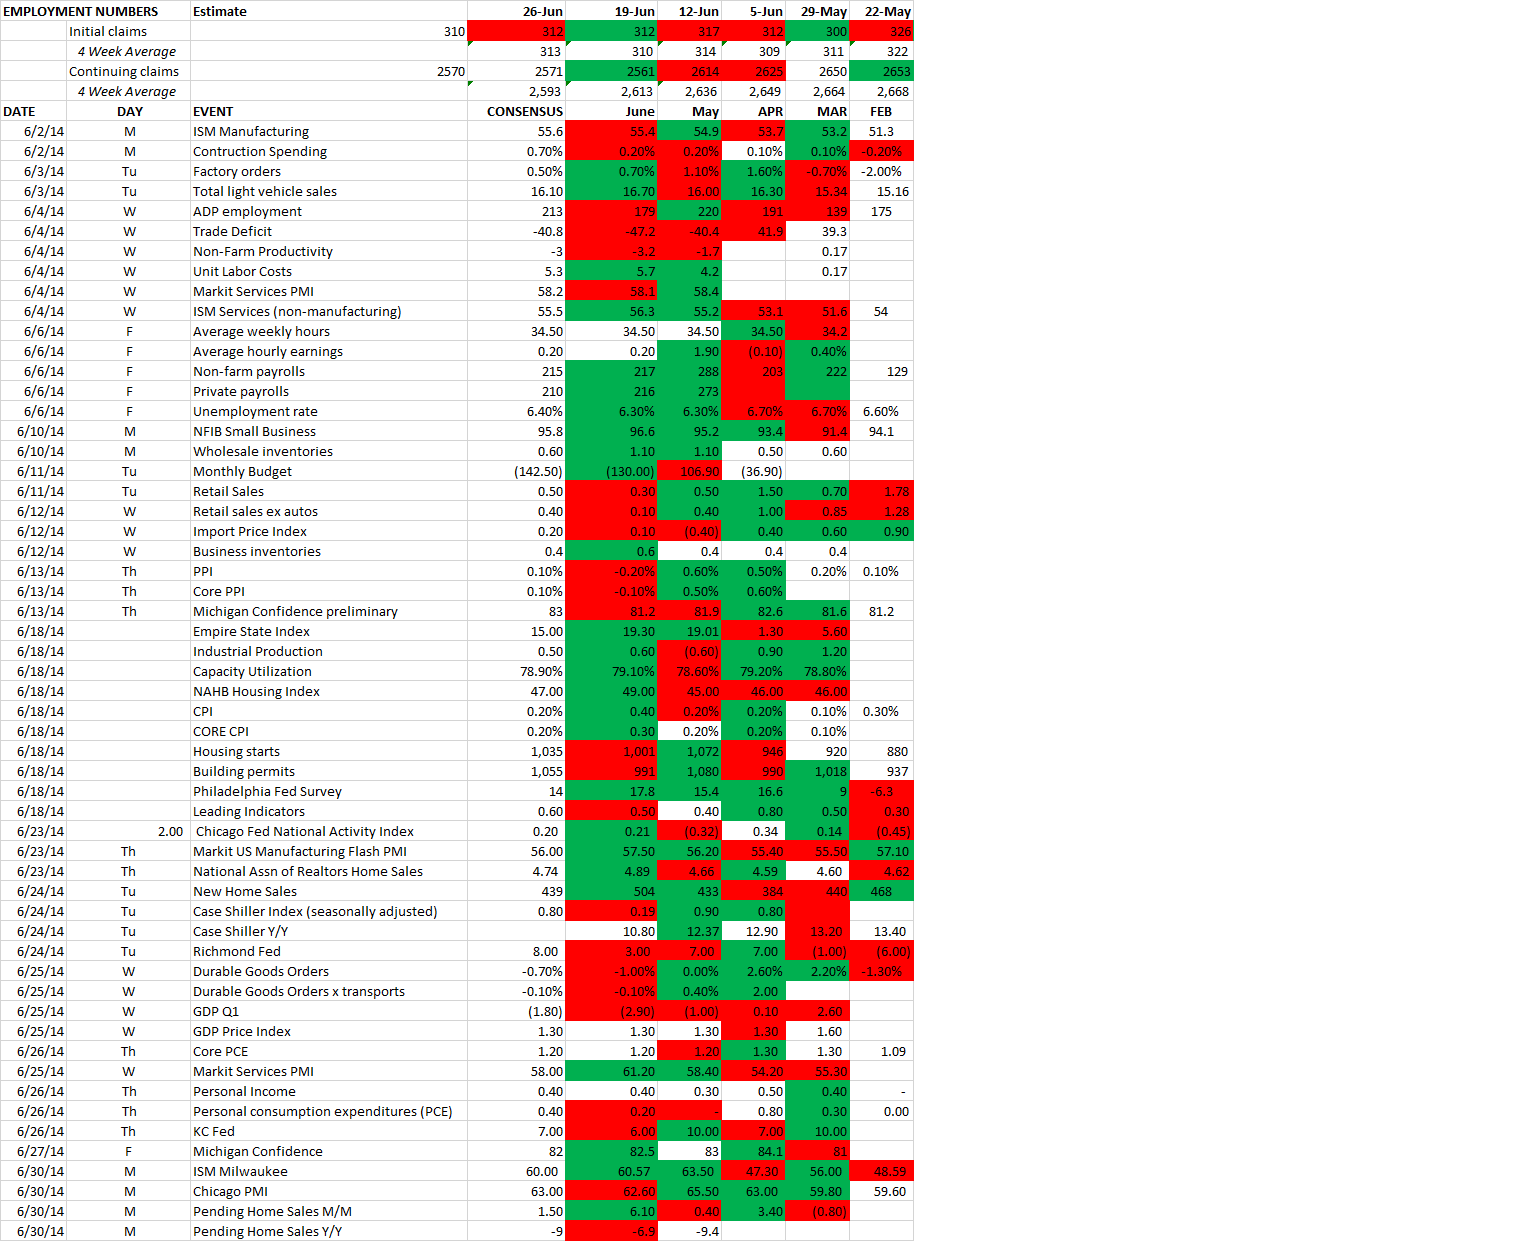
New claims for unemployment had a big decline to 284,000, lowest number since the last recession began. Unemployment rate is at 6.1% but wage growth is only 2.3% year over year.
STREETWISE
ESRX looks good now. Trades at13x, 10–year median is 17.4. Retention rate is predicted to be about 94% due to account managers that have left from the Medco purchase, but bears think it can be much lower. Earnings expected to grow 14% in 2015.
REVIEW
Money funds that serve institutional investors cannot stick to the $1 per share value and prices must reflect market values. Funds can also temporarily block withdrawals during market emergencies. S&P was about flat and the Dow was down 0.82% on the week. New home sales fell 8.1% in June.
52-Week high and momentum investing
Link to the research paper by Thomas George and Chuan-Yang Hwang.
Here is the Abstract:
ABSTRACT
“When coupled with a stock’s current price, a readily available piece of information—the
52-week high price–explains a large portion of the profits from momentum investing.
Nearness to the 52-week high dominates and improves upon the forecasting power of
past returns (both individual and industry returns) for future returns. Future returns
forecast using the 52-week high do not reverse in the long run. These results indicate
that short-term momentum and long-term reversals are largely separate phenomena,
which presents a challenge to current theory that models these aspects of security
returns as integrated components of the market’s response to news.”
________________________________________________________________________
Some notes:
The 52-Week High and Momentum Investing Notes
Jegadeesh and Titman showed that a strategy that buys the top 10% and sells the bottom 10% ranked by 6-month returns and holds for six months produces profits of 1% per month. Others have documented long term reversals in stocks. Poorly performing stocks in the past will do better than outperforming stocks over a 3-5 year period. These are two different phenomena.
The 52-week high explains a lot of the profits from momentum investing. Traders are slow to react to good news. Nearness to a 52-week high outperforms a strategy based on past returns.
When stocks are close to the 52-week high, traders do not want to push the price higher even in the face of positive information that would justify the new high. Eventually information will move the price to a new high.
This might have to do with anchoring bias.
January has a negative effect on the 52-week and the momentum strategies.
The paper looked at three momentum strategies. They were:
- Long (short) position in 30% of top (bottom) performing stocks.
- Use industry returns. Long (short) position in stocks within the 30% of the top (bottom) performing industries.
- How close the current price is to the 52-week high. Long (short) based on how close (far) the stock is from the 52-week high.
The 52-week high strategy outperformed and the outperformance was even greater when excluding January.
http://basehitinvesting.com/wp-content/uploads/2013/01/52-Week-High-and-Momentum-Investing.pdf
Bruce Greenwald in London (2005)
The great Columbia Professor Bruce Greenwald taped in 2005 at the Gabelli Value Investing Conference.
Lecture 1: https://www.youtube.com/watch?v=OT-U0oUFnEc#t=4728
Lecture 2: https://www.youtube.com/watch?v=kbuaqw0PZGk#t=6264
Notes from Barron’s 7/21/2014
UP & DOWN WALL STREET
The market dropped more than 1% on Thursday hit by news of a Malaysian Airlines flight being blown out of the sky and the invasion of Gaza by Israel, in response to never ending rocket attacks on Israel by the Palestinians. However, by Friday, the scare seemed to be over as the market recovered most of its losses.
Janet Yellen, in Fed testimony, said that market valuations were not that far above historical averages but that “valuation metrics in some sectors do appears substantially stretched – particularly those for smaller firms in the social-media and biotechnology industries.”
A Fed report also noted that yield spreads on high-yield corporates and leveraged loans were very slim by historical standards. In recent weeks, HYG and HYS have seen pullbacks.
Doug Ramsey of the Leuthold Group says that smart money has been buying puts on the OEX.
Global bond yields are extremely low and the 10-year German bunds hit a record low yield of 1.13% on the 10-year. The 10-year treasury is under 2.5% and the 30 year is at 3.3%.
Leon Cooperman says the question is “How high is high?”
The legendary investor Leon Cooperman was on CNBC this morning. In the past Cooperman has stated that a market decline is usually associated with an on coming recession. Today, Cooperman makes the case that there is no sign of a recession on the horizon. Cooperman lays out five signs that a recession is on the way, they are:
1. accelerating inflation,
2. inverted yield curve,
3. rising inventory to sales ratios,
4. declining employment,
5. rising initial jobless claims
Currently, the economy doesn’t show any of the above. Cooperman says the question becomes, “How high is high?”
“At the end of the day we will get to euphoria but we are nowhere near euphoria [now].”
To Infinity and Beyond
Don’t be surprised if the US Stock Market Cracks
Vitaliy Katsenelson writes about the fragility of this market.
Global economy slips
Last week we wrote that the global economy looked good based on PMI numbers. Based on economic numbers since then, that might not be the case. Looking at prices, in China the Producer Price Index (-1.1%) declined and in Germany the Wholesale Price Index declined (-.7%). Looking at production numbers, Germany posted a 1.8% decline, the UK had an industrial decline of .7% and a manufacturing decline of 1.3%, France had an industrial decline of 1.7% and Italy declined by 1.2%. Unemployment numbers were not favorable in Australia and Canada.
However, on the flip side, Composite Leading Indicators continued positive for most countries as reported by the OECD for May, which was the most recent month reported.
At the half…
MARKETS
The SP500 finished the half up 6%. Most of the gain came in Q2, +4.7%. Volatility continued lower, the VIX dropped to its lowest level since February 2007. T-bonds and Gold were the leading assets classes, up 12.14% and 9.93%.
EMPLOYMENT
At the midpoint of the year the economy is showing some nice improvement. Employment numbers are coming in strong. ADP shows that private, nonfarm payroll increased by 281,000 in June, easily beating the consensus of 210,000. Construction increased by the most since February of 2006. Online help-wanted ads were up 3.2% in June and first-time ads increased 7%. Unemployment dropped to 6.10%.
GLOBAL ECONOMICS
Global numbers also are improving. Global manufacturing PMI increased to 52.7 from 52.1, the 19th consecutive month of improvement. The US and the UK had the strongest numbers (57.5 and 57.3).
Economic stats for June