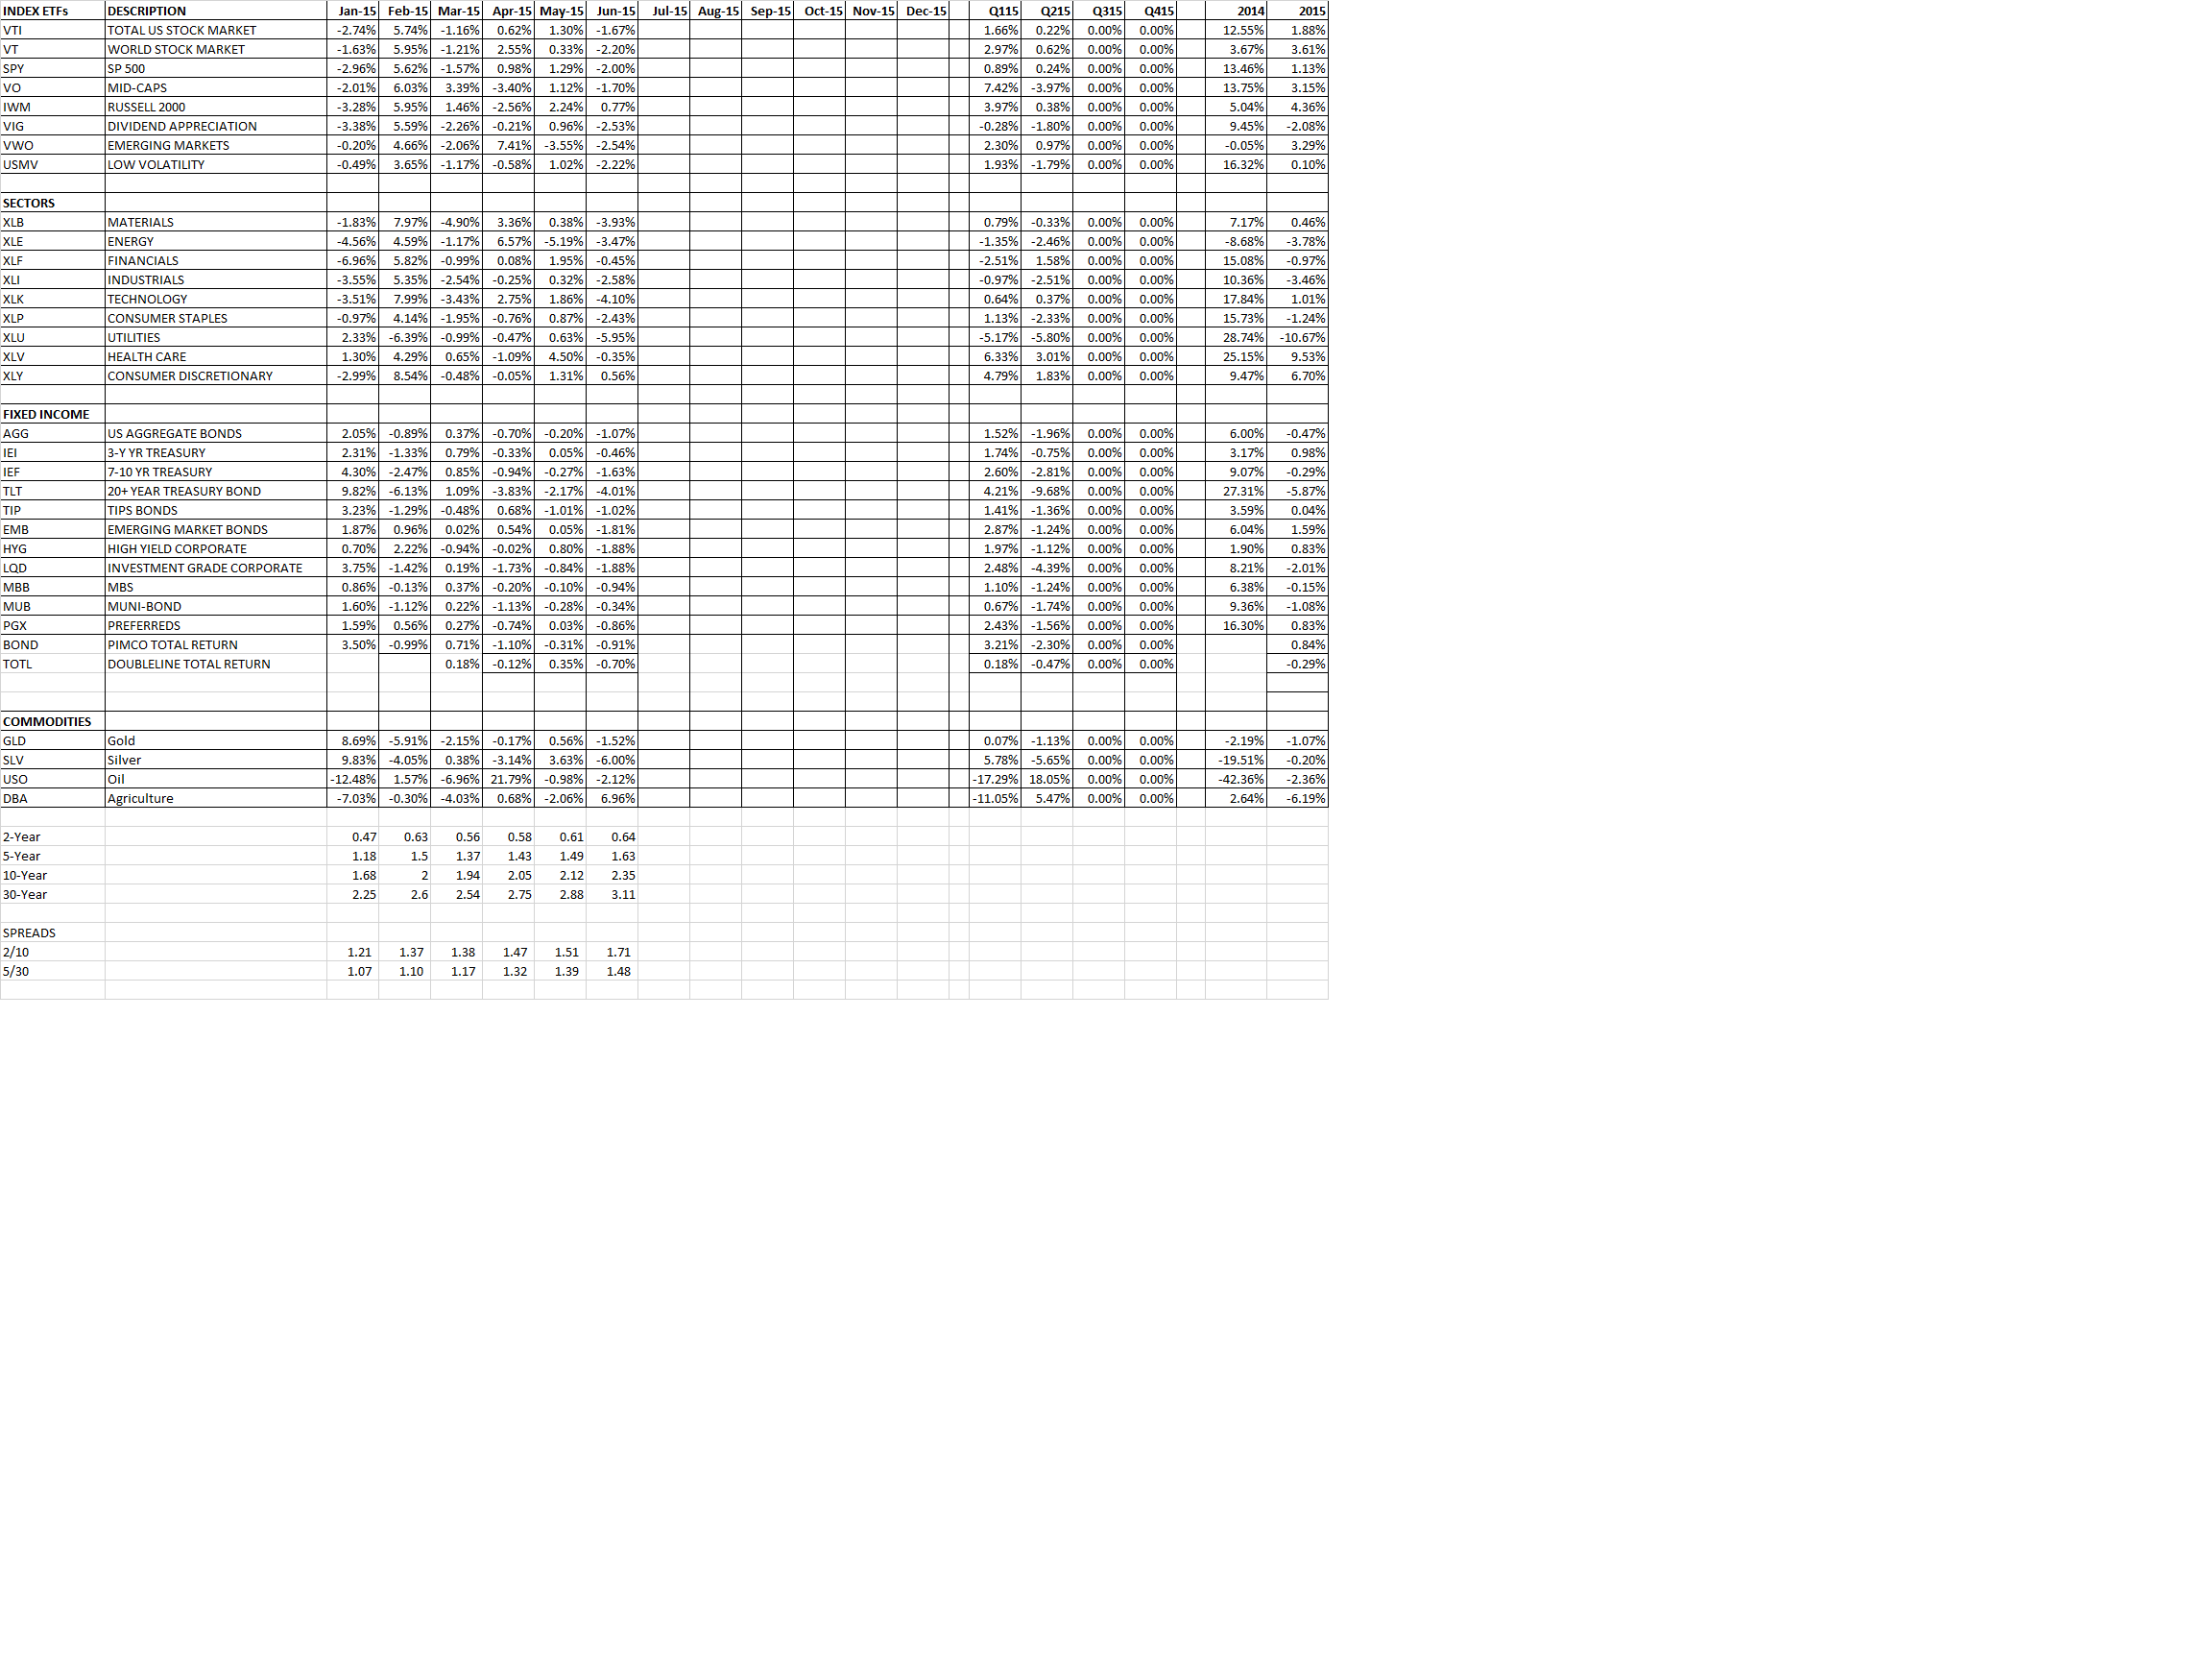
The SPY (SP500) was down 0.26% for the quarter but including dividends the index scraped out a total return of 0.22%. Year to date the SPY was up 1.11% including dividends. The VTI (overall US stock market) was up 1.88% and the VT (international markets x-US) was up 3.61%. The Dow Jones Industrial Average was down 1.14%. The AGG (aggregate bond market) fell by 1.07% year to date. All of these returns include dividends.
The market got hurt in the final two days of the quarter because of the fear of a default by Greece. The SPY fell by 1.91% the last two days. So the market dropped from a +3.07% to a +1.11% in the closing days.
Greece is the short-term catalyst over the near term and can push the market in either direction at this point.
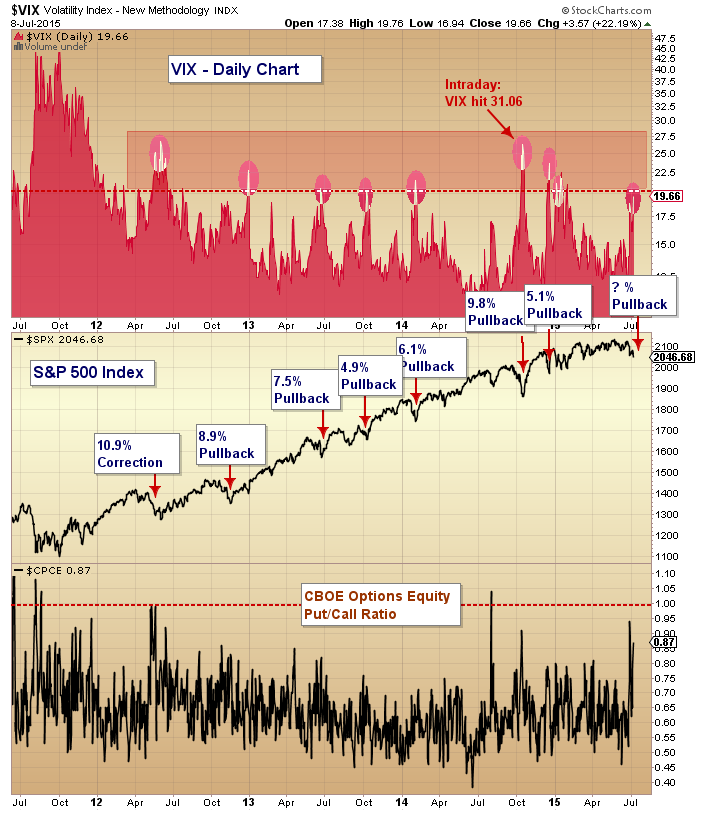
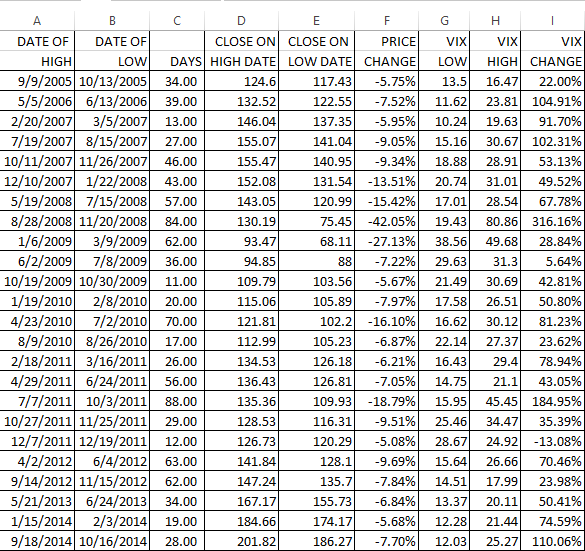
The first-half of this year was the first time that both the Dow Jones Industrial Average and long-term Treasuries (-4.7%) fell during the first six-months of a pre-election year. Despite the fall in the final couple of days of the quarter, most sub-industries are still trending higher. The equity markets are high based on traditional valuation metrics on a historical basis, but when you factor in current interest rates, market valuations seem about right. In early May, when the market was higher than it is now, Warren Buffet said “the market, based on normal interest rates, is on the high side of valuation, not dangerously high but on the high side of valuation. On the other hand, if these interest rates were to continue for ten years, stocks would be extremely cheap now.” The SP500 has not had a correction of 10% in 914 days, the third-longest such period ever.
Aside from Greece, what has spooked the market is higher interest rates. The Fed has alluded to higher rates for what seems like years now but has been extremely cautious to make the move. June was supposed to be the first liftoff date, but that didn’t happen. So we are probably looking at September. Whenever it is, the Fed has made it clear that they will be very cautious when it comes to raising rates so we do not expect a rapid rise barring some kind of shock to the economic system.
But the fear of a rise in rates did hurt anything that pays a decent dividend in the last quarter. REITs and utilities got hammered. The Vanguard REIT ETF (VNQ) lost 10.52% for the quarter and the Utilities SPDR Fund (XLU) lost 5.84%. There are now some compelling values in both sectors and the reaction might have been overdone.
The economy continues to plod ahead on a slow but somewhat steady course. That is the case in the US and around the globe. Ex-Greece, Europe is doing well. 88% of Eurozone countries report PMI readings above 50. PMI stands for purchasing managers index and is an indicator of the economic health of the manufacturing sector. A PMI of more than 50 would represent an improvement over the previous month. Japan and India also improved while China was less than 50 but the rate of contraction has slowed there. The United States reported 53.6.
A correction is long overdue and can happen at any time, but we do not see such a correction leading to a bear market. We are cautiously optimistic on the equity markets at this time.