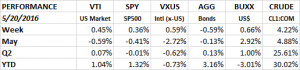
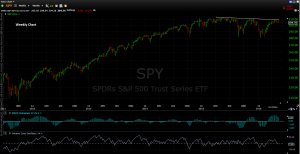
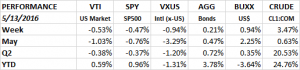
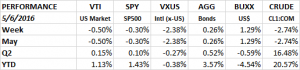
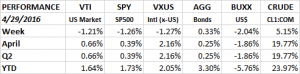
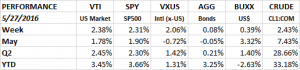
The SP500 broke higher on Tuesday and then finished strong on Friday to close at its highest closing price since 11/4/2015. It is, however, a little bit shy of its intraday high from April 20th. Overall, the SPY (SP500 ETF) was up 2.31%, the US markets (VTI) were up 2.38% and international (VXUS) advanced 2.06%. The aggregate bond index was about flat (+.08%), the US dollar moved higher (+0.39%) and oil continued its advance (+2.43%).
Equities managed to rally even though Fed Chair Janet Yellen made it clear on Friday that there is a good chance of an increase in rates in the near future. Assuming that economic data continue to show some type of growth (even if it is just above zero) and if payroll numbers continue to be strong, an increase in June or July is on the table. The federal-funds futures market is pricing in a probability of 34% for a June increase and 58% for a July increase.
TECHNICALS
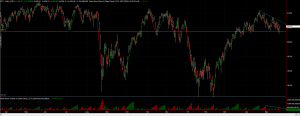
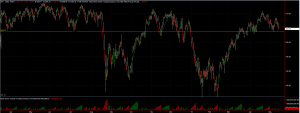
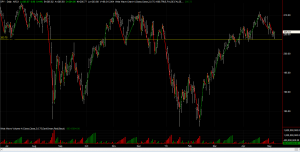
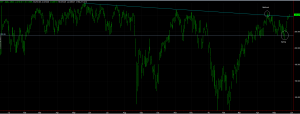
The SPY (SP500 ETF) broke through its declining trend line dating back to May of last year. For the long term trend to turn positive it will have to hold above this line and then push through last year’s high. On April 20th, the SPY did the same but could not hold the advance. In technical terms, this is called an “upthrust”. Market participants expect that when the price moves through a line of resistance, it will go on to higher prices from there as demand should now more easily overtake supply. When the expected demand does not show up, the price quickly falls.
The opposite happened on May 19th. On that day, the SPY fell below support. Market participants might think that the SPY was now going to head lower and the supply would swamp demand. But it turned out that the selling was declining going into that point and there was no more fuel to push the SPY lower. When that happens, that is called a “spring”. That set up the run we had last week.
ECONOMY
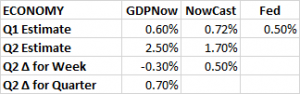
GDP
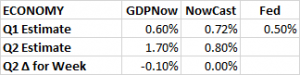
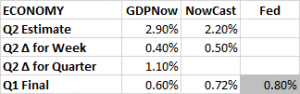
Q1 GDP was revised up to 0.8% from 0.5%. Q2 continues to track stronger than Q1. The Atlanta Fed’s Q2 estimate hit its high, coming in a 2.90%. The NY Fed’s Nowcast increased to 2.20%. Growth now shows some modest acceleration coming off of a weak Q1.
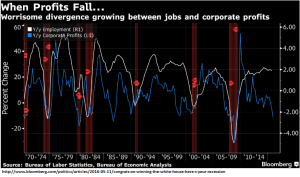
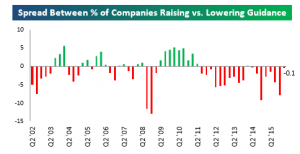
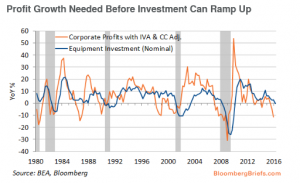
However, poor profit numbers over the last year, coupled with somewhat weak Regional Fed surveys (see the Richmond survey below) and company estimates of spending point to lower capital investment by business. There is a high correlation coefficient (0.84) between GDP growth and changes in capital investment. The slower investment will most likely hurt GDP growth going forward. The economy needs improved corporate profits to help increase capital spending.
Manufacturing
The Richmond Fed Manufacturing Activity Index fell in May by 15 points to -1. it was the biggest drop in a decade. However, the individual activity indexes looked good pointing to modest expansion down the road.
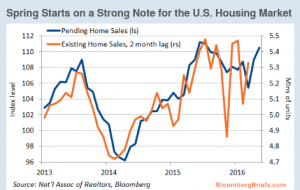
Housing
Mortgage applications have been improving. New single family home sales exploded higher, up 16.6% month over month and 18.1% year over year. It was the biggest increase since 1992 and sales hit the highest level since January of 2008. Pending home sales hit a post-crisis high.
Employment
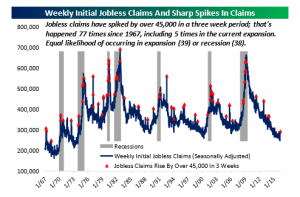
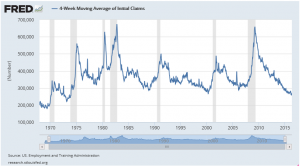
Jobless claims fell again, the number came in at 268k. We had a couple of weeks recently where the claims shot higher but the numbers are now back in sync with the strong reports we saw earlier in the year.
MARKET SENTIMENT
The American Association of Individual Investors bullish sentiment dropped to the lowest level in more than 10-years, coming in at 17.75%. But bearish sentiment also fell, dropping to 29.39%. The majority is now in the neutral camp at 52.86%. In the past, very low bullish sentiment readings have often been associated with positive market performance over the following year.
Barron’s Cover Story – “Why the Market Won’t Crash – Yet”
Barron’s has a good article this week on the near-term threat of a recession and a bear market. We have covered all of these topics over the last few months but this is a good review. Barron’s writes that the market is headed for another crash, but it always is headed for another crash, and it probably won’t be for a while. Market crashes are usually caused by a recession, although the decline usually begins before the recession arrives. Right now there does not appear to be a recession around the corner. Barron’s defines a market crash as a decline of 20% or more that lasts longer than 12 months.
Key reasons why there likely won’t be a crash soon:
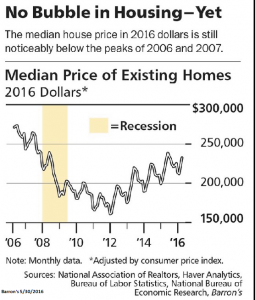
HOUSING – A crash in housing prices preceded the last recession, but prices are below the 2007 peak. The median price today is 12% lower than in July of 2007.
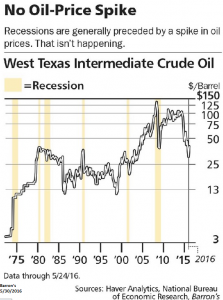
OIL – The price of oil usually jumps much higher before a recession. That is not the case today.
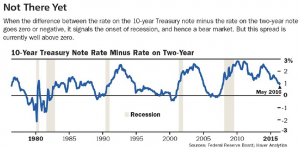
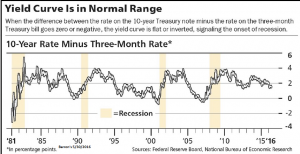
YIELD CURVE- when the curve is flat or inverted, is often signals a recession is on the way. That is also not applicable today.
Reasons that might signal a problem ahead:
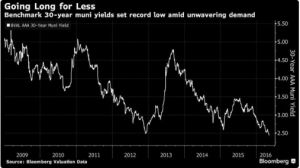
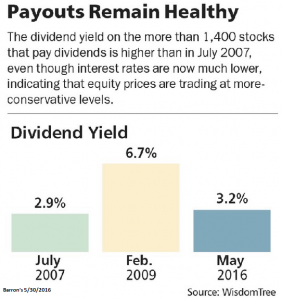
VALUATIONS – the current market p/e is 20.3, which is greater than the July 2007 p/e of 16.3. The offset to that argument is that earnings in 2007 reflected inflated earnings from the financial sector that eventually disappeared and that earnings today are understated by the problems in the energy sector. Another difference is the 30-year treasury bond yield was 5.1% in 2007 with a 2.9% dividend yield (on equities that pay dividends). Today, the 30-year yields 2.6% and dividends are yielding 3.2% (on equities that pay dividends). It would make sense that equity prices would be much higher given the lower bond yields, thereby, resulting in a lower dividend yield. But that hasn’t happened. Equities that pay dividends have a higher yield today even though the bond yields have declined dramatically.
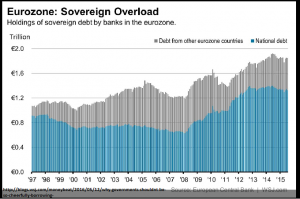
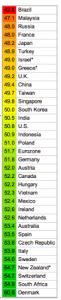
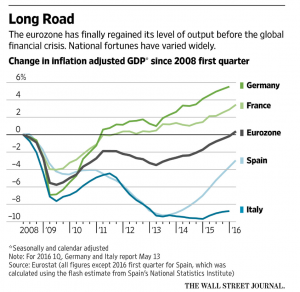
POSSIBLE GLOBAL SLOWDOWN – the international economy is barely above recession level.
TRUMP / TRADE WAR / DEFICIT- Trump raises the uncertainty level in key areas that can impact the markets including his position on trade and the deficit.
SUMMARY
The market appears to be setting up for another shot at its high. It failed the last time around April 20th. The economy has made some progress over the last few weeks. The Q2 GDP estimates are up the last couple of weeks and the employment numbers are solid.