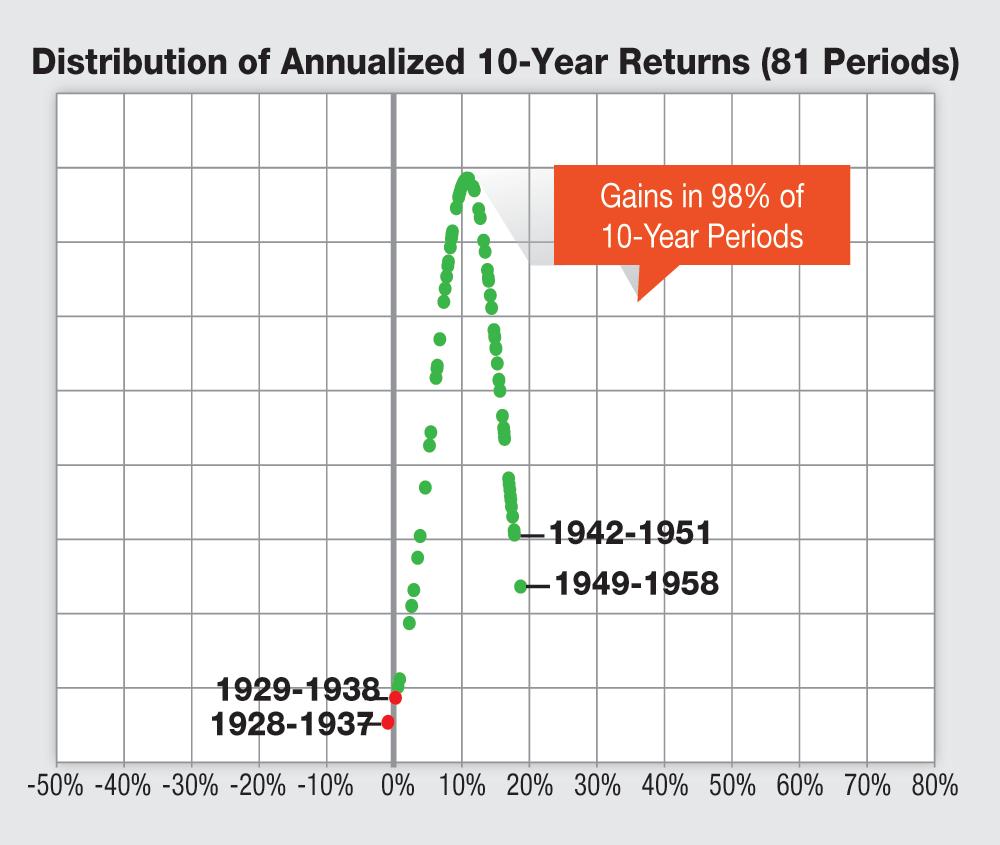
A historical look at the distribution of stock market returns over rolling 1, 2, 5 and 10-year periods since 1927.
Link to the article from AAII.
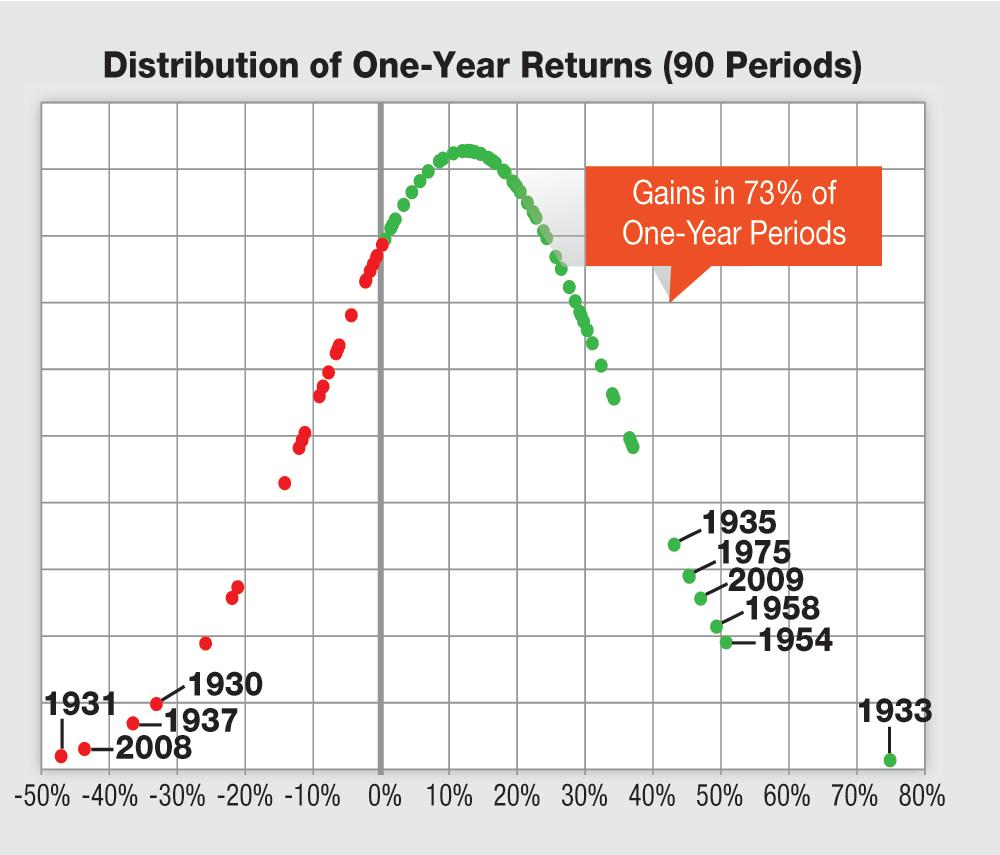
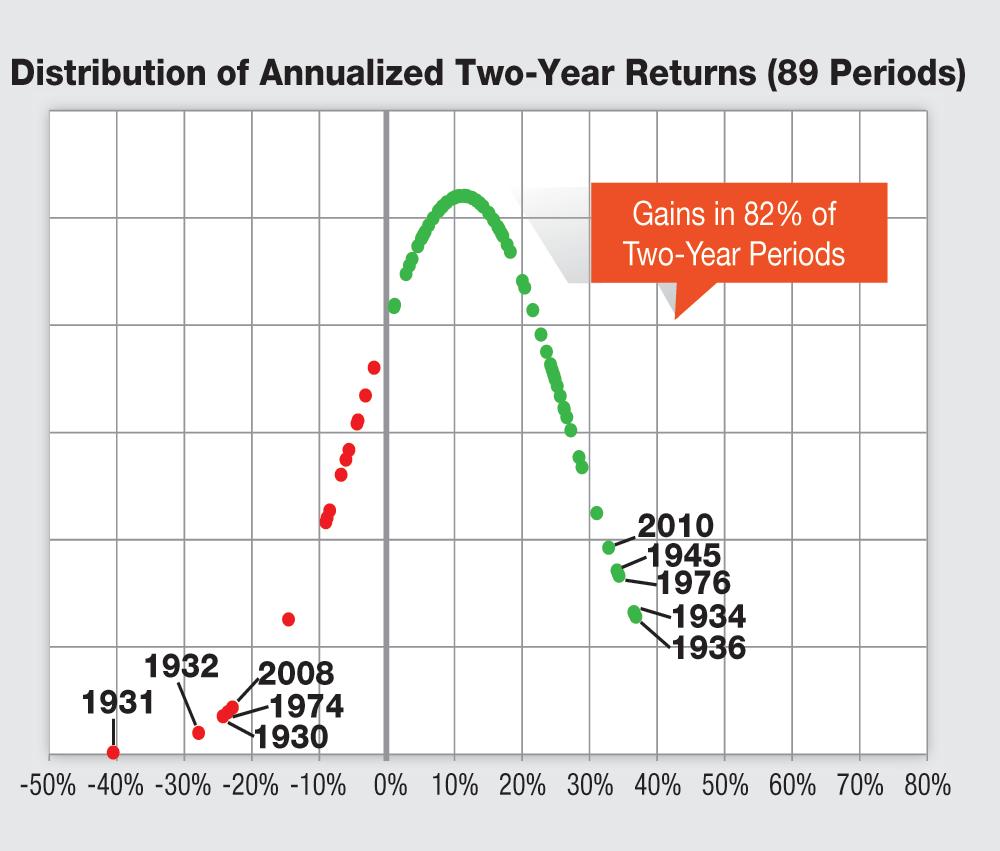
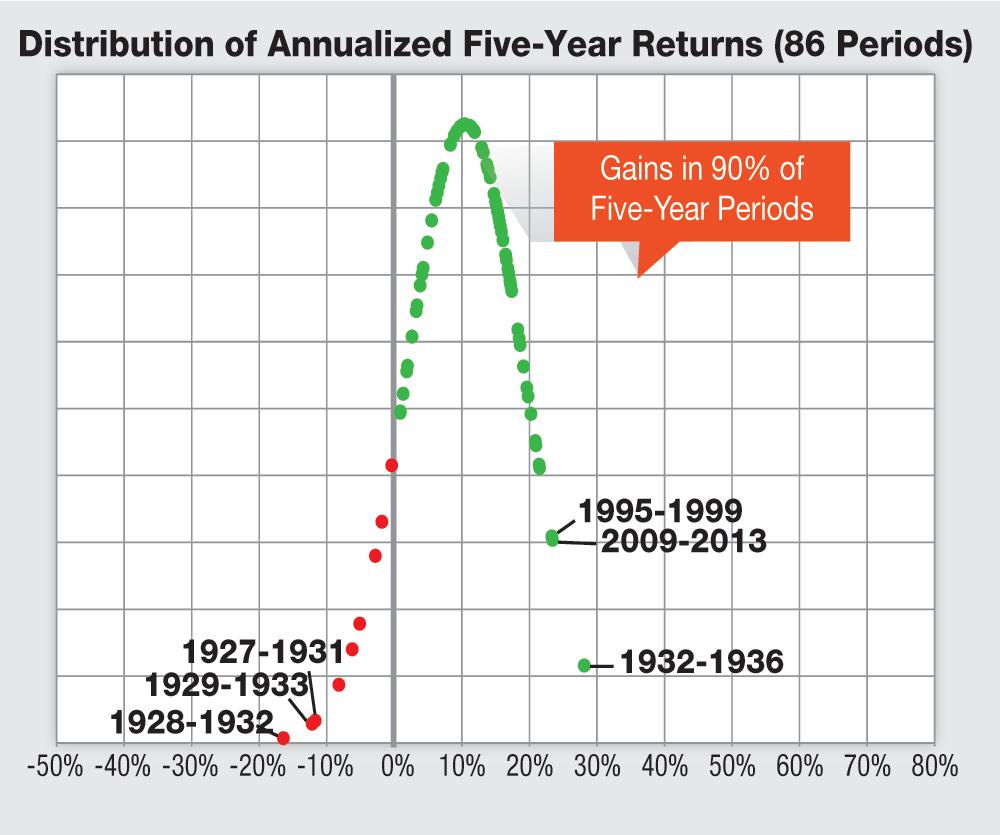

A historical look at the distribution of stock market returns over rolling 1, 2, 5 and 10-year periods since 1927.
Link to the article from AAII.
PERFORMANCE
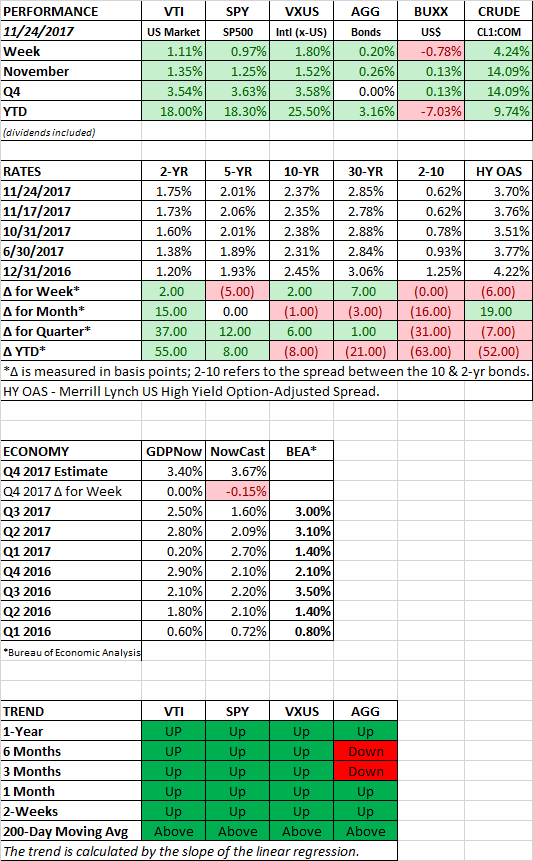
US equities set new highs as the market was up 1.11%. The S&P 500 closed just above 2600. International equities increased by 1.80%, also a new high. Synchronized economic growth around the world and strong corporate earnings have provided fuel to move prices higher.
Stock prices have run well ahead of analysts’ forecasts from the beginning of the year and even as recent as a few weeks ago. In the chart below, the light blue dot represents the January forecasted price and the dark blue represents the newer, updated forecast (as of October). With the close on Friday, the S&P 500 has now equaled or exceeded the year-end targets for all the banks shown below except for one.
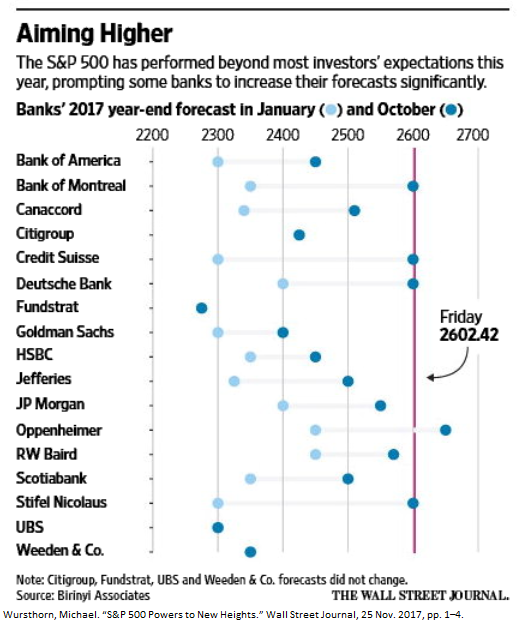
The truth is that it is difficult to make accurate forecasts. And it is not just equity prices. Look below at the track record in recent years for the 10-year Treasury yield. Economists have constantly been predicting rising yields, but they have been mostly wrong, at least so far.

YIELD CURVE
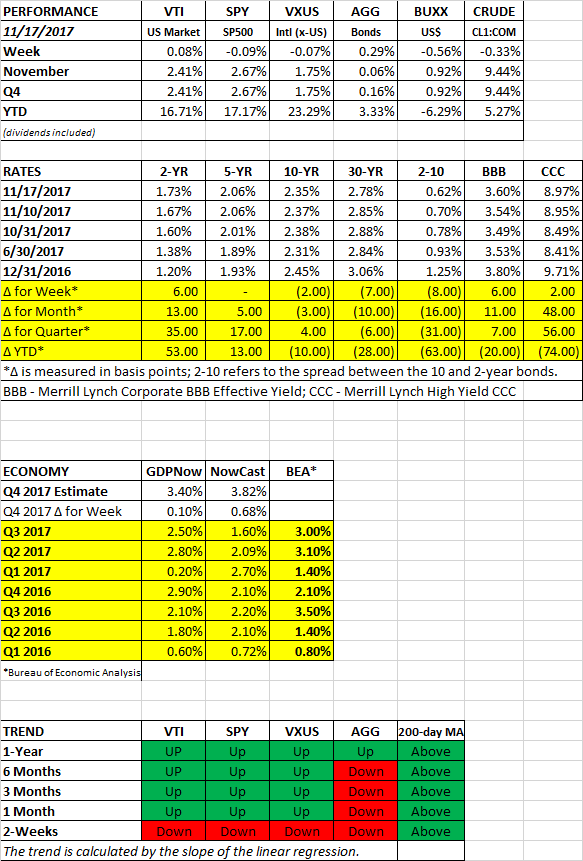
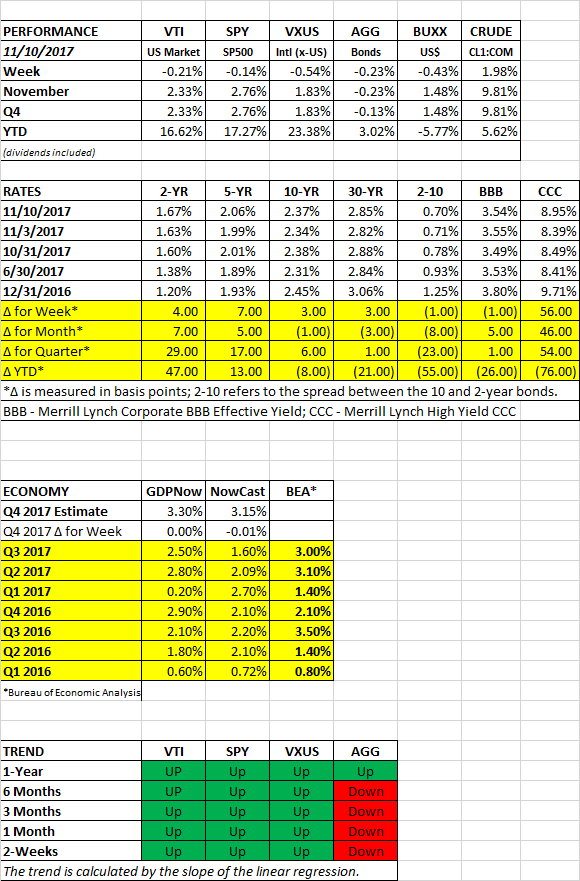
The spread between the 10-year and two-year US Treasury bonds has narrowed dramatically since the beginning of the year, down by 63 basis points (see the column titled 2-10 below). An inverted yield curve, when the near-term rate is higher than the longer-term rate, has often been a leading indicator for a recession. We are not in an inverted state yet, but we might be heading there.
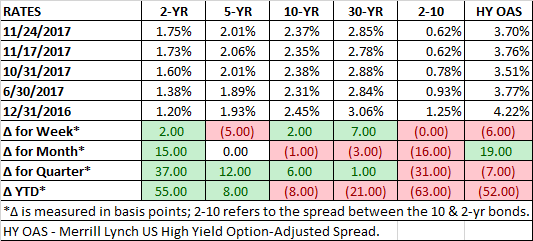
However, some economists think that this time is different. “This time is different” have been dangerous words in financial history, but we have been going through some extraordinary times. Central banks around the world are still artificially holding interest rates at zero or below, increasing demand for US government debt, and thus keeping the 10-year rate lower than it would naturally be. At the same time, inflation expectations have come down, and the Fed is increasing short-term rates, putting upward pressure on the 2-year. Since the beginning of the year, the 2-year has increased by 55 basis points while the 10-year has declined by 8 basis points.
By the way, you can find the weekly update for bond rates in our Scoreboard section each week in this newsletter.
SCOREBOARD
PERFORMANCE
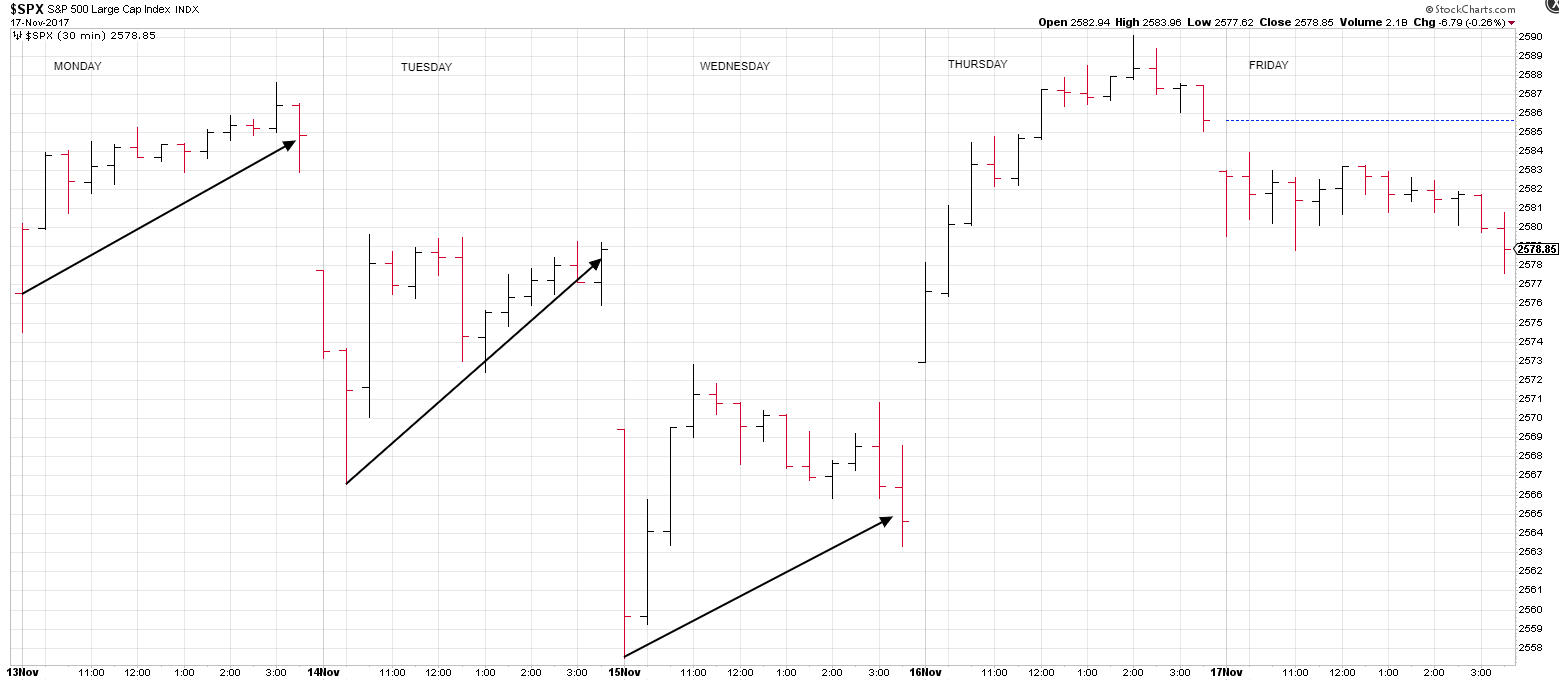
Markets ended the week flat as US equities were up by 0.08% while the S&P 500 was down by 0.09%, international equities fell by 0.07%. In what amounts to a correction in today’s environment, stocks sold off in the first hour on Monday, Tuesday, and Wednesday, but traders bought the dip each time and the market finished close to its high on each day. The market rallied on Thursday on the House passing tax legislation and on strong earnings from Wal Mart.
CRAZINESS ACROSS MARKETS
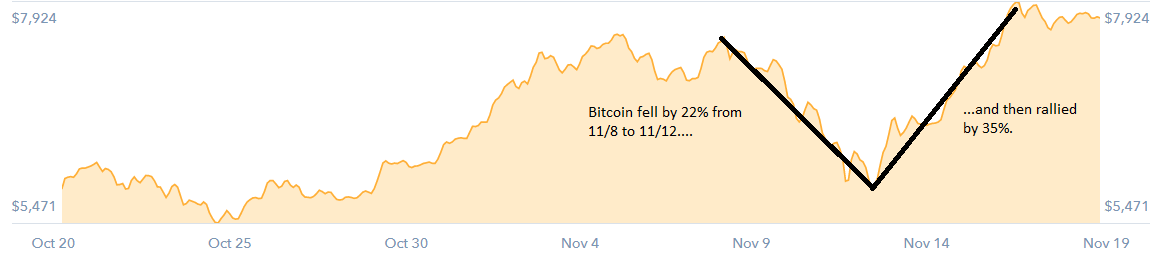
Two examples this week of the craziness across different markets. First, bitcoin, the high flying cryptocurrency, fell by 22% and then rallied by 35% to hit new highs, all in a matter of a few days.
And then in the art world, Leonardo Da Vinci’s Salvator Mundi was auctioned off for $450 million, shredding the previous record for the amount most paid for a painting.
EARNINGS
Per Thomson Reuters, earnings for Q3 are now expected to increase by 8.2% year over year. That is significantly higher than the 3.2% estimate in mid-October. Excluding energy, the estimate is 5.9%. In the S&P 500, 72% of companies have reported earnings that beat estimates. The current forward p/e ratio is 18.2.
ECONOMY
GDP growth estimates for Q4 look solid. The Atlanta Fed’s GDPNow model has growth coming in at 3.40% and the NY Fed NowCast is forecasting growth at 3.82%.
SCOREBOARD
When deciding on what kind of car to drive, consumers can make two small choices that can lead to big benefits later. First, go for the less expensive car. Second, buy instead of lease. Click for the article.
PERFORMANCE
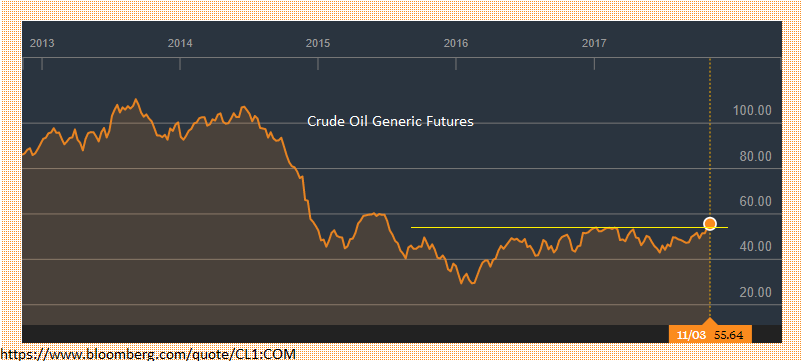
US equities fell by 0.21%. It was the first weekly decline since September 10. Investors were worried about the prospects for tax reform. International equities dropped by 0.54%, the dollar declined by 0.43% and oil continued its rally, +1.98%.
The close on Friday made it official, the S&P 500 set the record for the longest streak ever without a 3% correction. Click here for a link to our article on how the market performs after extended streaks without a correction.
Another streak in progress is days without a decline of 0.5% or more. It has now been 47 days, the longest streak since 1965.
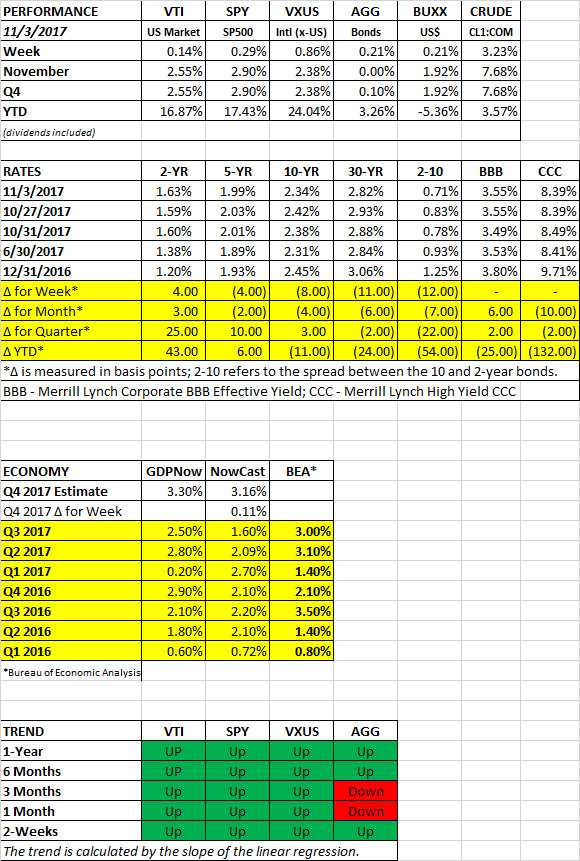
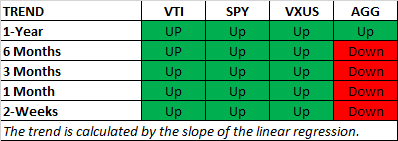
Bonds were down by 0.23% as interest rates increased slightly. The trend, as measured by the linear regression, for the bond aggregate is now negative in all the different time frames that we follow, except for one-year, as shown below.
DIVERGENCE BETWEEN HIGH YIELD AND THE S&P 500
Since late October the S&P 500 has been going in one direction (up) and the high-yield bonds have been going in another (down). Normally the two asset classes generally move together. When they diverge, it sometimes foreshadows direction. High-yield is often the leading indicator. A lot of the decline in high-yield is traced to the sell-off of a small group of widely held bonds. Sprint and T-Mobile ended their merger talks, and Teva Pharmaceutical’s and CenturyLink had poor earnings.

SCOREBOARD
HIGHLIGHTS
LONGEST PERIOD EVER WITHOUT A 3% CORRECTION
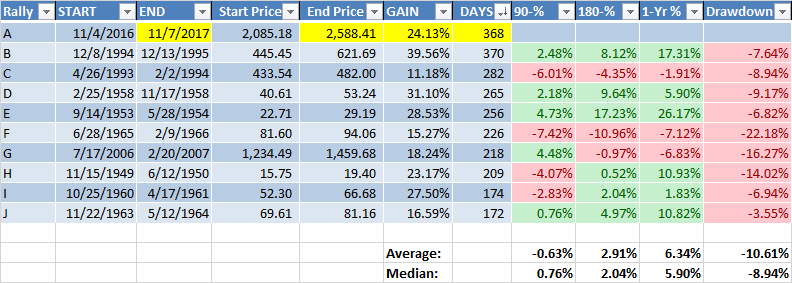
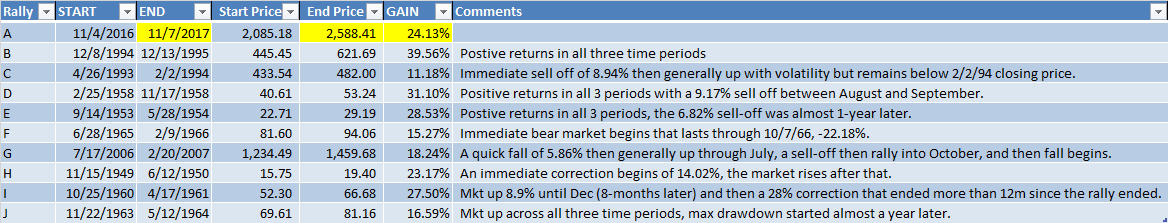
Barring a last-minute selloff, the S&P 500 will set the record for the longest period without a 3% correction on Friday, November 10th. That is 371 days. Only the run from December of 1994 until about one-year later is in the same class. After that, there were 8-periods that lasted between 170 and 300 days.
The chart below shows how the market performed over the next 90, 180 and 365 days, as well as the maximum drawdown from peak to trough during the subsequent 12 months.
SUBSEQUENT PERFORMANCE OVER 90, 180 AND 365 DAYS
What happens after these extended, non-volatile rally ends?
Two of the time periods (C and F above) had losses across the board. The period from April of 1993 until February of 1994 (C), and then the period from June of 1965 until February of 1966 (F).
If you at the percentage gain or loss in 90, 180 and 365 days, and ignore any drawdowns in between, the maximum loss was 10.96% in period F, and that was 180 days after the rally had ended.
In four of the nine examples (B, D, E, and J)., the market was up in every time frame measured. The maximum gain was 26.17% one year after the end of rally E.
In two of the examples (H and I), the S&P was down in value 90-days later, but up in the longer time frames of 180-days and one year.
And in the remaining example, G, there was a gain 90-days out but losses at the end of the 180-day and one-year time periods.
The average return over all nine-time periods was -0.63% for the 90-day time-period, 2.91% for 180-days, and 6.34% for 365-days.
The median return was positive across all time frames, 0.76%, 2.04% and 5.90% for 90, 180 and 365 days.
THE END OF THE RALLY LED IMMEDIATELY TO A DECLINE OF 10% OR MORE TWO TIMES
Of the nine periods, two of them, 1966 and 1950 (F and H), were periods where the end of the rally marked the high point before a decline of 10% or more. In 1966 (F), the S&P sold off by 22%, and in 1950 (H), it declined by 14%.
MAXIMUM DRAWDOWN
We also looked at the maximum drawdown over the subsequent 12-month period. The thinking was that maybe the end of the rally does not mark the beginning of an immediate decline, but what if it leads to more volatility which is a tip-off to a larger sell-off at some point in the next 12-months.
The maximum drawdowns averaged -10.61% with a median of -8.94%. The smallest drawdown was 3.55% and the largest was 22.18% over the following 12-months. Thus, in all cases except for one (J), volatility did increase to a certain extent.
CALM BEFORE THE STORM
If there was ever a case of the calm before the storm it was the run that started in July of 2006 and ended in February of 2007. The S&P 500 would move sideways to higher until July by +6.4%, then fall through mid-August by 9.5%, then rally to a new high by 11% into October. That would be the turning point for what would be the bear market of 2007 to 2009. In the one-year after the rally ended in February of 2007, the drawdown was 16.27%, but that was just a hint of what was to come. Ultimately, the market declined between October of 2007 and March of 2009 by 56.30%.
SUMMARY
We looked at nine-time periods and price action over the next year. There is only one period that is similar in length to our current period, and that was the rally from 1994 to 1995 (B). In that case, the market remained positive in the three-subsequent time-frames that we measured. Three other time periods (D, E and J) all had positive returns over 90, 180 and 365 days. Two periods had negative returns over all three-time frames (C and F). In two cases, the end of the rally marked the immediate beginning of significant declines of 10% or more (F and H), including one of 22.18% (F). And then in 2007, the bear market began about 8-months later, but most of the damage was done more than 12-months after the end of the rally.
The sample size is too small draw any definitive conclusions, but there is a definite pick up in volatility after these long rallies end as shown by the drawdown numbers, and there were losses of greater than 10% in three of nine examples.
HIGHLIGHTS
PERFORMANCE
The market finished the week at another high. US equities were up by 0.14%, international equities increased by 0.86%. The dollar advanced by 0.21%. Bonds were up by 0.21% as the spread between the 10 and the 2-year note dropped by 12 basis points to 0.71%. That is down from 0.93% on September 30th and from 1.25% on December 31.
Oil broke out to a new year two year high, as crude oil futures were up by 3.23%.
NEW FED CHAIR
President Trump nominated Jerome Powell to succeed Janet Yellen as the new Federal Reserve Chair. With Powell, Trump gets a consensus-driven leader that will likely stick to Yellen’s laid out plan of gradual interest-rate hikes and the unwinding of the balance sheet. But Powell is more in tune with the Republican deregulation agenda.
Powell will become the 15th chair in the 103-year history of the Fed. According to Ned Davis Research, the average gain during the first six months after a new Fed chair for the Dow is 2.1%, with a median drawdown of 10.5%.
The Fed is expected to raise interest rates in December.
EMPLOYMENT
Nonfarm payroll increased by 261,000. Average hourly earnings stayed the same month over month and are up 2.4% year over year. The unemployment rate dropped to 4.1%, a 17-year low. But the drop was primarily due to the decline in the labor force participation rate to 62.7% from 63.1%. Hiring in September was revised to a positive 18,000 from an original estimate of -33,000. The tight labor market has some economists now projecting four interest-rate increases in 2017, instead of three.

PROPOSED TAX PLAN
The House made public their proposed tax plan, titled the “Tax Cut and Jobs Act”, with the primary aim of helping businesses. For individuals, while there will be mainly winners, some will end up paying more in taxes. It is likely the plan won’t survive in its current form, and it may end up not being passed at all, like past Trump initiatives. The bill is designed to only cost the treasury $1.5 trillion over the next ten years. Here are the highlights:
SCOREBOARD