Monthly Archives: June 2017
Week Ending 6/23/2017
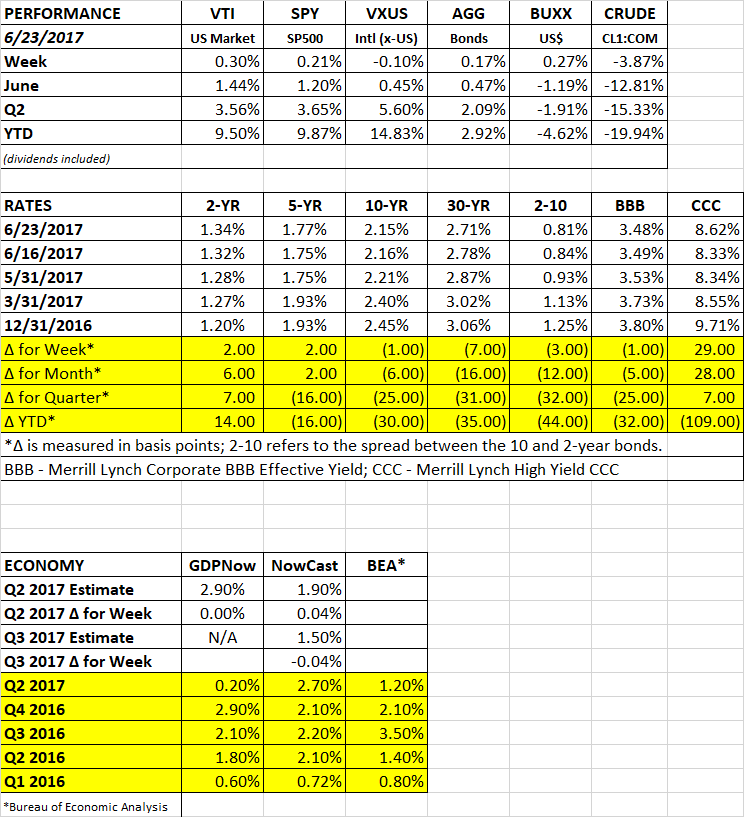
PERFORMANCE
The US equity markets were up about 0.30% while international markets fell slightly, down 0.10%. Health care had a big week, up 3.7%. A new Senate health plan would limit regulation in the sector.
The action continued to be in oil, where prices were off another 3.97%. The price of crude is now down to about $43/barrel. The consensus as recently as a couple months back was that crude would stay in the $50 range and slowly drift higher, but inventories have now been increasing for several weeks and the price has been going into reverse. There was hint that the high yield markets are starting to get nervous, the Merrill Lynch High Yield CCC Index jumped 29 basis points last week while the rest of the bond market was close to flat.
OIL
A big drop in oil prices at the beginning of 2016 contributed to the sell off at that time. But supposedly the weaker hands have gone bankrupt and the remaining companies have cleaned up their balance sheets and are in better shape. Time will tell if that turns out to be the case but it is worth watching if a divergence between high yield bonds and equities continues. More specific to the sector, oil and gas high-yield bonds are down 4% this month, according to ICE Data Services, and some of the weaker debt is down 26%.
Another knock-on effect of the lower oil prices is that it will cause the energy sector to have lower profits, and that might lower analysts projections for overall profits going forward. Investors have been counting on growing profits to power the recent market rally, but if oil continues to fall profit revisions are probably on the way.
YIELD CURVE
Investors are concerned about the flattening yield curve. A flattening yield curve normally signals slower growth. An inverted yield curve often signals recession. But before you get an inversion you start with a flattening. One argument though, is that “this time is different”, because of the suppressed yields worldwide, especially in Europe and Japan. Negative interest rates overseas have dramatically increased demand for US treasuries and thus pushed down yields further out on the curve leading to a flatter curve. Remember though that “this time is different” are often the most dangerous words in investing. The difference between the yield on the 10-year bond and the 2-year bond has flattened by 44 basis points this year and currently stands at 0.81%. For now though, the economy appears to be continuing to move along at the slow motion rate we have become accustomed to.
SCOREBOARD
Week Ending 6/16/2017
PERFORMANCE
The equity markets had small increases. The overall US market was up 0.05% and international markets were up 0.06%. But don’t let the flat results fool you, there was lots of news including Amazon buying Whole Foods, a change in leadership at GE, a Fed interest rate hike, and a gun attack on Republican baseball players.
Bonds increased by 0.27% as interest rates dropped, the dollar fell slightly and oil dropped another 2.38%.
AMAZON
Amazon announced its proposed purchase of Whole Foods on Friday for $13.7b. And based on every comment by the “experts”, all the competitors might as well just close up shop now and liquidate because Amazon is just going to roll them over. They may be right given what Amazon has done to the retail sector. Kroger dropped 10%, Costco down 7% and Wal-Mart down 5%. But I would give sharp operators like Wal Mart, Costco, Target, and others some credit. The one likely winner for sure will be the consumer. Because the supermarket space is now going to become even more competitive than it was before, with just about everyone pouring more dollars into advanced technology, fresher products, and probably lower prices. And the competitive pressure on prices will be forced down the entire supply line. The consumer will be the big winner.
GDP
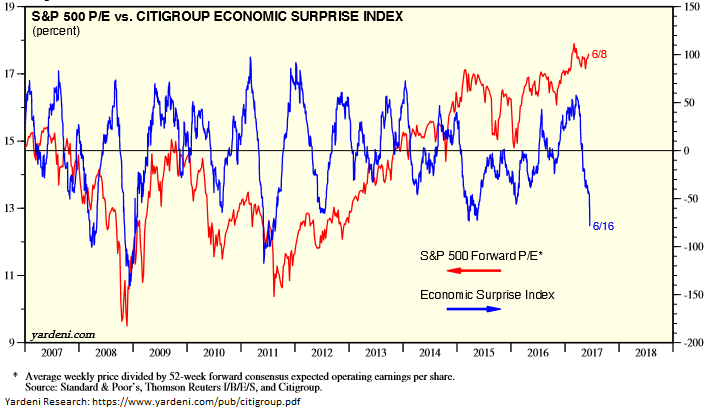
The Atlanta Fed’s GDPNow model is forecasting Q2 growth at 2.9%, down from 3.0% last week. A slowdown in residential housing contributed to the lower estimate as the number of annualized housing starts hit an eight-month low. That, along with several other indicators, such as new hires, lower inflation and weaker consumer sentiment have some worried that the economy is beginning to roll over. The lower numbers are reflected in the chart below, which compares the Citibank Economic Surprise Index versus the p/e on the S&P500. The Citibank index charts actual results versus expectations. When numbers are coming in less than expectations, the chart is headed down (as it is now). Normally, the S&P 500 p/e and the index roughly track each other, but recently there has been a big divergence, with the Citibank Index falling sharply while stocks remain elevated. The economic numbers have not been terrible in absolute terms (based on recent history), but they have not been meeting expectations. So, is the problem that the expectations were too high? Maybe a result of the post-election optimism. Or is the problem that this is indeed an economy where growth is now beginning to head in the wrong direction? We have been through this before over the last several years and the economy has rebounded.
This economy cannot get any serious traction north of 2% growth, and for now, we continue to believe that is the continued path for the near term. Slow growth in and around 2%.
FED
As expected the Fed raised interest rates by 1/4% and laid out plans to shrink its $4.5 trillion balance sheet. The Fed also said it plans to raise interest rates one more time this year if the economy performs in line with expectations. To begin with, the Fed will reduce its balance sheet by letting $6b in Treasury securities and $4b in mortgage bonds mature without being reinvested. Each quarter, the amounts would increase. The program would max out at $30b per month for Treasury’s and $20b for mortgage-backed securities. The balance sheet reduction could begin soon if the economy continues to perform.
OIL GLUT
Crude oil fell 4% on Wednesday on new reports regarding inventory. Crude inventory dropped by 1.7 million barrels, significantly less than the consensus forecast of 2.6 million. Gasoline inventories increased by 2.1 million barrels, much more than the estimated decline of 700,000 barrels. According to the International Energy Agency (IEA), oil inventory in the Organization for Economic Cooperation and Development (OECD) countries increased by 18.6 million barrels, and now stand at a higher level than when OPEC cut production last year and are 292 million barrels higher than the five-year average. The IEA expects US oil production to increase 5% this year and 8% in 2018. Overall, non-OPEC production should increase by 1.5 million barrels per day in 2018 versus an expected rise of 1.4 million barrels in demand.
SCOREBOARD

Highlights from the CFA Institute Annual Conference
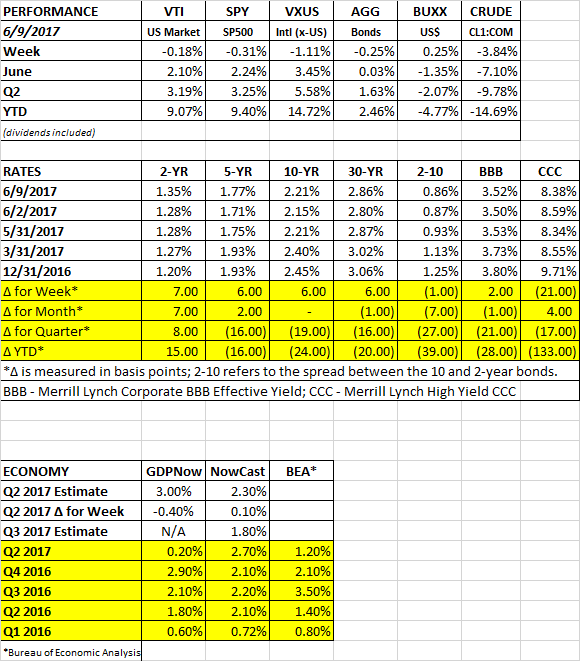
Week Ending 6/9/2017
PERFORMANCE
US equity markets fell slightly, down 0.18% on the week, but what was of interest was the Friday price action within the market. There was, so to speak, a reshuffling of the deck. For no apparent reason, the tech leaders that have driven most of this price advance, fell hard. The QQQ, which is made up of the high-flying NASDAQ 100, dropped 2.50% on the day. AMZN was down 3.16%, AAPL -3.88%, FB -3.30%, NFLX -4.73% and GOOG -3.41%. But the money did not leave the US equity markets, the SP500 was only down 0.08%. Instead, it seems like the sales of the tech shares turned into buys of some of the more beaten down sectors. For example, banks were up 2.86% and (KBE), oil and gas increased by 3.75% (XOP). Last week we highlighted that growth stocks were outperforming value stocks to the point that the ratio between their two p/e’s was at a record level, the moves on Friday was a small step in reverting to the mean. International stocks were down 1.11%, bonds were down 0.25% as interest rates rose by about 6 basis points across the curve, the dollar increased and crude and had another tough week, falling by 3.84% to $45.83 per barrel.
EARNINGS
According to FactSet, guidance on earnings have been coming in at a more favorable ratio than in the past. So far, 75 companies have announced negative guidance, roughly in line with the 5-year average of 79. But 37 companies have announced positive guidance, higher than the 5-year average of 27. That puts the negative to positive guidance ratio at 2.02 versus 2.92. Most of the positive guidance has been coming from the information technology and the healthcare sectors.
JOBS
According to the JOLTS survey, the number of job openings in April hit a record high of 6.044 million, indicating a jump in demand for labor. The report shows a skills mismatch between job openings and hires, as the gap has continued to widen.
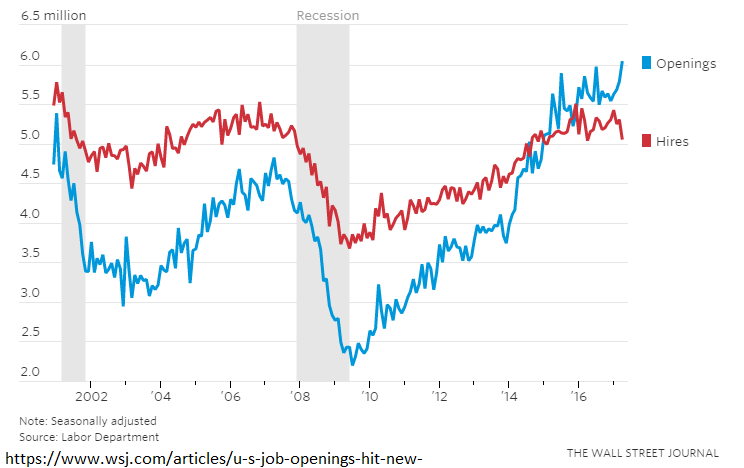
Initial claims for unemployment declined by 10,000 to 245,000, close to a 30-year low. Eventually, the tight labor market should translate into more wage growth.
A JOBLESS RATE THIS LOW HAS HISTORICALLY ENDED BADLY
The unemployment rate dropped to 4.3% last week. That has only happened during three other periods. In all three cases, subsequent excesses in market behavior led to economic problems.
In the late 1960 low unemployment set the stage for the inflation of the 1970s which in turn led to the recession of the early 70s. In the late 1990s, low unemployment preceded the height of the dot-com era and the market fall in the early 2000s. After that, unemployment got this low in the mid-2000s, right when housing was beginning to heat up which led to the “great” recession.
One factor that differentiates today versus those prior periods, is that GDP is currently running subpar. In the previous periods, business was operating at 80%+ capacity. That is not the case today. Economists think there is slack in the economy which at least in theory should absorb some of the price bubbles of the past.

ECB Holds Steady
The European Central Bank kept rates steady, but indicated they probably wouldn’t cut interest rates again in this cycle. However, they also indicated they would be patient and would not cut back on their bond purchase program.
SCOREBOARD
Week Ending 6/2/2017
PERFORMANCE
Another week, another advance. The technology heavy Nasdaq composite was up 1.5% and the SP500 increased by about 1% to end the week at all-time highs. International stocks were uup 1.4%.
The payroll numbers this week were so so, but as interest rates continue to fall (see below), and coming off strong earnings reports, stocks continue to be the investment of choice.

Growth stocks have outperformed value stocks by about 11% year to date. The p/e on the S&P 500 Growth index now trades at 20x forward earnings, versus 15.4x on the value index. The ratio of the p/e of growth over value is now at 1.3, the highest level since 2013. Something that reversion to the mean fans might want to keep an eye on.
One cyclical industry that has been hit hard are the offshore oil drillers. Oil dropped by 4.3% on the week, supposedly because the US withdrawal from the Paris climate agreement would increase oil production. The IShares Oil and Equipment ETF (IEZ) is down 22% on the year.
EMPLOYMENT
The unemployment rate dropped to 4.3%, the lowest level in 16 years. Payrolls increased by 138,000, below consensus, and the two previous months payroll increases were revised down. However, the increase should be more than enough to absorb new entries in the work force. Economists estimate it takes about 100,000 more jobs per month to cover the new labor force entries. Initial unemployment claims rose by 13,000 to 248,000. That is the highest level in five weeks but it is still a historically low number.
Interest rates dropped in reaction to the job report. The 10-year treasury note fell to 2.15%, its lowest level since November.
The lower than consensus new hires report knocked down the GDPNow forecast for Q2 growth, falling to 3.4% from 4.0%.
MANUFACTURING ACTIVITY
The Institute for Supply Management reported that its index for manufacturing activity rose to 54.9 in May from 54.8 in April. Anything above 50 is considered expansionary.
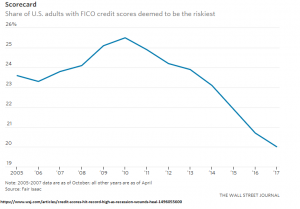
CREDIT PICTURE IMPROVES
The share of Americans with risky credit scores has hit a record low. At the same time, credit scores for consumers overall is at a record high, indicating that consumers are in good shape, are in a stronger position to borrow, and increasing the odds of a positive multiplier effect across the economy.