Week Ending 4/22/2016

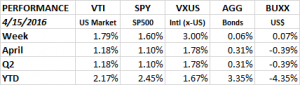
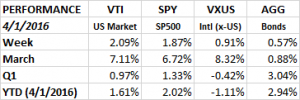
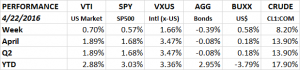
The market was up again as all of the equity indexes moved higher. The US total market ETF (VTI) advanced 0.70%, the SP500 ETF (SPY) was up 0.57% and international x-US ETF (VXUS) was up 1.66%. The bonds (AGG) were down 0.39%, the US dollar (BUXX) increased by 0.58%.

Performance 4 22 2016

At some point there will have to be some kind of pullback in the market. As we have written about for weeks now, the market has not taken the opportunity to head lower on the many instances it had the chance. Thursday looked like one of those days. The market dropped by about 1/2% and closed near its low. On Friday, the market headed lower out of the gate but managed to rally to close at about break even. There was no follow through and that has been the case since February 11.

The volatility index (VIX) is down to levels we haven’t seen since August of 2015. The VIX will usually move opposite the direction of equity markets. So if the stock market is going down, the VIX will be going up. We wrote a few weeks ago that with so many traders betting on spike in volatility, they might end up on the wrong side of the trade, and that is what happened. But as the VIX pushes lower and lower it is indicating that the traders are just too comfortable and they are ignoring short term risk. The equity market will respond and go lower and the VIX will go higher. It does not have to be a dramatic move lower, but some kind of market pullback would make sense. On the other hand, you can make the argument that I am not the only person thinking that so maybe the market will continue to move higher uninterrupted.

Earnings were disappointing for the big tech companies. Weaker than expected earnings from GOOG, MSFT, AAPL, NFLX and INTC pushed those companies lower. Also, high quality, low volatility type companies (like KO, VZ and utilities) under performed.

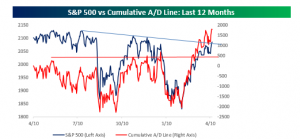
On the plus side, market breadth, which is a measure of advancing and declining stocks, has been moving higher. Often a divergence between market prices and market breadth will foretell a change in market direction, but the fact that they are both moving up together is a positive sign.
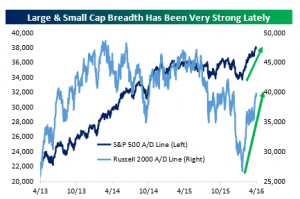
Breadth(bespokeinvest.com)

Long dated bonds in the US fell and that led to losses for the aggregate bond index. As interest rates go up, bond prices go down. The move higher in rates might be a result of investors anticipating higher growth and/or inflation.

MARKET REVIEW/OUTLOOK

We did our quarterly Market Review/Outlook for BlueKey last week. It is about a 30-minute presentation. Please check it out and contact us with any questions.

ECONOMY

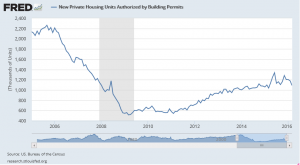
Housing reports were weak. Housing starts declined by 8.8% and building permits were down 7.7% compared to the previous month. The building permit number is now less than the previous low set in September. Part of the problem is that builders are focused only on high end homes whereas the demand appears to be at the lower price points.

Building permits

The Conference Board’s Leading Economic Index increased by 0.2%. This was the first increase in four months. Year over year it was up 2.2%, suggesting slow but steady growth.

The Philly Fed General Business Activity Index fell 14 points to -1.6. This reversed the gain from last month and put the index back in contraction territory.

It was another banner week for initial jobless claims. The number fell to 247k. This is the lowest level since November of 1973.  The job market continues to be strong and is near full employment levels.

OIL

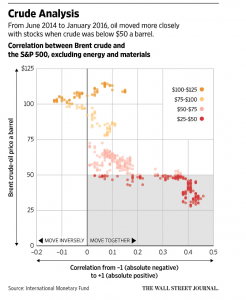
When the price of oil has been less than $50 per barrel, there has been a high correlation between its price and the stock market. This becomes even stronger between $25 and $40. When oil started to fall south of $50 it really began to threaten debt markets, led to big pullbacks in capital spending and job cuts, which led to the equity markets falling with the price of oil. The markets worried about spillover effects. As the price approaches $50 the correlation should begin to go back to normal.

Crude Analysis- Whats the Magic Number for the Oil Price WSJ April 20 2016

EARNINGS

Earnings have not been that bad. To date, 26% of SP500 companies have reported. 76% have beaten earnings estimates and 55% have beaten sales estimates.

SUMMARY

Short-term momentum continues to be a powerful force moving the market higher. Interest rates turned higher and that will have to be watched. Economic statistics continue to be mixed, but that has been the case for a long time now, we are in a flat to very slow growth economy, but the job market is strong.

Week Ending 4/15/2016

The market bounced off its lows from last week and the overall US market (VTI) moved ahead by 1.79%, the SP500 (SPY) +1.60% and overseas x-US (VXUS) +3.00%. The bond index and was roughly flat at +0.06%.

performance 4 15 2016

The equity markets continue showing strong resilience. The market has closed at or near the low at least 8 times since February 11th but there has not been any follow through. The SPY is now close to testing and possibly breaking through the downtrend line set from the highs last May.

SPY WEEKLY CHART 4 13 2016

A good internal signal is that the cumulative advance/decline line is showing even more strength than the market.

Cumulative AD Liine 4 17 2016 Bespoke Report

OIL

The market might be tested on Monday. Over the weekend OPEC held a meeting to decide on a production freeze but they could not reach an agreement. Remember on February 11 it was talk of a possible production freeze that set the low for oil which helped sparked the market rally.

CHINA

The market was helped by news from China. Q1 GDP came in at +6.7%. Recent PMI numbers have also shown a positive pattern. The general feeling is that the economic storm in China has settled down at least for now.

US ECONOMY

It was a mixed week for US economic data. Retail sales fell 0.3%, industrial production fell 0.6% and the NFIP small business optimism report declined. Most of the retail sales weakness was due to autos. X-autos retail sales were up 0.2%. On the plus side, we got another very strong initial unemployment claims report, new claims totaled 253,000. This is the lowest level since 1973. Another positive was the Philly Fed report which increased for the third straight month. This has been the largest three month increase since October of 2009.

SUMMARY

The market continues to show strength, but has risen almost 14% since February 11, it is overdue for a pullback. Economic reports continue mixed, growth remains slow to flat.


Week Ending 4/8/2016

The market showed some possible signs of cracking this week. The US averages were down a little more than 1%, international markets were down only 0.18% and the bond index managed a 0.33% gain. What was most disconcerting was the performance on Friday, the market was up almost 1% but gave most of it back and ended up only 0.27%. That came after a brutal Thursday when the market fell 1.2%. Nevertheless, the market still has held support at $203.90 on the SPY.

While the market is up on a daily basis, the trend is still down on a weekly and monthly basis. Oil rose 8% to $39.72 per barrel. Analysts are starting to suggest that we have seen the low in oil.

performance 4 8 2016

FED

The Fed released the minutes from their meeting on March 16th. The minutes highlighted weakness in the global economy. The Fed will be taking a more passive approach towards raising interest rates. We are probably looking at one, maybe two increases for the year. It is possible that we don’t even see a single increase if the global economy remains shaky and overseas rates hover around the zero area.

EARNINGS

Earnings season starts Monday. Earnings are expected to decline for the fourth straight quarter. Energy earnings are expected to be negative. However, the earnings problem is bigger than just energy, take energy out and analysts still expect a drop of 4.2%. AAPL earnings should be down 19% year over year. 94 SP500 have issued negative guidance. For all of 2016, analysts are looking for an increase of 2.1% as the negative impact of falling oil prices and the rising US dollar begin to fade away. While analysts have been clearly negative on this past quarter, over the last four weeks they have actually raised earnings estimates for 443 companies in the SP1500 and lowered the forecast for 495.  That is a much more balanced tradeoff between plus and minus revisions than we saw earlier in the year.

ECONOMIC REPORTS

Initial claims for unemployment insurance fell to 267,000 last week, down 9,000. The new global PMI reports came out and the number increased to 50.5 in March. The previous report in February was more negative and suggested a higher probability of a global (not US) recession. This report shows that the new orders component of the report rose to 51.2, a positive number that might indicate the global economy is on a slow mend. On the negative side, employment and exports were down. 70% of the countries reporting are in expansion territory, the highest number so far this year. There will need to be more follow through in future months to see if the recovery can sustain itself.

VENEZUELA / ARGENTINA

Problems continue in Venezuela. Fridays are now a holiday in Venezuela through May in an effort to cut energy production. Credit default swaps indicate a 72% chance of default in the next year and almost 100% over the next five years. On the other hand, Argentina which has started to implement a more free market economy is going to the market with $12b in sovereign debt in the near term.

SUMMARY

The market has been overdue for a pullback. It looks like we are getting close. If the SPY cannot hold support at $203.90 we will probably get the pullback. A small pullback at this time would be natural and would set the stage for the next leg up. A bigger pullback combined with weakening economic data could reignite recession fears.

Weekly/Monthly/Quarterly Recap

Weekly/Monthly/Quarterly Recap

The week ended on a high note as the market continued to resist the chance to turn negative. The SP500 (SPY) opened down on Friday 0.57% but then went straight up for the rest of the day closing up 0.69% on the day and at the high for the year at 206.92. For the week, all the broad ETFs were up, the overall US market (VTI), +2.09%, the SP500 (SPY), +1.87%, international x-US (VXUS), +0.91% and the aggregate bond index (AGG), +0.57% (all of our calculations include dividends).

March ended on Thursday and what a month it was. The market put the finishing touches on a monumental comeback as the US market climbed 7.11%, the SP500 was up 6.72%, international x-US +8.32% and the bonds were up 0.88%.

If you were an investor that only looked at your quarterly statement, you would find that the US markets had a moderate increase as the overall US market was up 0.97% and the SP500 was up 1.33% for the three-month period. International markets (x-US) dropped 0.42%. You probably would assume it was a calm, steady, increase. You would be wrong! The market took investors on a wild ride but ended up in about the same place as where it started. It was almost straight down and then straight up. The market got off to its worst start ever for the first two weeks of the year. From December 31 through the closing low on February 11, the SPY was down 10.31% and had hit a 22-month low. From that point it rallied 12.97% through the quarter ending close on Thursday, overall up 1.33% for the quarter.

The quick summary for the quarter was that the market fell on fears of a possible US recession but then as economic reports began to make clear that the threat of a near-term recession was minimal the stage was set for the recovery rally.

Fixed income outpaced equities. The AGG advanced each month and combined for a 3.03% gain for the quarter. Treasury bonds were up 8.15%. US fixed income is being helped by more quantitative easing in Europe and by negative interest rates in Japan which have pushed overseas rates lower increasing demand for US treasuries.

Gold was the top performing asset class, up 16.5% for the quarter. Commodities turned positive this quarter, up 3.78%. Emerging markets were up 2.73%. The dollar was down by 4.15%.

PERFORMANCE CHART 4 1 2016

MANUFACTURING

The Institute of Supply Management (ISM) showed an increase in manufacturing activity for March. This was the first increase in six months. The index came in a 51.8, up from 49.5 in February. A number above 50 indicates growth. Since declining to slow manufacturing activity earlier in the year led to the fears of a recession, a higher number is a big positive.

PAYROLL

Nonfarm payroll in March increased by 215,000 jobs. For the quarter, the average gain was 209,000. That was up by 19,000 jobs compared to the average during the first three months of 2015. Year over year average hourly earnings were up 2.3%. The unemployment rate ticked up to 5.0% from 4.9%, as more people entered the labor force. Initial claims for unemployment rose to 276,000, the highest number in eight weeks but still a relatively low number.

VOLATILITY

As a follow up to our note last week on the volatility ETFs, we wrote that the huge increase in bets on funds like UVXY and TVIX might signal that the market might not act in a way these traders want. That turned out to be correct as the UVXY fell 22% and TVIX fell 19.6% on the week.