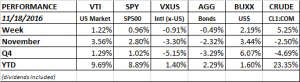
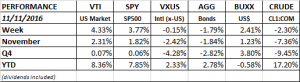
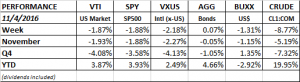
Week Ending 11/25/2016

PERFORMANCE

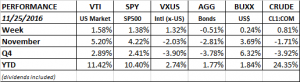
It was a repeat performance for the markets. Stocks up, bonds down, dollar and crude were up. The only difference was that international equities rebounded. The US indexes have advanced for three weeks. The Dow and the SP500 were up every day during the week and both hit record highs. Small stocks as measured by the Russell 2000 are up 15.8% over the last three weeks and have been up 15-days in a row.

performance-11-25-2016

One way to justify the recent run up in equity prices is Trump’s proposed corporate tax cuts. A cut in corporate taxes would go direct to the bottom line. Trump wants to drop rates from 35% to 15%. If the tax rate drops just halfway to 25%, that might raise SP500 earnings by about 10%. According to Factset, the 12-month forward EPS estimate is $131.19. If tax cuts increased earnings by 10%, that would be $144.30 and that would lower the forward 12-month p/e ratio from 16.87 to 15.33.

Based on history, SP500 earnings estimates going out one year are usually too high and will come down as we move forward. But even with that, a tax cut makes the p/e ratio much more reasonable.

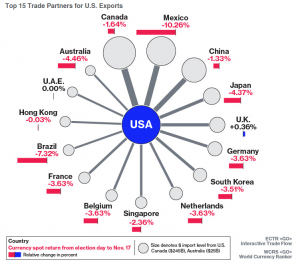
One factor working against the SP500 is the rise of the dollar. The USD is up over 6% this quarter, that makes exports more expensive by cutting into sales, and it also reduces foreign earnings that are translated back into dollars. As illustrated in the graph below, as the dollar rises, the impact on SP500 earnings is negative.

sp500-earnings-v-usd

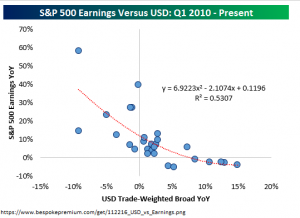
A rising dollar and a sinking Chinese yuan could spell trouble at some point. But the market has been ignoring that for now. And of course, the big wildcard remains what happens with trade. So far, Trump has been moderate when talking trade.

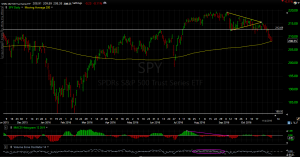
The market has strong momentum now but optimism is extremely high. That is often a contrary indicator.

ECONOMY

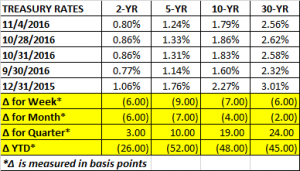
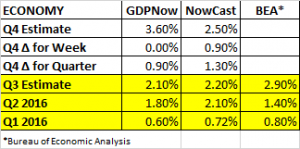
The Atlanta Fed’s GDPNow model is forecasting growth of 3.6% for Q4. That is unchanged from last week. The durable manufacturing report was positive but that was offset by a decline in the forecast for Q4 residential investment. The NY Fed’s estimate for Q4 growth is 2.5%.

gdp-estimates-11-25-2016

SHARES BUYBACK

Goldman Sachs analysts are projecting that SP500 companies will buy back $780 billion in stock next year. The 30% increase over this year would be a result of cash coming back into the US via Trump’s repatriation plan. Trump plans to lower the tax to encourage companies to bring back cash now parked overseas.

Week Ending 11/18/2016

PERFORMANCE

The market picked up where it left off last week. Stocks advanced, bonds declined. Investors continue to concentrate on the positives and are laying off the negatives of what we know about Trump. Animal spirits are in the air. It has been value over growth, US centric over international and small over large. The financials and industrials have been the hot sectors. The surge in the dollar, up 3.44% for the month and now at its highest level since 2003, helps the smaller and more US focused companies. Sectors with a negative correlation to the yield curve like utilities, consumer staples and real estate are down.

performance-11-18-2016

Bonds have taken a big hit due to the surge in interest rates. It has been the worst two-week stretch for the global fixed income market in 25 years. The 5 and 10-year notes are up by about 50 basis points this month. Taking a somewhat longer view, we are basically back to where we started the year. In fact, the 30-year is now yielding 3.01%, the same amount as at 12/31/2015. According to The Bespoke Report, the current decline in the US Aggregate Bond Index is the 7th worst since 1989. Of the nine other declines that make up the top 10, the aggregate posted a positive return over the next 12-months every single time with returns ranging from 4.22% to 13.32%. However, all those data points occurred during the 35-year bond bull market. That bull market might be over at this point.

treasury-rates-11-18-2016

The rise in the dollar does have a darker side. Imports become cheaper, exports more expensive. That would hurt SP500 type companies that have a greater international focus, thereby explaining its recent underperformance. Trade flow, a focus for Trump, would now become even move uneven, ironically, because of the Trump rally. The chart below shows the change in currencies versus the dollar.

top-15-trade-partners-for-us-exports

A higher dollar will also impact some emerging market economies that have debt primarily denominated in USD. The higher dollar makes it more expensive to repay that debt.

ECONOMICS

Inflation reports this week (PPI and CPI) came in at consensus or slightly weaker. So at least for this week, there weren’t any surprises to explain the surge in interest rates. Housing starts were strong, up 25.5%. Retail sales also were strong, up 4.3% year over year. Incredibly, jobless claims fell to 235k, the lowest level since 1973. It is hard to imagine that this number continues to be so low, but thankfully it has.

The Atlanta Fed’s GDPNow estimate for Q4 growth jumped by 1/2% to 3.6% for Q4 due to the positive residential construction report. The NY Fed’s Nowcast estimates Q4 growth at 2.4%, that is up 0.8% from the prior week. Retail sales along with housing starts helped improve the number. If these numbers hold the economy would see improved growth over each quarter this year.

gdp-estimates-11-18-2016

Week Ending 11/11/2016

PERFORMANCE

performance-11-11-2016

It was a historic week as Trump pulled the upset. The overall US market was up 4.33% on the week, international markets were down slightly and bonds fell. The US dollar rallied.

The market was up on Tuesday in expectation of a Clinton victory. But around 9:00 p.m. when it started becoming obvious that Trump would likely win, the market went into a tailspin and fell about 5%. It hit its low at midnight, rallied back a little, and a good victory speech by Trump got the market moving north again. The market ended up slightly higher on the day and rallied to close the week.

on-second-thought

The market rallied by concentrating on the positive impact of some of his proposals such as lower taxes, less regulation an infrastructure spending. For now, the market is ignoring the negative impact of his tough talk on trade and protectionism. They are hoping he modifies or backs off on that.

Bonds fell on the expectation that Trump will bring higher inflation and higher interest rates. Higher inflation and higher interest rates were probably on the way anyway, but the election might have accelerated the process. The interest rate on the 10-year note jumped by 36 basis points.

treasury-rates-11-11-2016


Initial Thoughts on Election

INITIAL THOUGHTS

US voters stunned the world handing a huge victory to Donald Trump. SP futures fell 5.2% overnight but are now down only 1.6% (as of 7:40am). What happens from here will be a function of if Trump follows through on some of his worst rhetoric. Or, if he moderates some of his positions, hopefully with the benefit of smart advisors.

A big part of Trump’s message is to increase economic growth. The biggest danger is setting off a trade war. A President does have some unilateral power on trade. In addition, a big increase in uncertainty would not be good for the economy. Combined, this could send the economy in the wrong direction.

Trump does have some good ideas such as decreased regulation, corporate tax reform, bringing overseas earnings back to the US, better energy policy, etc.

His victory speech was a good start to heal the country and to start moving forward. For now, we give him the benefit of the doubt.

Week Ending 11/4/2016

PERFORMANCE

US equity markets continued to fall as Trump rallied in the polls. A Clinton victory was priced into the market but Trump is now threatening. Markets view a Trump victory as a major threat to the status quo. There are a lot of questions on what would ultimately happen with trade, taxes and other policies. Clinton is the known quantity and that is what investors like.

The market has fallen for nine days in row, the first such stretch since December of 1980. However, the drop has been relatively contained. The fall is just 3.1%. The SP500 is now 4.8% off its August 15 high. By contrast, in 1980, the nine-day losing streak dropped that market 9.4%. If the market drops on Monday, that would be 10 in a row, that last happened in 1975. The all-time losing streak is 12, dating back to 1966.

performance-11-4-2016

Fivethirtyeight.com has the chances of a Clinton win at 65%. Should Trump pull the upset, the conventional wisdom is a market sell-off in the 5-10% range. Investors and most economists are frightened by a potential trade war.  But conventional market wisdom is often wrong and sentiment is negative going into the election.  A Democratic sweep for the House and the Senate, would also probably lead to a sell off. A Clinton victory with the Republicans holding the House and the Senate, or at least the House, seems to be what the market wants and that could set up a relief rally. Another scenario that would be negative would be no clear winner emerging Tuesday night.

We have written about the poor technical condition of the market the last few weeks. The market did break a support level this past week and is now resting on its 200-day average. If it can’t hold there, the next line in the sand is the 203 and then the 198 area. The FBI announced on Sunday that they won’t seek charges against Clinton after reviewing the newly discovered emails, that will likely rally the market.

spy-11-4-2016

Treasury rates fell across the curve. The dollar declined and crude was off by almost 9%.

treasury-rates-11-4-2016

EARNINGS

Earnings have been solid so far this quarter. According to Factset, 71% of SP500 companies have reported earnings above their mean estimate. The blended earnings growth rate for the index is +2.7%, likely marking the end of the five-quarter losing streak.

FED RATE HIKE

The employment reports continue to point toward a December rate hike. Assuming that there is not a big negative reaction to the election, December will likely be the first rate increase in one year. Non-farm payroll employment increased by 161k, and prior months were revised upwards by 44k. The six-month annualized increase in private-sector average hourly earnings came in at 3.1%, showing that wage pressures are building and the Fed will exceed its 2% inflation target. The unemployment rate fell to 4.9%, although that was helped by a decline in the workforce.

GDP

The Atlanta Fed’s GDP Model GDPNow put in their final Q3 estimate at 2.1% growth. The model opened up their Q4 estimate at 2.7% and it was then raised to 3.1% to close the week. Higher forecasts for consumer spending, equipment investing and exports helped raise the estimate. The NY Fed’s Nowcast currently forecasts Q4 growth at 1.6%.

gdp-estimates-11-4-2016

GLOBAL ECONOMY

The October PMI reports show that the economic outlook around the world is improving. Many countries are making new highs and growth trends appear to be broadening. The US was up 1.9 points to 53.4. The Eurozone increase by 0.9 points to 53.5.

october-pmi

VLMAP

Here is an argument on why equity returns will be low over the next few years. Value Line, an equity research firm that covers 1,700 stocks, publishes the median estimate of appreciation over the next three to five years. This is called the Value Line Median Appreciation Potential (VLMAP). It currently stands at 40% which represents an 8.8% annualized return. That number sounds pretty good. But historical research has shown that the VLMAP number tends to be on the optimistic side. The 40% expected appreciation potential is in the lowest decile of readings dating back to the 1960s. In contrast, the expected appreciation was 185% in March of 2009, that turned out to be a good signal to go long. But is the system foolproof? Of course, the answer is no. The readings were also at 40% four years, since then, the market returned 6.4% annualized. As with other valuation models, the level of interest rates is a huge factor that can and has altered historical tendencies.

THE CUBS INDICATOR

And finally, if you are looking for a reason to go long, here is an indicator that comes along every 100 years or so. The last time the Cubs won the World Series prior to this year, in 1908, the DJIA rallied 8% in the following month!