Week Ending 8/25/2017

MARKET PERFORMANCE

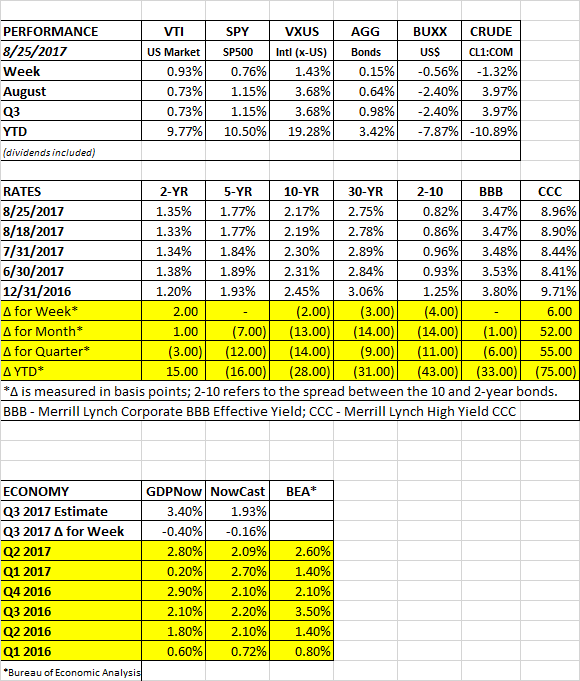
The market rallied on Tuesday on renewed optimism that tax reform would pass, but stalled later in the week as Trump threatened to shut down the government (see below). The S&P was up 0.72% for the week. International equities were up 1.43% and bonds increased by 0.15%. While treasury yields are generally down about 7 to 14 basis points this month, the yield on CCC bonds (high yield) are up by 52 basis points month to date, a possible warning sign.

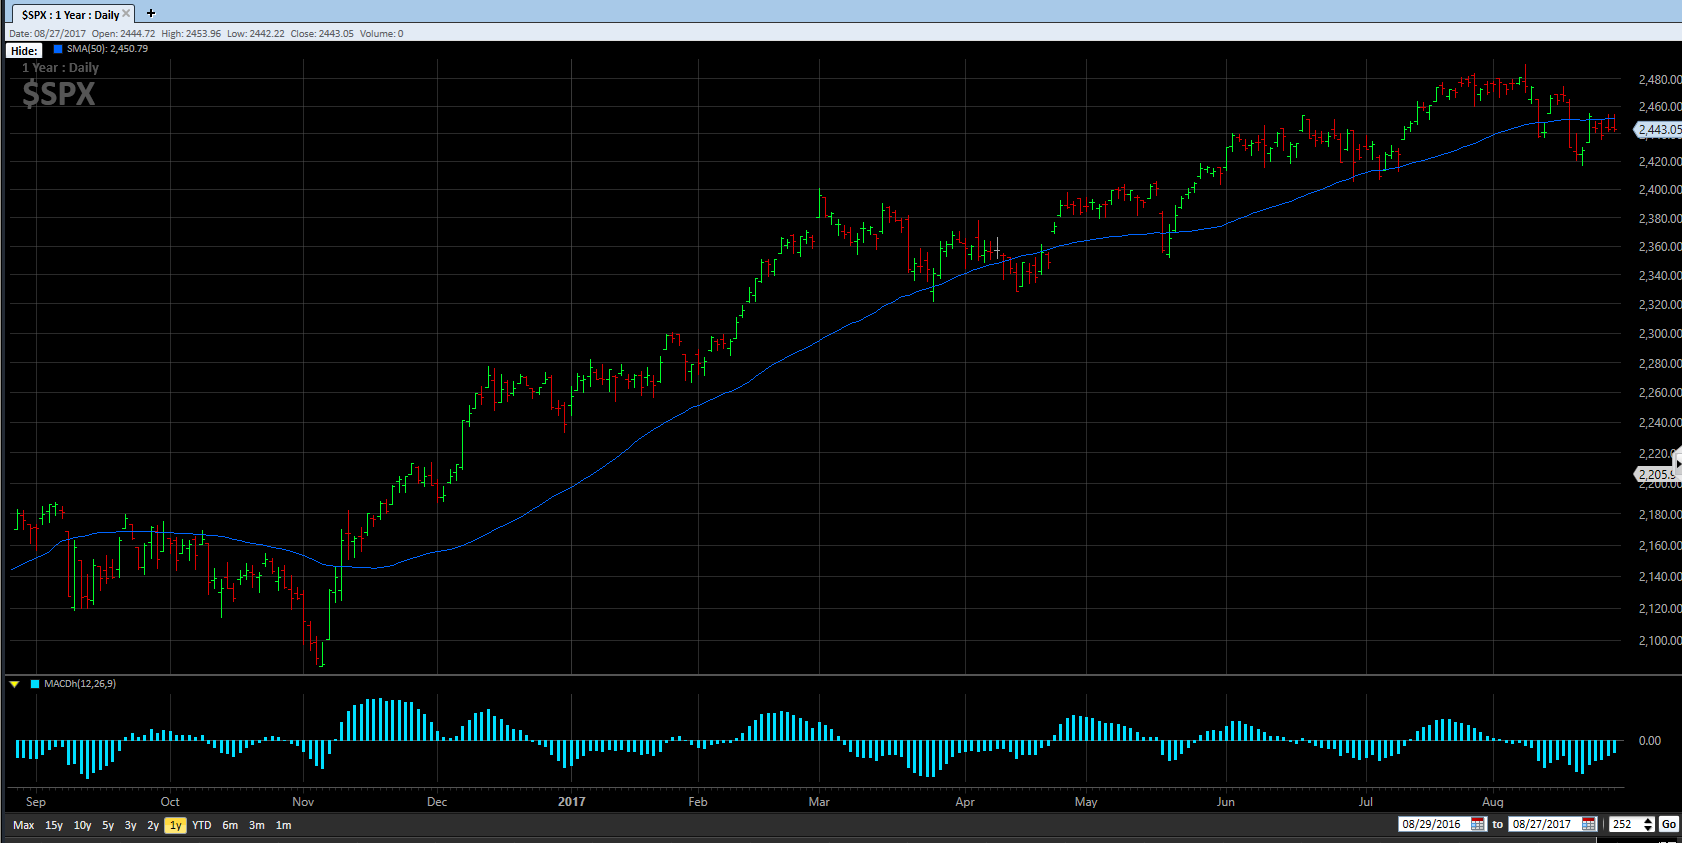
Traders are worried about technical signals indicating a weakening market. The S&P 500 remains below its 50-day moving average. Only 45% of S&P 500 stocks are now trading above their 50-day moving average, a decline of 30 points from one month ago, according to Bespoke Investment Group. The number of stocks making new 52-week lows is on the rise. And the beginning of a trend of lower highs and lower lows continues.

HURRICANE HARVEY

A major hurricane hit Texas over the weekend. It is too early to know the economic impact but it will be significant, at least on a regional level. There will also be an impact on energy prices. The WSJ reports that about 12% of fuel making capacity is currently out of commission. Exxon’s Baytown refinery (560,000 barrels per days) and Royal Dutch Shell’s Deer Park refinery (325,000 barrels per day) are both shut down. In total, about 2,000,000 barrels a day are off-line. Flood claims from the storm will push the $24.6 billion that the National Flood Insurance Program owes the US Treasury much deeper into the red, possibly putting even more pressure on Congress to reform the program. That eventually could later impact real estate prices in coastal properties around the country.

DEBT CEILING

Trump threatened a government shutdown unless Congress funds a wall on the Mexican border. As is often the case, Trump has his priorities backwards. His main emphasis should be on first getting legislation passed to increase the debt ceiling, from there, he should try to work with Congress on legislation that might actually have a chance of being passed. Trump also needs to know that running the USA is different than running his real estate operation. It never bothered him when he didn’t pay his creditors in his past life, but now he represents the full faith and credit of the United States, a higher standard.

BUYBACKS

A report by Societe General on corporate buybacks shows that buybacks declined by $100 billion in the past 12 months versus the prior year. Hopefully, less buybacks and more capital expenditures would enhance long-term growth. Besides, it probably would not make sense for corporations to be buying back their stocks at elevated valuations.

ECONOMY

Home sales were down by 1.3% in July probably due to a lack of inventory.  The smaller inventory has a secondary effect of pushing up home prices. Total housing inventory was down 9% from one year ago. The median home price is up 6.2% year over year. The housing data depressed Q3 growth forecasts, the Atlanta Fed’s GDPNow model fell by 0.4% to 3.4% and the NY Fed’s Nowcast has Q3 growth at 1.93%, down by 0.16%.

Jobless claims came in at 234,000. A historically low number.

Week Ending 8/18/2017

HIGHLIGHTS

  • Market falls on mayhem in Washington.
  • Debt ceiling needs to be increased by October 1.
  • Poor market reaction to positive earnings reports.
  • Growth around the world is solid.
  • North Korea backs down.

MARKET PERFORMANCE

The market could no longer ignore the avalanche of bad political news. After falling 1.4% last week, all seemed like it was back to normal on Monday, Tuesday, and Wednesday as the S&P 500 advanced 1.1%. But the combination of Trump’s Charlottesville’s comments, the possibility of the departure of National Economic Council director Gary Cohn and the general mayhem in the White House led to a sell off on Thursday and Friday. Trump’s business advisory councils disbanded after his ambiguous comments regarding the neo-Nazi’s, the KKK and the white supremacists at Charlottesville. And a viscous terrorist attack in Barcelona did nothing to help.

For the week, the S&P 500 was down 0.65%. US equities have now put in a lower high and lower low. So, we have the makings of what might become a pullback. For now, though, the damage on the large cap indexes has been limited, the S&P is only down 2.23% from its high on August 7 of 2480.91.

DEBT CEILING

Forget healthcare reform, forget tax reform, Congress has a deadline to raise the debt ceiling by October 1 or the country will likely default on its debt sometime in October.

EARNINGS

S&P 500 companies that have beaten analysts’ earnings estimates have declined by 0.3% during the period that started two days before and ended two days after the earnings announcement, per FactSet. That compares to a 1.4% average increase over the prior five years. This probably indicates that investors are more weary of high equity valuations. Although during late July of 2006, the market had a somewhat similar reaction to earnings and then managed to put in another big rally.

GLOBAL/US GROWTH

The global growth story continues, real GDP was up at an annualized pace of 4% in Japan, 2.2% in the euro zone and 4.3% in eastern Europe. In the US, positive economic news increased Q3 GDP growth estimates to 3.80 from 3.50% from the Atlanta Fed’s GDPNow model and the NY Fed’s Nowcast increased to 2.09% from 1.96%.

NORTH KOREA

On Monday, North Korean leader Kim Jong-un said he would watch what “the foolish Yankees” do before taking any action. This is Jong-un’s way of lowering the stand-off. At the same time, South Korean President Moon Jae-in urged the US not to launch an attack without its consent. The defense agreement between the US and South Korea required that they must “consult together” if either country is threatened. Both moves should help alleviate the tension.

SCOREBOARD

Week Ending 8/11/2017

HIGHLIGHTS

  • Equities fall around the world.
  • Consensus shifting to the view that a pullback is on the way.
  • Market falls by more than 1% for the first time in 58 sessions.
  • Coming into a rough time of the year.
  • Madman theory.
  • Lots of positives still in place.

MARKET RECAP – UP OR DOWN?

The long overdue pullback/correction may be on the way. It has now been 410 days since the market fell by at least 5%, the longest such streak since at least 1995. And it seems like the market consensus is shifting to the view that now might be the time for this long overdue pullback. Or then again, maybe it is not.

The S&P 500 slipped 1.4% on the week, which was better than international equities, which dropped 2.1%. The S&P is down only 1.6% from its recent high, but underneath the surface the damage has been greater. On Thursday, the market fell by more than 1% for the first time in 58 sessions. The Russell 2000 which tracks small-cap stocks is down 5.2%. The declining dollar is also a problem. While it bumps up US earnings and that helps the market. An offset is the huge amount of investments held in the US by foreign governments and institutions. A declining dollar, coupled with a possible market pullback, could lead to a lower allocation to US assets which would drop equity prices further.

Another issue is the calendar, August, September and October have sometimes been rough months for the market.  But it is not only the “months” that might give one worry, the Leuthold Group has pointed out that years that end in the number “7”, dating back to 1887, have produced a drop during this time of year. We had the market crash, down 22%, in October of 1987. In 1997, we had the Asian currency crisis and hints of the forthcoming financial crisis started to appear around this time in 2007. Each of the above was set off by a financial or monetary event. Although the Fed is in tightening mode, their extra cautious pace would not indicate a crisis in the near term. However, the Fed does plan to begin unwinding their balance sheet sometime soon, a process that really has never happened before, at least to this extent.  The process will be gradual but it remains to be seen how the market will react when it starts. But maybe the biggest threat to this market might be a geopolitical event like North Korea.

President Trump could not hold back from the continuous prodding by North Korean leader Kim Joung-un and said clearly several times that North Korea better watch its step. The words he used to kick off the verbal storm were that the North Koreans would be “met with fire and fury like the world has never seen.” He told the Koreans to back down on their threats and actions, which of course, they refused to do and responded in like kind. Given that North Korea has threatened the use of nuclear weapons at various points, “fire and fury” might not be the best choice of language. But that seems to be what Trump intended.

Trump might be using a form of what was called in the 1970s the Madman Theory. Basically, the idea is that Trump wants North Korea to think he is crazy enough to engage in an all-out war or even a nuclear war. Of course, the worry for many is that no one really needs any convincing, Trump’s previous actions have already convinced many that he is somewhat unstable. On the assumption that the North Korean leader were to be convinced that indeed Trump is crazy enough to engage in a war, Joung-un would back down. Which North Korea hasn’t done. The Madman Theory only works when you have two rational actors, not two irrational ones.

A complicating factor is China. China holds the most leverage over North Korea, and is the one country that can influence North Korean policy. Now, while at the same time asking for Chinese help, Trump is about to begin investigating China for trade violations. Specifically, intellectual property violations.

There is also the threat of a government shutdown in late September or early October as Congress needs to reauthorize the debt ceiling. Getting Congress to agree on anything has been close to impossible.

Those are all the reasons why the market might fall. On the positive side, the market still has solid momentum, corporate earnings have been strong and the falling dollar adds to that. About 90% of companies have now reported Q2 earnings and earnings are up more than 10% over last year, according to FactSet. There is a chance for corporate tax reform which would give another boost to earnings. Economies around the world are in expansion mode and the US economy continues in its slow and steady growth mode, around 2%. The job market is very strong.  And interest rates are so low they provide an economic justification for higher equity valuations.


Week Ending 8/4/2017

HIGHLIGHTS

  • The Dow Jones Industrial Average sets another record, breaking 22,000.
  • Broader indexes are flat, transports are down.
  • Solid payroll report
  • Late credit card payments increase

PERFORMANCE

The Dow broke through another milestone, cracking the 22,000 barrier and ending the week at 22,092.81, plus 1.20% for the week. However, the broader indexes were closer to flat. The SP500 was up 0.19% and the Nasdaq Composite fell 0.36%. International equities rose by 0.82%.

After peaking on July 14, transport stocks have been down. The IShares Dow Jones Transportation Average Index Fund (IYT) has fallen by 4.78% while the Dow (DIA) has increased by about 1.99% during that time. A divergence between the two signifies a market warning based on the 117-year-old Dow Theory. The Dow Theory states that a rally in an index like the Dow should be confirmed by a rally in the transports (the Rails back in 1900). Times have changed since then and there have been several times in this market rally over the last few years where we did not get this confirmation, but it is worth a mention.

Bonds were up by 0.19% as the treasury yield curve going out from five years fell a few basis points.

ECONOMY

The first look at Q3 growth from the Atlanta Fed’s GDPNow model came in at a strong 4.0%. However, by week end it had dropped to 3.70%. The New York Fed’s Nowcast has Q3 growth at a much milder 1.98%.

SOLID PAYROLL REPORT

Non-farm payrolls increased by 209,000 in July, higher than the consensus estimate of 180,000. It was the 82nd straight month of job creation, the longest such streak ever. As shown in the chart below, this expansion has been noteworthy for a slow but very steady and long pace.

The May and June non-farm payroll numbers were also revised higher. The unemployment rate fell to 4.3% from 4.4%, the lowest number in 16 years. The labor force increased to 62.9%, up 0.1%. Average hourly earnings were up 2.5% year over year. Almost half of the gains were in bars and restaurants, and healthcare.

LATE CREDIT CARD PAYMENTS

Credit-card issuers are starting to have collection problems. The average net-charge off for large US card issuers increased to 3.29%, the highest level in four years. Losses are still low based on historical levels. Around 2014 banks started relaxing underwriting standards, which led to a big increase in credit-card spending. That might have led to the higher charge-offs now.

SCOREBOARD