Week Ending 3/3/2017

TRUMP’S SPEECH

In many ways, this was the speech we have been waiting for. Trump leaned towards the optimistic side, gave a speech without insults and attacks, a speech that tried to bring the country together, instead of apart. Other than his short victory speech at 3 am the night of the election, it was the first time Trump actually acted sounded presidential, and because of that, his message was much more effective.

Trump proposed a $1 trillion infrastructure package, replacing Obamacare, lowering drug costs, lower tax rates and free and fair trade.

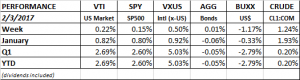
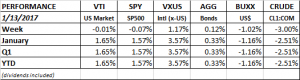
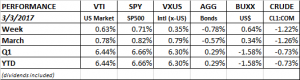
The market liked what it heard and the way it was said, and the Dow jumped 300 points the next day. For the week, US equities were up 0.63%. International stocks advanced 0.35%.

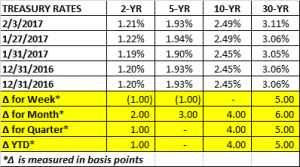
Interest rates, which had been falling recently, turned around and jumped about 20 basis points. That pushed the prices of the bond index down by 0.78%.
Unfortunately, by week’s end Trump was back to his old self. Declaring on Saturday morning, via Twitter, that Obama had tapped his phones, without presenting a shred of evidence. One has to wonder how long the markets can ignore the President’s bizarre behavior

GDP

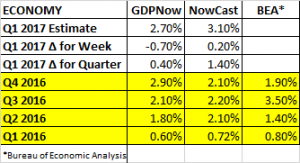
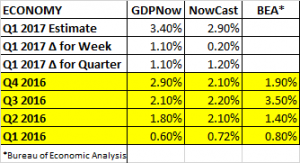
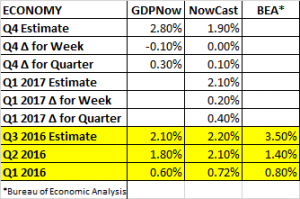
For all the forward-looking optimism on the markets, the story is not so bright in real-time, at least according the the Atlanta Fed’s GDPNow model. Q1 growth fell to 1.8% from 2.40% on a lower forecast for personal consumption expenditures. The estimate from the NY Fed’s Nowcast was not as dreary, remaining steady at 3.10%. Lower than expected inventories for manufacturers and merchant wholesalers offset the negative news on personal consumption expenditures in their model.

But around the globe the economic outlook continues to look brighter. The global manufacturing PMI increase by 0.2 points to 52.9 in February. the index is now up six months in a row, that is the longest winning streak in three years and the index is at its highest level since May of 2011. 86% of individual countries are now in expansion territory.

FED

The Fed has been more aggressive in sending the message that a rate hike will happen sooner, rather than later. A March rate hike is now likely.

JOBLESS CLAIMS

Initial claims for unemployment dropped by 19k to 223k, the lowest amount since March of 1973. The four-week average now stands at 234,250 and that is the lowest number since April of 1973.
Week Ending 2/24/2017

PERFORMANCE

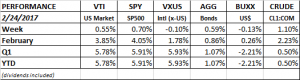
It was another winning week on Wall Street, as US equities rose by about 0.60%. The Dow is now on an 11-session winning streak, that is the longest stretch since January of 1987 when the index put together 12 wins in a row.

The market has had the wind to its back, and either this big run will turn out to have correctly anticipated an improved economy and higher profits in the near future, or, we will continue with more of the same slow to moderate growth path. If the ladder scenario turns out to be correct, then the market has gotten ahead of itself and it will have to likely correct through either time (via a somewhat flat performance) or by price (as in a correction of some type).

There are some positive signs that the economy is accelerating. And if we get positive corporate tax reform, roll back on regulations that do not meet cost/benefit tests, and repatriation, then maybe this run up is justified. However, all of that happening is a big “if”. We will learn more when Trump rolls out his plans and what the response in Congress is. Treasury Secretary Steve Mnuchin is aiming for a tax-reform package to be passed by August. The market will also need a friendly Fed and no negative surprises on the geopolitical front.

FIXED INCOME

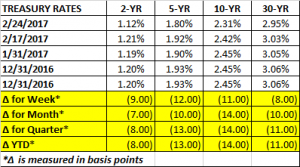
The bond markets are not exactly in sync with equities. Rates were lower across the curve this past week. A much improved economy would likely see higher, not lower, interest rates. The 10-year treasury yield is now at the lowest level since November. The German two-year note now yields -0.95%, close to a record low.  However, unless lower interest rates are foretelling a recession down the line, they do help provide support for higher equity values.

EARNINGS

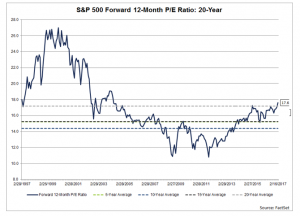
According to FactSet, 92% of SP500 companies have now reported. 66% beat the mean earnings estimate and 52% have beaten the mean sales estimate. The blended earnings growth rate is up by 4.90%. For Q1, 67 companies have issued negative guidance and 31 have issued positive guidance. The forward p/e now stands at 17.7.

WARNING LIGHT

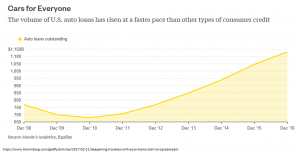
The US auto loan market has risen at a faster rate in recent years than most other types of consumer credit and now those loans are showing signs of stress. Delinquencies are up to the highest level since 2009 and are expected to get worse. Auto loans outstanding total about $1.1 trillion, significantly less than the $8.9 trillion US mortgage market. About 1/4 of auto loans are considered subprime. Most of the pain will be felt by smaller tier lenders, but companies like Capital One and Ally have exposure.

HOME SALES

Existing home sales rose to the highest level since February of 2007 in January. Sales were up in three of four regions across the US. Sales only fell in the midwest. Inventories hit an all time low, at 3.6 months, indicating a tight market.

JOBS

Jobless claims rose by 6k to 244k, but that is still a very low number and shows that the labor market is close to full employment.

DEBT CEILING

The debt ceiling comes up for renewal in March. No one is talking about it but this is a complication that the Trump will have to get through.

Week Ending 2/17/2017

PERFORMANCE

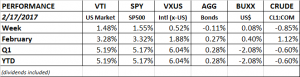
US equity markets continued their advance, adding about 1.5% for the week. The markets are up almost 5% year to date and up about 10% since the election. International markets were up about 0.5% on the week, bonds were down slightly, the USD was flat and crude was down.

The VIX (the volatility index) is at multi-decade lows. The SP500 has now gone 89 days without dropping more than 1%.

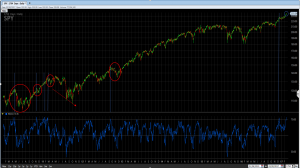
From a technical standpoint, the market is overbought. There all kinds of indicators out there detailing that, but one that we follow is called Wilder’s RSI. This metric is an oscillator that looks at recent price action and turns that data into a number from 0 to 100. The number 70 is often used to indicate an overbought condition. We use a 21-day RSI and it cracked the 70 level this week. Getting north of 70 has been a rare occurrence this decade, and it has sometimes led to a selloff in the market (see the blue vertical lines below).

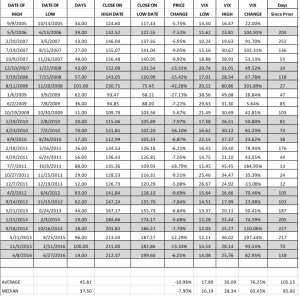
We are also overdue for some kind of sell off. By our count, it has now been 235 days since the end of the last sell off of greater than 5%. That is the second longest streak since 2005. The longest was 252 days in 2007.

VALUATION

The forward P/E ratio now stands at 17.6. That is the highest level since June of 2004.

ECONOMY/GDP

The Atlanta Fed’s GDPNow model forecasts 2.40% for Q1. That is down 0.30% from last week. The NY Fed’s Nowcast model remained steady at 3.10%. Negative news from industrial production and capacity utilization was offset by positive news from surveys and housing and construction data.

The Conference Board’s Leading Economic Index increased by the most in two years, up 0.6% for January. The six-month rate of change in the LEI was up 1.6%, the most since July of 2015. This indicates a strengthening economy later this year.

Greek Debt Crisis

The next chapter of the Greek debt crisis is on the way. Another bailout program is needed and some European governments are hesitant to give more money to Greece without IMF support. But the IMF won’t help unless Greece commits to a budget to its liking. Something Greece is not inclined to do at this time. If the IMF does not participate, that is considered a signal that the Greek budget doesn’t add up. And that could mean trouble for the Euro.

Week Ending 2/10/2017

PERFORMANCE

The market continued its relentless pursuit higher, making it 84 trading days without a decline of 1% or more. This despite all the craziness in Washington and around the world. Favorable earnings news, improving global economic data and the hint that a “phenomenal” tax plan is a couple of weeks away are what the market is concentrating on.

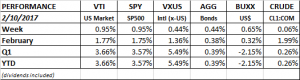
US equity markets were up about 1% and international equities less than 1/2 of that. The dollar was up 0.65% and crude was flat.

TAX PLAN

We do not know the details of Trump’s corporate tax plan, but some form of a border tax is a possibility. A border tax would likely negatively impact SP500 earnings, since many of those companies rely on imports. The flip side is that the corporate tax cuts would probably offset the lost income from the border tax. However, the law of unintended consequences could come into play as US companies have built up intricate supply networks that count on the free flows of good into this country without a tax or tariff.

There is also talk of eliminating interest deductibility which would hit earnings.

We do need corporate tax reform but as they say, the devil is in the details.

FOREIGN INVESTORS BACKING AWAY FROM TREASURIES

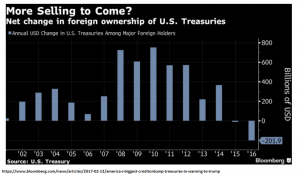
Foreign investors have been reducing their exposure to US treasuries due to a combination of higher US deficits, more inflation, higher interest rates down the road and the Trump effect. For the United States, less foreign ownership of treasuries, in and of itself, will push interest rates higher.

CHINA

China’s foreign currency reserves have dropped to just under $3 trillion from $4 trillion in 2014. China has been using their reserves to try to keep the value of yuan from falling even faster than it has. Worried about more depreciation, Chinese citizens have been trying to move currency overseas, which of course leads to even further depreciation. There is always the possibility that at some point the Chinese government will halt their efforts to prop up the yuan and let it find its natural level. A big drop in the yuan could lead to a market selloff as it did at the beginning of 2016.

One positive note in relation to China is that Trump has backed off on some of his saber-rattling in the last week and even wrote a letter to the Chinese leader promising a “constructive relationship.”

GDP

The Atlanta Fed’s GDPNow Q1 estimate fell by 0.70% to 2.70%, but the NY Fed’s Nowcast increased their Q1 estimate to 3.10% on positive news on imports and exports.


Jobless Claims

Initial claims for unemployment continue to fall hitting the lowest level since November of 1973 at 234k.

Week Ending 2/7/2016

PERFORMANCE

The market made a u-turn mid-week, falling by slightly on Monday and Tuesday and then finishing in rally mode. Overall, US equities were up slightly, +0.22%. Trump’s announcement on Friday that he wanted to cut financial regulations helped the big banks surge in price, and that got equities into the black for the week.

International equities continued to outperform, +0.50%. The US dollar was down and crude was up.

EARNINGS ESTIMATES

Earnings estimates for Q1 dropped by 1.5% during January, from $30.57 to $30.10. That compares to an average decline of 2.3% over the last five years for the first month of a quarter.

GDP

The GDPNow came out with their first estimate for Q1 growth at 2.3% on January 30th, and it was quickly bumped up to 3.4% on February 1 after positive reports from the Institute for Supply Management (ISM) and the construction spending report from the U.S. Census Bureau. The NowCast forecasts Q1 growth at 2.90%. For Q4, the final GDPNow forecast was for 2.9% growth and the Nowcast  was 2.10%.

INTEREST RATES

Midweek, the Fed announced in would not raise interest rates at this time. Rates were flat for the week.

JOBS/INFLATION

Nonfarm payroll employment increased by 227k. Private payroll was up 237k and government payroll declined by 10k. It was the biggest gain in six months. But the two previous months were revised down by 39k. The unemployment rate increased by 0.1% to 4.8%, but that was due to an increase in the labor force participation rate, which bumped up to 62.9% from 62.7%.  And year over year increase in hourly earnings advanced by 2.5%, down from 2.8% in the prior report.

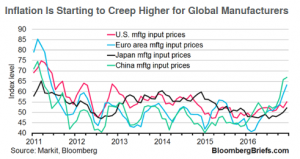
The slight uptick in the unemployment rate and the subdued increase in hourly earnings gives the Fed some more breathing room on increasing rates, for now. But as the chart below shows, manufacturing input prices are rising around the world and that is likely to show up in prices down the road.

Initial claims for unemployment declined by 14k to 246k.

GLOBAL ECONOMY CONTINUES TO IMPROVE

The latest PMI data shows that the global economy continues to improve. The Global PMI reading stands at 52.7, the highest level since February 2014. 85% of individual countries have scores above 50, indicating expansion, the highest level since March of 2014. New orders are increasing, indicating the chance for more growth ahead.

RETAIL

Retailers and those that sell through retailers are a weak spot that might start rippling through the economy. This past week, Under Armour shares dropped 29% on slower sales growth, Ralph Lauren fell 13% and Deckers Outdoor plunged 21% on an earnings miss.


Week Ending 1/27/2017

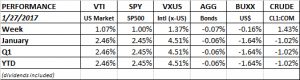
It was a week for the record books as the Dow shot through the 20,000 barrier on Wednesday and closed at 20,094. Boeing jumped by 5.1% on strong earnings and that was enough to push the Dow through.

Overall, US equity markets were up about 1%, international +1.37%, bonds and the dollar were roughly flat and crude advanced by 1.43%

Surprisingly, the market has ignored what would seem like negative news. In the just the first week of the Trump presidency, he has gotten into a war of words with Mexico that might turn into a trade battle/war, there is talk of a 20% border tax/tariff, barred citizens from certain Muslim-majority countries from entering the country and dropped out of the Trans-Pacific Partnership, and those are just the headlines. But the market is staying focused on anticipated stronger growth ahead.

GDP

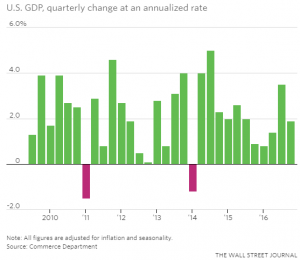
The first estimate from the Commerce Department on real GDP was +1.9% in Q4. Trump is looking to double the 1.9% rate. The 1.9% estimate is much lower than the GDPNow forecast of 2.90% but in line with the NY Fed’s Nowcast estimate of 2.10%.

For all of 2016, GDP was up 1.6%, that is the lowest number since 2011 and down from 2.6% in 2015. Q4 was highlighted by strong consumer spending, an increase in business investment, home construction and government spending. Net exports subtracted 1.7% from the growth rate.

The labor market remains tight. Jobless claims came in at 259k. The four-week average was $245.5k, the lowest number since November of 1973.

Week Ending 1/13/2017

PERFORMANCE

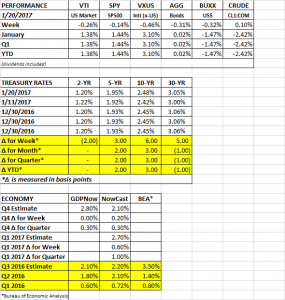
US markets were pretty much flat for the week. The more Trump speaks, the more his post-election market friendly messages get muddled, slowing market momentum. International markets outperformed the US for second straight week. Interest rates were down just slightly, helping bonds rise. The USD fell by 1.02% and oil dropped by 3%.

GDP

The Atlanta Fed’s GDPNow model estimate for Q4 growth dropped by 0.1% to 2.8%. The forecast for Q4 personal consumptions expenditures fell from 2.6% to 2.5%. The NY Fed’s NowCast forecast stayed the same for Q4, at 1.9%. But the 2017 Q1 forecast rose by 20 basis points to 2.1% on a good retail sales report.

EARNINGS

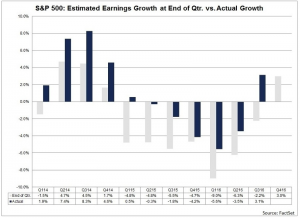
Q4 earnings should be up year over year. At the end of the year, Q4 earnings were projected to increase by 3.0%. But normally, actual earnings come in higher than the quarter end projection. That would make it two straight quarters of improving earnings.

Week Ending 1/6/2017

PERFORMANCE

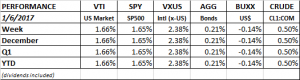
The US equity markets rallied about 1.65%. International markets fared better, +2.38%. Bonds rallied by 0.21% as the yield curve moved slightly flatter. The dollar fell by 0.14% and oil was up by 0.50%.

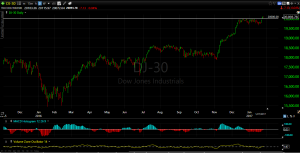
The main focus was on the Dow as it made another push to break through 20,000. Of course, 20,000 is just a number and has no real economic meaning, but it serves as a milestone that makes news. And to traders, the number must have significance because they have been selling every time the Dow gets close. The Dow came within 0.37 of the mark on Friday, about as close as you can get without breaking through.

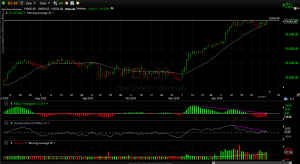
There is, however, a negative divergence between the technical indicators (see the pink declining trend lines towards the bottom of the chart below) and the higher prices of the Dow. This indicates a slowing of momentum and sometimes leads to a pullback.

EMPLOYMENT/PAYROLL

December payrolls increased by 156k. The unemployment rate increased by a tenth to 4.7% mainly due to an increase in labor force participation. Average hourly earnings reached a new cyclical high. Fed committee members will consider this as confirmation that the economy has reached full employment and that the Fed is on track for more interest rate increases.  Expect further earnings increases due to the combination of a tight labor market and minimum wage increases in 20 states beginning in January.

TRADE WAR

We consider a trade war the greatest economic threat to this bull market. When Trump was first elected, the conventional wisdom was that he would concentrate on pro-growth policies like rolling back overbearing regulations, repatriation and corporate tax reform. It was also thought he would soft-pedal on trade, and avoid a dangerous trade war. That is what set off this market rally. But the closer we get to inauguration, the more Trump tweets, and the more he makes executive appointments, the greater the threat of a real trade war. Hopefully most of this is just posture for negotiation. And Trump has plenty of smart advisers that do understand the trade war threat, but this is something to watch closely.

G-20 Growth Forecast

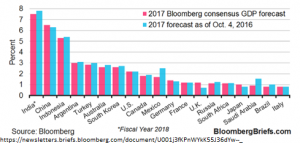
India is expected to lead the G20 with a forecast of 7.5% growth for 2017. China is estimated at 6.5%. Brazil and Italy make up the bottom slots at 0.80%.

Two Week Period Ending 12/30/2016

PERFORMANCE

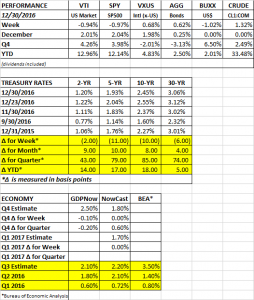
US equity markets fell by about 1%, but international markets rallied by .68% and bonds were up .62% as interest rates dropped across the curve.

GDP REVISED UP

Q3 GDP was revised up to 3.5% from 3.2%. Growth has now averaged 1.9% this year.

CONFIDENCE

More indications that confidence is up. The Conference Board’s Consumer Confidence Index hit is highest peak since July of 2007. What was interesting is that confidence was up significantly for those 55 and over but down even more for those under the age of 35. 44.7% expect stock prices to increase, the most since January of 2004.