Week Ending 1/26/2018

HIGHLIGHTS

  • US and international equities advance by just over 2%.
  • The first official GDP estimate of Q4 growth comes in at 2.6%.
  • Some comparisons to 1987.
  • Retail investors getting back into the market.
  • Government shutdown ends (until February 8).
  • Trump imposes tariffs.

MARKET RECAP

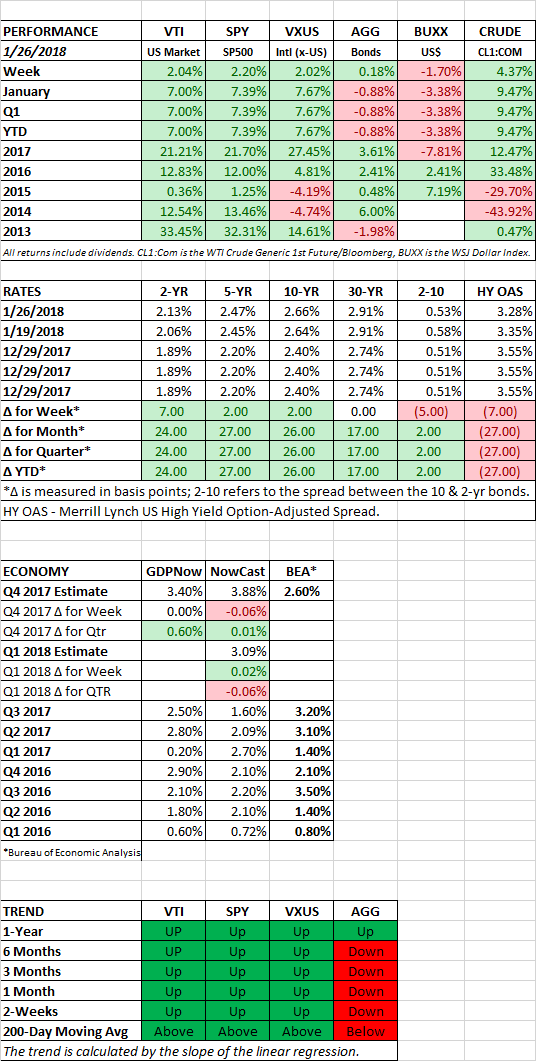
Equities continued to ramp higher, up just over 2% in the US and around the world. Bonds managed a 0.18% advance. The dollar fell by 1.70% on comments by Treasury Secretary Mnuchin that a lower dollar would help US exports. The dollar is down 3.81% for the month.

GDP

The first official estimate for Q4 growth came in a 2.6%, significantly lower than the GDPNow estimate of 3.40% and the NowCast estimate of 3.88%. The estimate is subject to future revisions, but if it holds it stops the two-quarter plus 3% streak and keeps growth in-line with the pattern we saw under Obama.

1987 ALL OVER AGAIN?

This is in no way a prediction that this year will turn out like October of 1987, when the market crashed by 32%, but the consistent rise in the markets brings back some memories from the first few months of 1987. Here are some common themes as we read through past issues of Barron’s:

  • Equities are heading higher, but experts think that “bullishness is not out of control.” (Barron’s 2/9/1987)
  • The Dow doubles without even one 10% correction.
  • Aggressive “high-yield” lending.
  • Equities have gone up while the dollar was going down.
  • Equities increasing with “effortless ease”. (Barron’s 3/2/1987)

RETAIL INVESTORS

Discount brokerages like TD and Schwab reported a jump in new retail clients to close out 2017. Lisa Beilfuss writes in Saturday’s WSJ that the strong trading activity suggests “…the market rally is entering a “melt-up” stage that is bringing in once-skeptical investors.” (WSJ, 1/27/2018, Retail Investors Jump Into the Market)

SHUTDOWN

The government shutdown ended late Monday when Congress passed a continuing resolution to keep the government funded through February 8.

TARIFFS

Trump imposed tariffs and quotas on imports of solar panels and washing machines. The tariffs will impact China and South Korea. More US companies are now expected to seek protection. A case is likely to be brought to the World Trade Organization. If this is the start of the roll-out of the Trump protectionist agenda, slower economic growth, inflation and a hit to equity markets all now become heightened risks. Meanwhile, the rest of the world goes on in promoting free trade, 11 Pacific-rim countries agreed to form a trade bloc without the US.

SCOREBOARD
Week Ending 1/19/2018

HIGHLIGHTS

  • Another week, another record, in both the US and around the world.
  • The ten-year treasury continues its march higher.
  • Senators are racing to complete a deal to avoid a government shutdown.
  • The economy continues to look strong.

MARKET RECAP

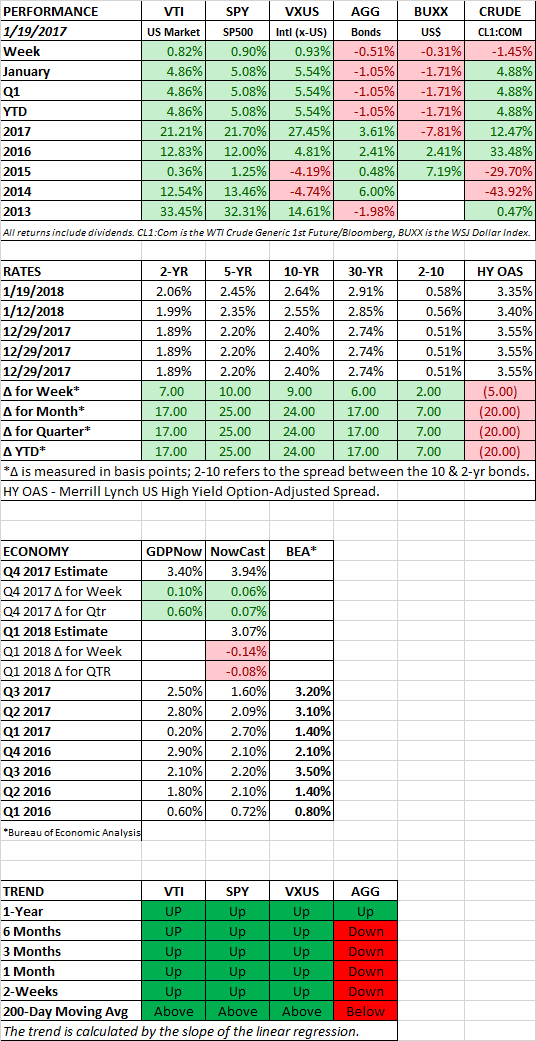
Another week, another record. Both the overall US stock market and the S&P 500 closed at all-time highs, up by 0.82% and 0.90%, respectively. International stocks also closed at a record, +0.93%.

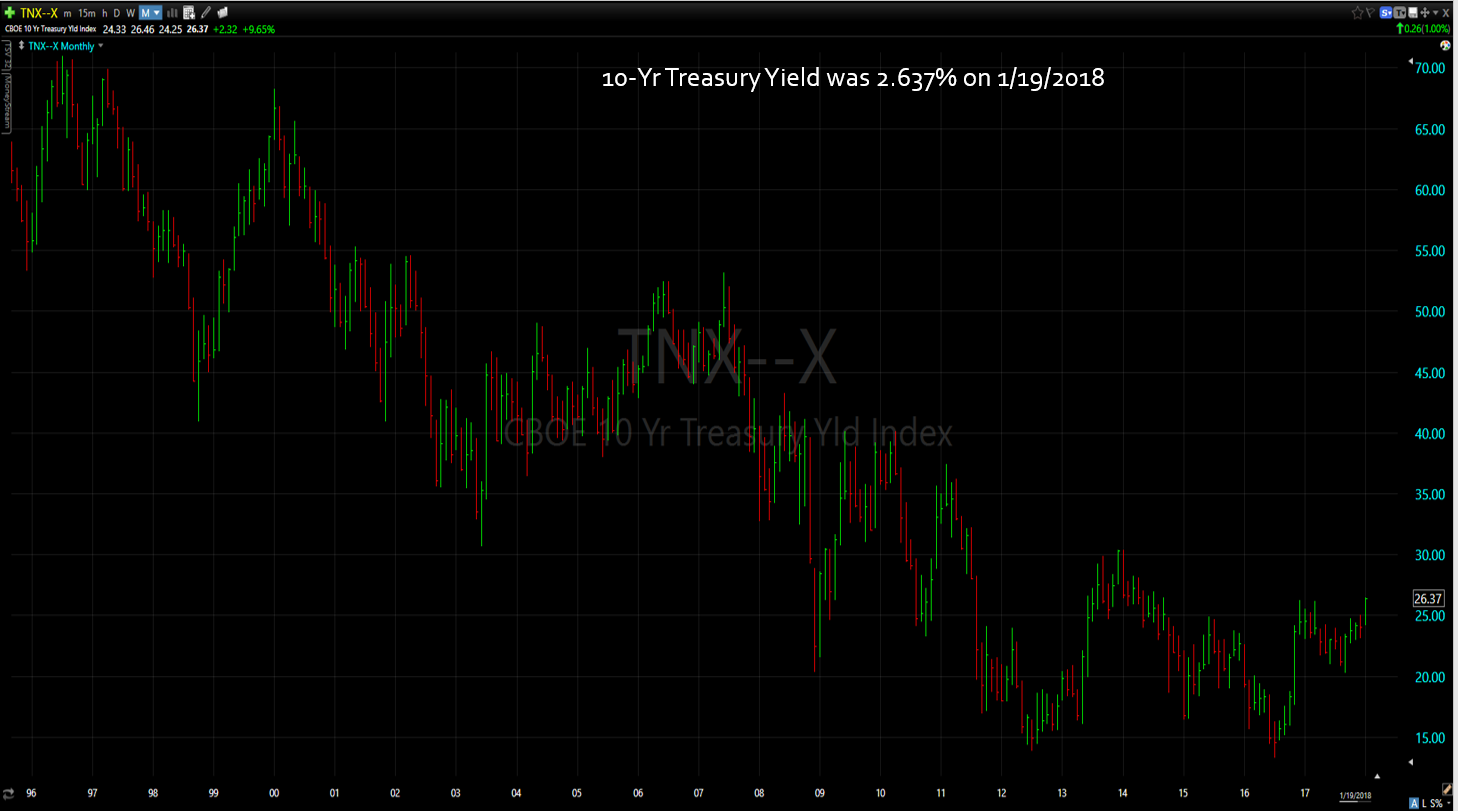
Interest rates were up across the board, that dropped bonds by 0.51%. The 10-year treasury bond has been ramping higher along with stocks, closing the week with a yield of 2.64%, the highest level since July of 2014. The 10-year 2-year yield curve has steepened by 7 basis points so far this month. Part of the jump in yields was due to faster economic growth in China. Chinese growth of 6.9% was the fastest in two years. The 10-Year Chinese bond yield went above 4% for the first time in four years. Faster growth in China should be positive for commodities.

While equities have been rallying, the US dollar has been falling, it is off 1.71% year to date. That is a big drop. While investors here in the US are thrilled with the performance of the US stock market, investors in Europe aren’t. A European investor would be down about 3% over the last two weeks if they owned US stocks in euros, due to the lower dollar.

SHUTDOWN

A group of moderate Senators were racing Sunday evening to avoid a shutdown of the government on Monday.  We didn’t know there were any moderate politicians left, but we hope they succeed. The fact that there was no agreement going into the weekend did not disturb the markets at all. That pretty much sums up the “market think” these days, simply oblivious to the mayhem in Washington and around the world and only concentrating on strong corporate profits and momentum in equities.

ECONOMY

The economy continues to look strong. The GDPNow model has Q4 2017 growth estimated at 3.40%. And the NowCast model has Q1 2018 growth estimated at 3.07%.

SCOREBOARD


Week Ending 1/12/2018

HIGHLIGHTS

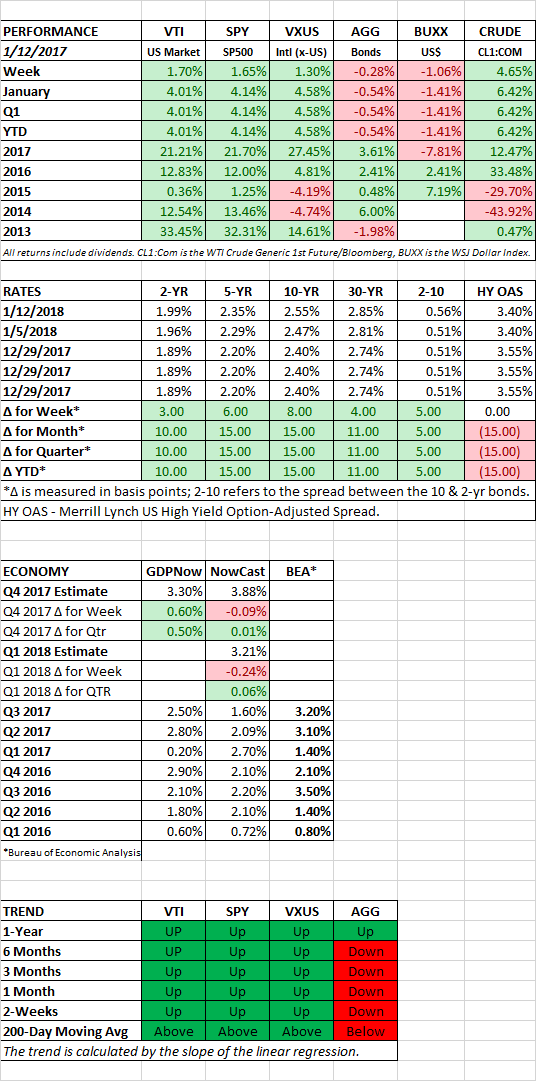
  • Stocks were up by 1.65% for the week and 4.14% for the year.
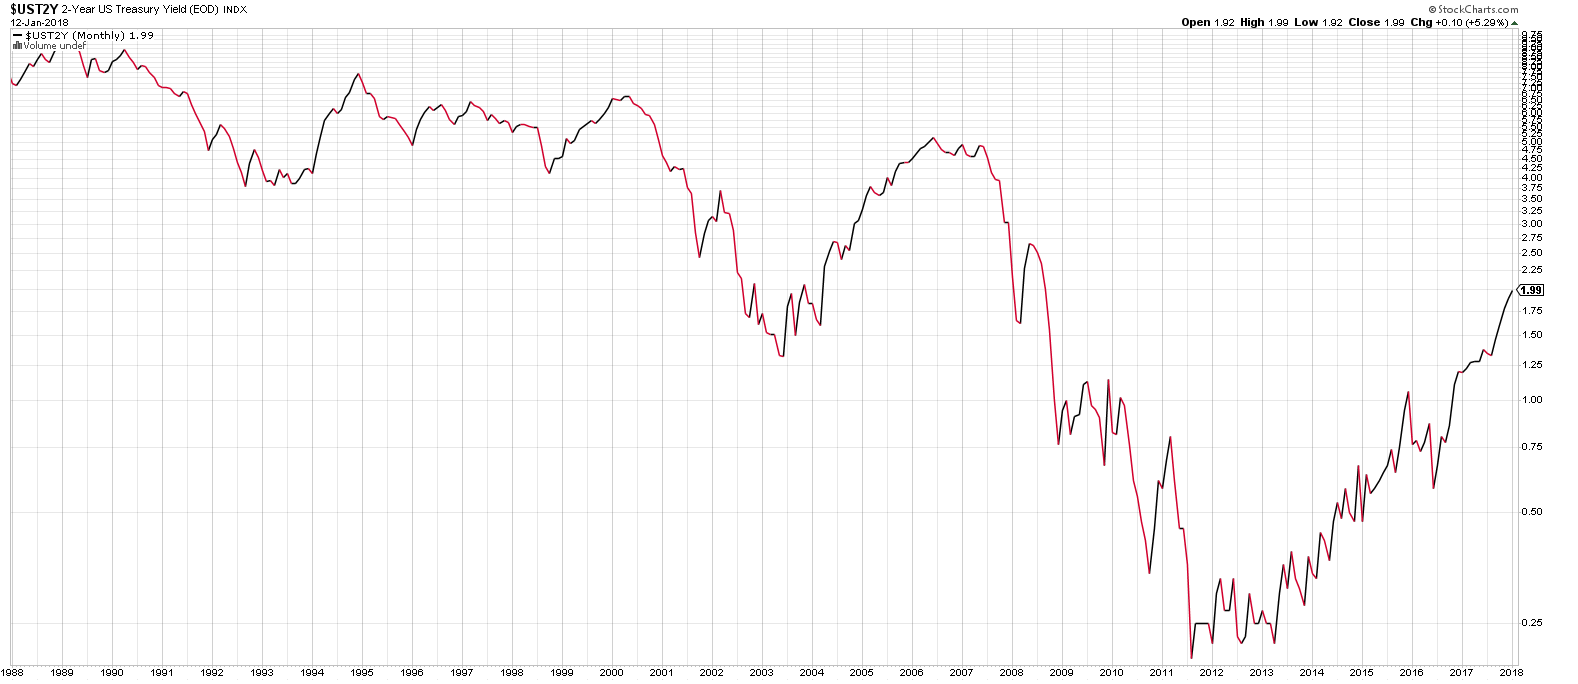
  • Interest rates increased across the board, the 2-year is at 1.99%, yielding more than equities.
  • Market bulls are counting on big earnings increases and a stable p/e ratio.
  • GDP estimates are above 3% for Q4 and Q1, indicating strong growth.

MARKET RECAP

What many are describing as a “melt-up” continued on Wall Street, as US equities increased by 1.65%. The market is now up 4.14% after nine trading days and has advanced eight out of nine times. The one loss for the year was on Wednesday when stocks dropped a mighty 0.16%. International stocks were up 1.30% for the week and are up 4.58% for the year. The dollar declined by 1.06% and crude oil increased by 4.65%.

We had described a few times last year the market’s stairstep pattern of increases. Basically, stocks would consolidate and then advance, and repeat the pattern. Since mid-November, the stairsteps have been replaced by an accelerating angle higher.

Meanwhile, interest rates are increasing across the board. The two-year treasury closed the week yielding 1.99%, more than the yield on US stocks (about 1.80%). It was just recently that stocks were yielding more than the 10-year, now they yield less than the two-year.

Stock market bulls are banking on big earnings increases and a stable price/earnings (p/e) ratio. The earnings estimate for 2017 for the S&P 500 is $131.48 per Thomson Reuters I/B/E/S. For 2018, helped by tax cuts, earnings are estimated to come in at $150.15, an increase of 14.2%. 2019 estimates are for $166, an increase of 10.6%. These are optimistic numbers. The problem is that if interest rates continue to increase, there will be a gravitational pull for the p/e ratio to decline, which will offset to some degree the higher earnings. And then, of course, the higher earnings have to actually come through.

ECONOMY

The GDPNow estimate for 2017 Q4 growth increased by 1/2% on a strong retail sales report. The estimate is now at 3.3%, up from 2.8%. The NY Fed Nowcast has growth estimated at 3.88% for Q4 and 3.21% for Q1.

The Consumer Price Index rose by 0.1% in December. Core CPI was up 0.3%, the most since last January. Most of that increase was due to an increase in the cost of shelter. Year over year the index is up 2.1%.

SCOREBOARD

Week Ending 1/5/2018

HIGHLIGHTS

  • Markets burst higher.
  • Equities might be in a “blow-off or melt-up” phase.
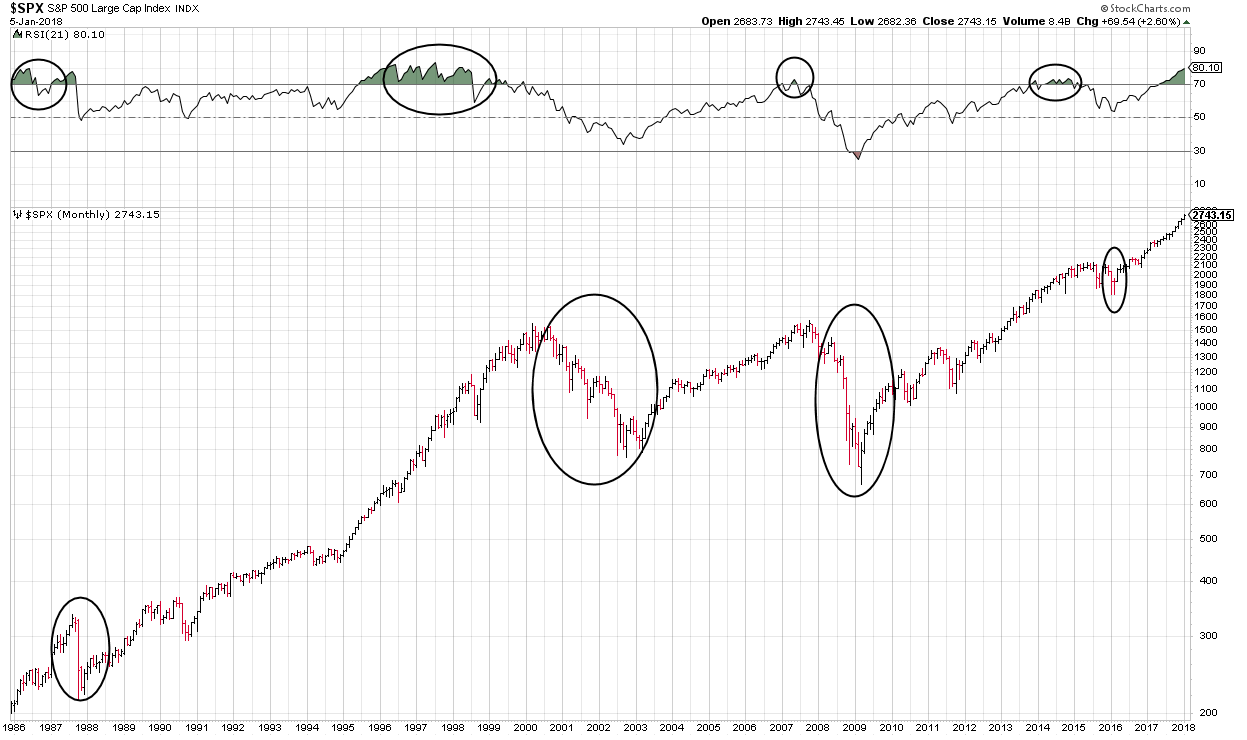
  • Technical indicators show an overbought condition rivaling the mid-80s and late 90s.
  • Solid labor market conditions.

MARKET RECAP

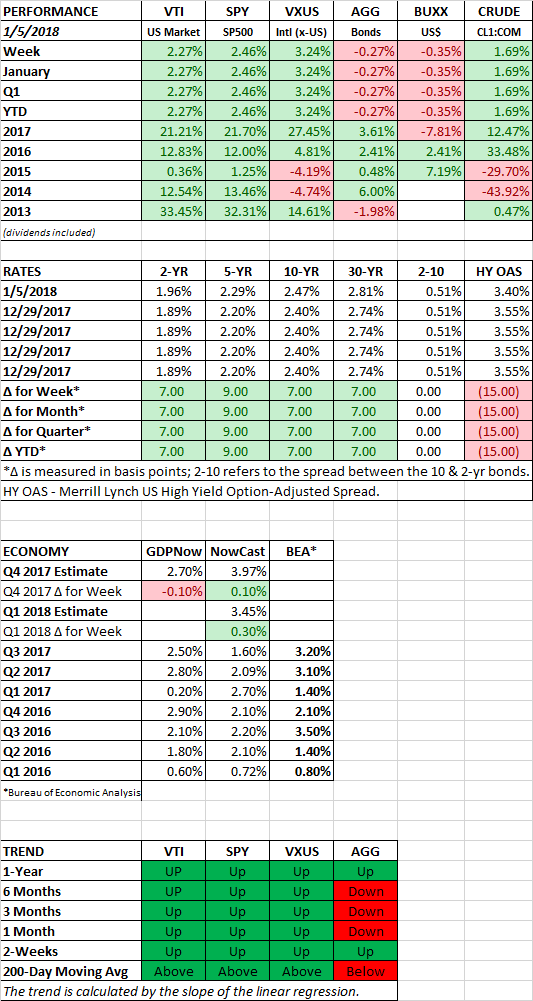
Stocks burst out of the gate to start 2018 as US equities increased by 2.27% and international equities were up 3.24%. It was the best opening week since 2003. The Dow broke through the 25,000 mark. It took only 24 trading days from when the index cracked 24,000. Of course, moving a thousand Dow points is not what it used to be, at least in percentage terms, but remarkable nonetheless.

Synchronized economic growth around the world, lower US taxes, improving corporate earnings, low inflation, low-interest rates, and investor enthusiasm has created a powerful mix that pushes the market up and up despite valuations getting to historically high levels.

Noted investor and market historian Jeremy Grantham summed it up in his recent piece, “I recognize…that this is one of the highest-priced markets in U.S. history. On the other hand, as a historian of the great equity bubbles, I also recognize that we are currently showing signs of entering the blow-off or melt-up phase of this very long bull market.”

In other words, there might be a lot more to run in this bull market, but at some future point, valuations will begin to revert to their mean, or worse.

OVERBOUGHT MARKET

Looking at some technical indicators, the market is overbought. The Wilder’s Relative Strength Index takes a measurement of the speed and change of price movements over a period of time. A measure over 70 is considered overbought. A monthly chart of the S&P 500 and the Wilder’s Relative Strength Index over a period of 21 months, dating back to 1985, shows an overbought condition comparable to 1986-1987 and the late 1990s. Both periods were followed by bear markets. It is important to note that the oversold condition in the 1990s started about 5-years before the bear market of 2000.

We are not anticipating a bear market in the very near term. Economic conditions in the US appear solid, earnings are increasing and there is worldwide growth. You can often find many indicators that will tell you why the market will crash tomorrow, but the market is overbought here from a technical perspective.

ECONOMY

The Atlanta Fed’s GDPNow has Q4 growth estimated at 2.7% and the NY Fed’s Nowcast is at a very strong 3.97%.

Nonfarm payrolls were up by 148,000 in December, lower than recent months. The unemployment rate remained the same at 4.1% and the average workweek also stayed the same at 34.5 hours. Average hourly earnings were up 2.5% year over year. Overall, tight conditions continue to prevail in the labor market.

SCOREBOARD

Week Ending 12/29/2017

HIGHLIGHTS

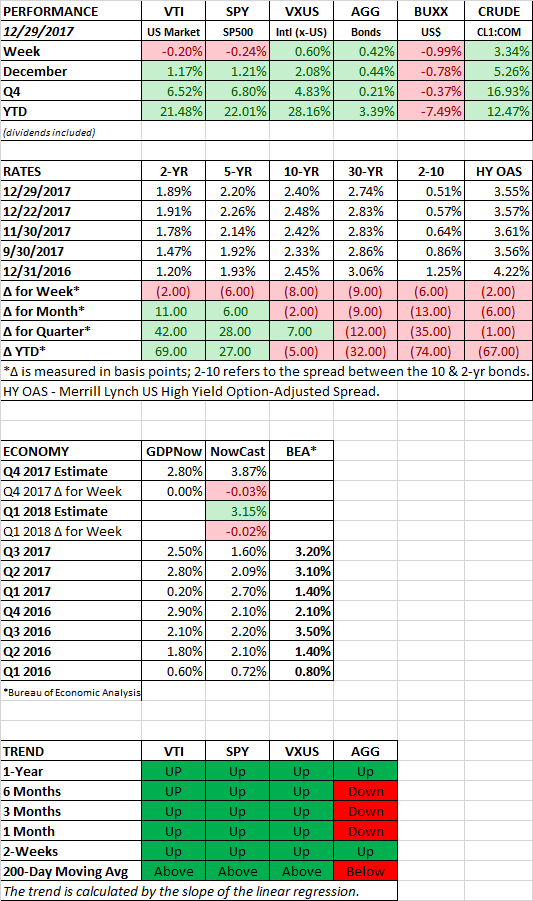
  • US equities close the year with a small loss but are up 21% on the year.
  • International equities are up 28% for the year.
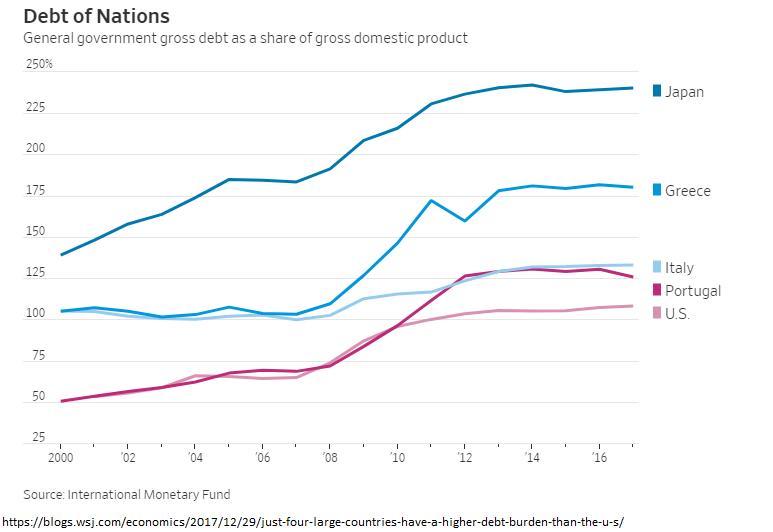
  • US debt is now the fifth largest of all large countries in percentage terms.
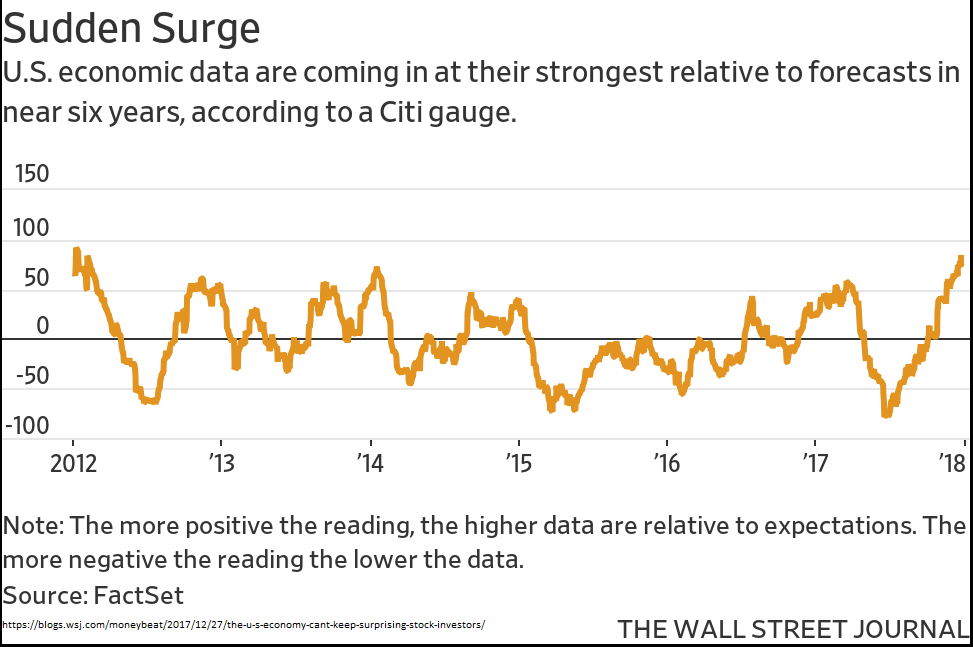
  • The Surprise Index hits its highest level in six years.

MARKET RECAP

US equities closed the year with a loss, falling by 0.20% for the week. But what a year it was, up about 21% (including dividends). Equities were on a tear all year, never falling by more than 2%. The Dow is on a nine-month winning streak, the most since February of 1959 when it had advanced for 12-months in a row. And the S&P 500’s nine-month win streak matches the nine-month stretch that ended in April of 1983. The NASDAQ Composite has now increased six-years in a row, tying the 1975-1980 period as the longest run on record.

International stocks did improve by 0.60% for the week, with a 28% advance on the year. Interest rates fell so bonds were up by 0.42%.

US DEBT

According to the International Monetary Fund, US debt now stands at 108.1% of GDP, the fifth largest amount in percentage terms of all large countries. Meanwhile, the tax bill passed last week will add another $1 trillion dollars or so in debt over the next ten years, and deficits will also increase because of structural issues (social security/medicare). At some point, the country will need to deal with this, especially if interest rates rise.

SURPRISE INDEX

The Citigroup Economic Surprise Index closed the year at its highest level in six years reflecting the best level of constant economic growth in three years. Normally, surprises on the upside lead to revising estimates higher going forward, making it more difficult to continue to “surprise”, which then leads to disappointments if the numbers come in under the estimates. Missed estimates could impact equities to the downside.

SCOREBOARD

Week Ending 12/22/2017

HIGHLIGHTS

  • US markets advance by 0.47% and international equities are up 1.64%.
  • Treasury yields jump higher hurting rate-sensitive investments.
  • Bitcoin falls 36.5%.
  • Trump signs tax legislation.

MARKET RECAP

US equities hit a new high on Monday and then closed successively lower for the rest of the week, at just about the same closing price as last week. However, adjusted for dividends, prices advanced by 0.47%. International markets were up 1.64%.

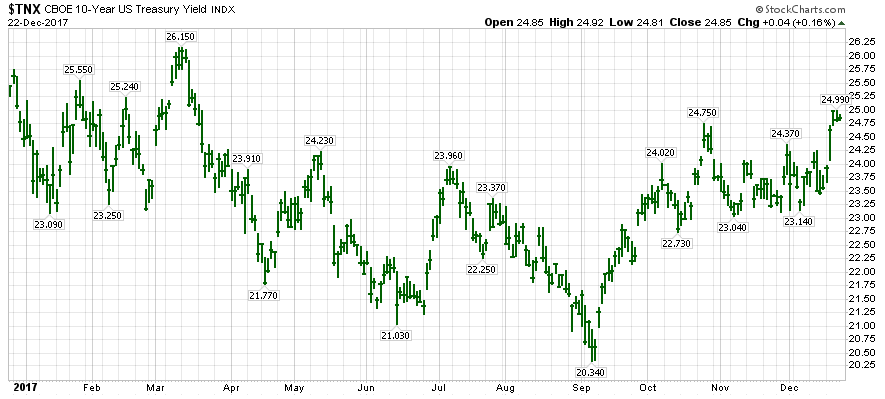
The excitement was with the 10-year treasury bonds. Interest rates jumped to their highest level in nine months, closing the week at 2.48%. The rising rates had a spillover effect on rate-sensitive equities like REITs and utilities, which fell by 3.82% and 4.67%.

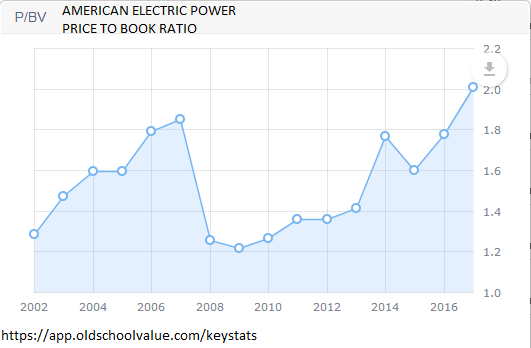
Even with the drop in utilities, many are still expensive on a historical basis. As an example, looking at American Electric Power (AEP), the stock is currently selling at a price to book of 2.0 compared to a median value of 1.60 since 2015, 20% lower than the current ratio.

While utilities have been falling, energy has been rallying. The XLE is up 16% since hitting its low in mid-August.

TAX BILL

Trump signed into law the new tax legislation. The bill is highlighted from an investment perspective by a more competitive tax rate for corporations and the repatriation of foreign earnings. A stopgap measure to keep the government funded through mid-January was also passed.

BITCOIN

Cryptocurrencies collapsed. Bitcoin fell by 36.5% from its peak one week ago.

SCOREBOARD


Week Ending 12/15/2017

HIGHLIGHTS

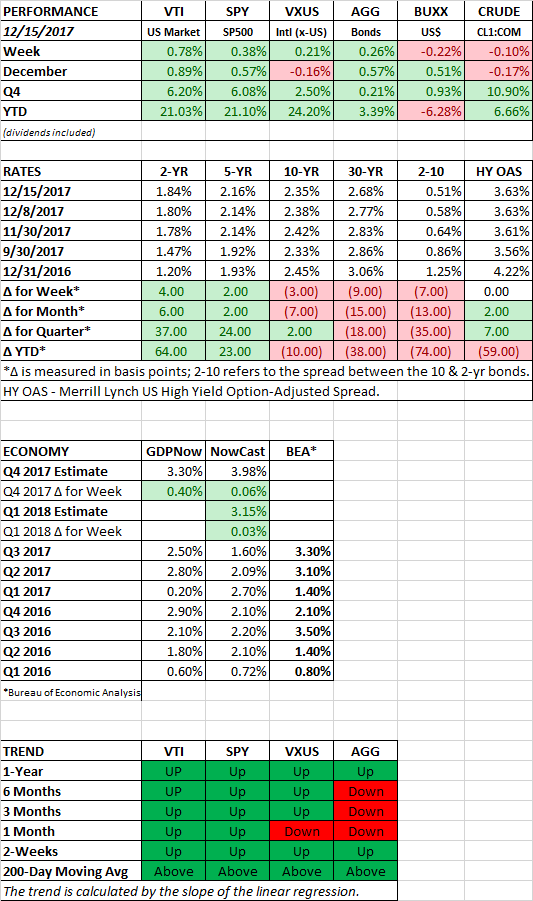
  • Equities up 0.78% to close at another record.
  • The tax plan is close to becoming law.
  • The Fed increases rates by 1/4%.
  • Disney buys most of the assets of 21st Century Fox.

PERFORMANCE

US stocks increased by 0.78% to hit another record. International equities moved ahead by 0.21% and bonds increased by 0.26%. Higher corporate profits powered by the tax bill are getting the credit for the recent stock run. Profits on the S&P 500 might improve by $10 per share due to the tax cut. On the yield front, the 2-year rate increased by 4 basis points and the 10-year fell by 3, dropping the spread to 0.51%

TAX PLAN

Lawmakers are close to passing a $1.5 trillion tax cut. The plan does not simplify the tax system. The bill is filled with staggered dates, new rates, and complicated new provisions. The pass-through legislation will lead to unintended consequences. The bill overall will add to a deficit that the US cannot afford to make any bigger.

The legislation does have needed relief for repatriation of overseas earnings (almost $3 trillion) and a lower tax rate for corporations to make the US more competitive with other countries.

FED

In Janet Yellen’s final session as Chair, the Fed increased the federal funds rate by 1/4% to 1.25% to 1.50%. The Fed currently plans to increase rates another three times in 2018 and twice in 2019. The market is currently pricing in two rate increases, but there are some economists predicting four. In addition, the Fed has begun the process of unwinding their balance sheet.

A combination of lower tax rates and higher interest rates in the US could pose a problem to China in keeping capital at home. In response to the Fed, the Chinese central bank also increased rates, first, to slow capital flight out of China, and two, to try to tame all the leverage throughout the Chinese system. While higher interest rates might lower the appeal of taking on more debt in China, it also increases the carrying cost of current loans in the very highly leveraged Chinese system. It is a tricky balance that the Chinese central bank will have to thread.

It remains to be seen what the European Central Bank will do. But at some point, they will probably slow the pace of their bond purchases and will eventually begin to increase rates.

All the above points to a world with slightly higher interest rates and less central bank stimulus, traditionally a formula that would slow down the pace of the equity market due to a falling p/e ratio.

DISNEY

Disney bought most of the assets of 21st Century Fox for $66 billion (stock + debt – cash) in a monumental deal as it scales up to take on Netflix. Netflix currently trades at an enterprise value to EBITDA ratio of 47, compared to 10.5 for Disney.

SCOREBOARD

Week Ending 12/8/2017

HIGHLIGHTS

  • US equities up by 0.30% to hit a new high.
  • Bitcoin futures launch today after a wild week.
  • Wall Street strategists all project higher US market in 2018 in Barron’s Outlook.
  • Nonfarm payrolls up by 228,000 in another strong labor report.
  • Congress extends deadline on the debt ceiling for another two weeks.

PERFORMANCE

The market dipped on Monday and Tuesday but rallied just enough over the remainder of the week for US equities to hit new all-time highs. The US markets were up by 0.30%. International markets fell 0.21%. Bonds were flat and the dollar advanced by 0.92%.

BITCOIN

Bitcoin futures trading begins today (Sunday, December 11) at the CBOE Global Markets Exchange. Later in the month, the CME Group launches its own bitcoin product. And then the NASDAQ will launch early next year. The futures are set to settle in US dollars, not bitcoin.

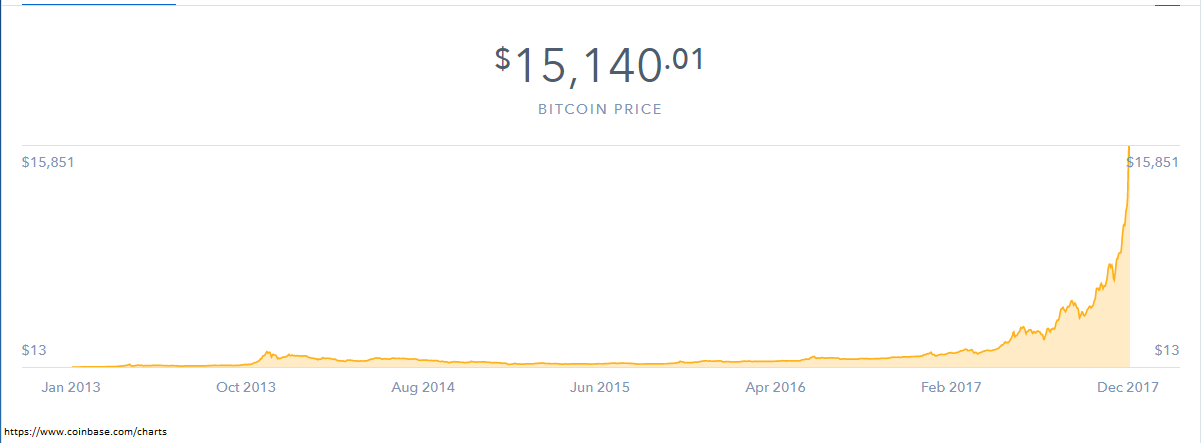
The talk of bitcoin is now everywhere and the consensus by the old-timers is we are watching a bubble in the making. Judging by the chart, it sure looks that way. From Monday to Thursday, the price rose by 53%, only to fall by 22% two days later. Depending on your perspective, buying bitcoin is akin to “investing” in past manias such as Dutch Tulips, or maybe like Beanie Babies (on a much grander scale). To others, bitcoin represents the future of currency and just about everything else.

WALL STREET FORECASTS

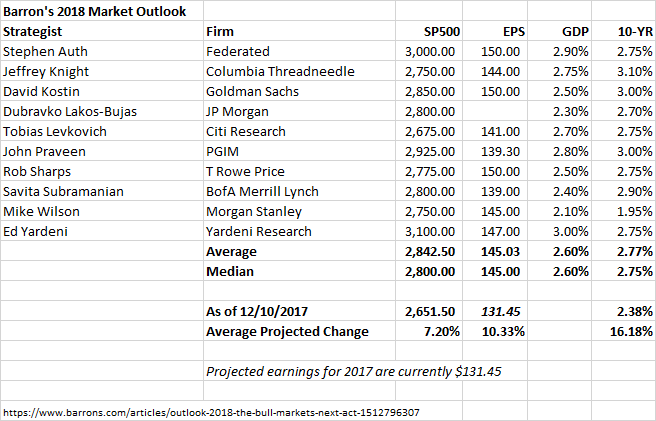
Barron’s interviewed 10 investment strategists for their 2018 forecasts. None of the ten forecast a fall in prices in 2018. Tobias Levkovich from Citi Research is forecasting a flat market. He projects a 2018 price of 2675, just about 24 points from here. All of the others are more on the bullish side. At the high end is Ed Yardeni, forecasting a price of 3100. The projection calls for a 7.2% gain, fueled by higher projected earnings of about 10%. But those earnings increases are counting on a tax cut worth about $10 in earnings. Take out the tax cut and earnings would only be estimated to increase by about 3%. The strategists also forecast an increase in the 10-year treasury rate to 2.77%, up from the current 2.38%.

Last year the group projected the S&P 500 to end 2017 at 2380, that turned out to be much too low (barring any major sell-off in the final few weeks of the year).

Fears that the strategists cited include inflation, aggressive rate increases by the Fed, regulations against social media companies, and a bitcoin crash.

LABOR MARKETS

Labor markets continue to show strength. Nonfarm payrolls were up by 228,000. The average workweek increased by 0.1 hours to 34.5 hours. The unemployment rate remained steady at 4.10%. Average hourly earnings moved ahead by 0.2% and the year over year change is now at 2.5% compared to 2.3% last month.

SPENDING BILL

The House and Senate both passed a bill that provides funding for the US government for another two weeks.

SCOREBOARD

Week Ending 12/1/2017

HIGHLIGHTS

  • US equities up by 1.46%, international stocks fall. Lots of volatility Friday.
  • North Korea test fires a missile that threatens the entire continental United States.
  • Former Trump advisor Michael Flynn pleads guilty and agrees to cooperate with the special counsel.
  • The Senate passes tax legislation, now it moves to a conference committee.
  • GDP growth is revised higher to 3.3% for Q3 and forecasts for Q4 are for higher growth

PERFORMANCE

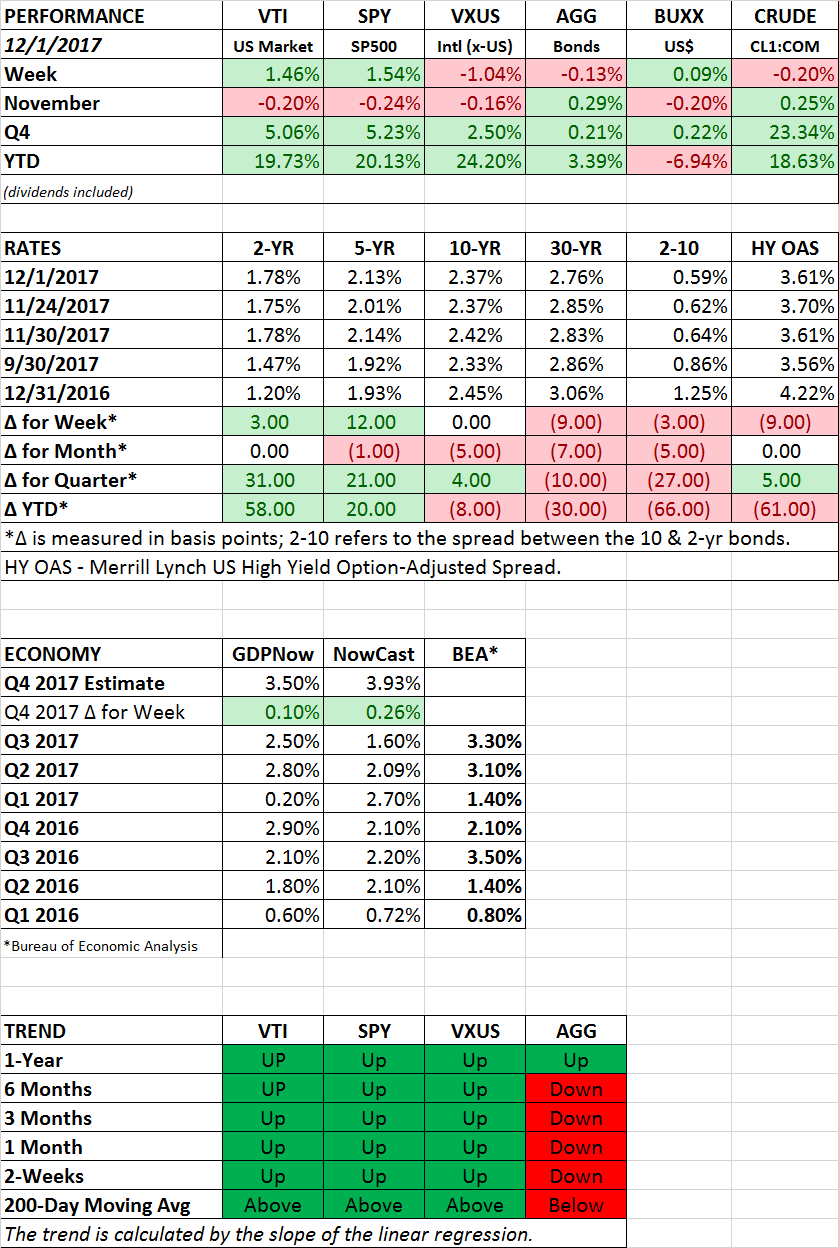
It was a bumpier ride than normal, but the market continues to travel in the same direction, up, as US equities advanced by 1.46%. North Korea even test fired a new missile that can supposedly hit anywhere in the United States, and that didn’t shake the market advance. International markets dropped by 1.04% and the bond aggregate was down slightly by 0.13%.

Markets moved higher on progress on tax legislation. On Friday, news broke that former advisor to President Trump, Michael Flynn, was going to please guilty and cooperate with the special counsel’s inquiry regarding election interference. That sent equities into a tailspin. Stocks immediately tumbled and were down 1.6% from the open by midday. But the buy the dip mentality prevailed and the market rallied to close down just 0.2% for the day.

TAX LEGISLATION

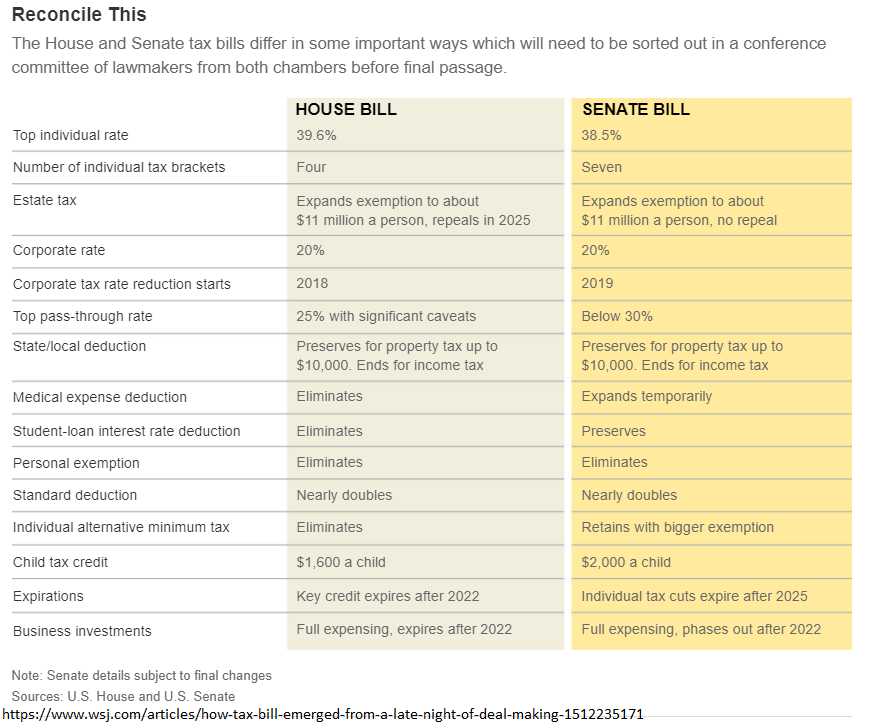
Tax legislation now goes to a committee with the House and Senate. The resulting legislation, if passed, will impact almost every area of the US economy. The original hope was that tax legislation would simplify the tax system, encourage economic growth and be somewhat revenue neutral. Most likely, the end result coming out of committee will be a tax system that is more complicated, especially in terms of pass-through entities (leading to unintended consequences), $1 trillion-plus added to the deficit over the next 10-years and a questionable impact on future growth, at least according to the plan’s critics. Similar to Obamacare, there is a rush to pass legislation for the sake of just passing legislation, instead of crafting a well thought out bill that is better understood and debated.

GDP

Real GDP growth for Q3 was revised higher to 3.3% from the original estimate of 3.0%.  It was the fastest growth in three years. Personal income increased by 0.4% in October. Disposable personal income rose by 0.5%, the most in eight months. Initial jobless claims came in at 238,000, a historically low number. Retail sales during the Thanksgiving holiday were good. Overall, the economy continues to look strong. Estimates of Q4 growth increased in both the Atlanta Fed’s GDPNow model and the New York Fed’s NowCast model to 3.50% and 3.93% respectively, up from 3.40% and 3.67%.

SCOREBOARD