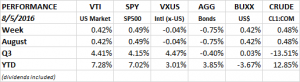
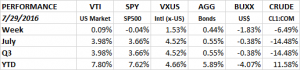
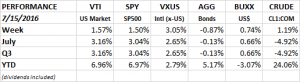
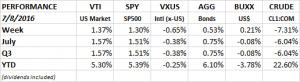
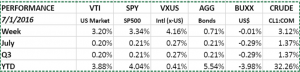
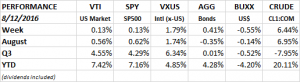
Week Ending 8/12/2016

PERFORMANCE

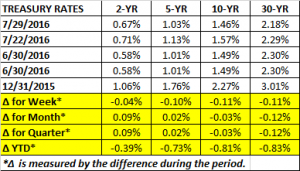
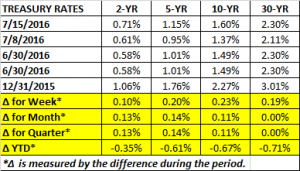
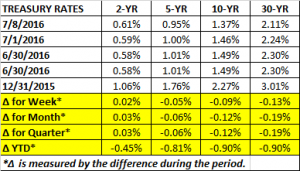
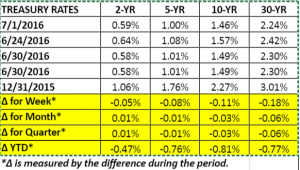
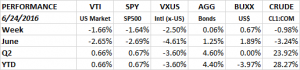
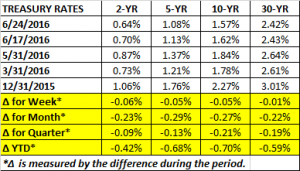
It was another flat week as the US equity markets increased by about 0.13%. The story was better worldwide (x-US), gaining 1.79%. Bonds increased 0.41% as rates fell by about 9 basis points on treasuries that mature in 10 years or longer. The dollar fell by 0.55% and crude had a big rally, advancing 6.44%.

Performance 8 12 2016

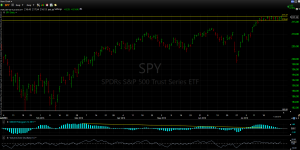
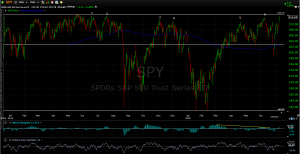
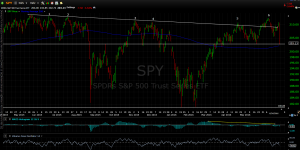
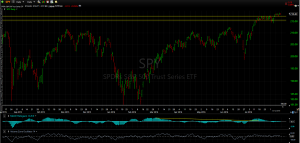
On Thursday, all three major indexes (Nasdaq, SP500 and Dow) hit new highs. That was the first time that has happened since the last day of the last century, December 31, 1999. Despite that, there has been no big spike higher in US equities, the market has broken out from its recent range and has moved only slightly higher.

SPY 8 12 2016

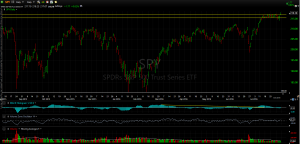
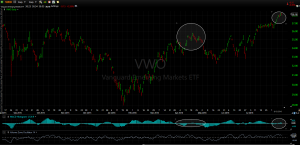
What has been making a decent move higher are emerging markets. The chart below shows the VWO (Vanguard Emerging Markets ETF). The fund was up about 1.8% on the week and is up 16.7% on the year. Maybe emerging markets are up because on some valuation metrics, such as price to book, this is one area that is still reasonably priced on a historical basis compared to US equity markets. Or maybe, given US politics, Brexit, and other disconcerting geopolitical events, emerging markets don’t look so different from the more established developed markets!

The chart does show a negative divergence between the moving average convergence/divergence (MACD) indicator and the price action. The former is moving lower while the latter is moving higher. Sometimes that indicates a pullback is due.

VWO 8 12 2016

ECONOMICS

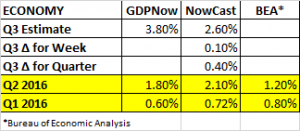
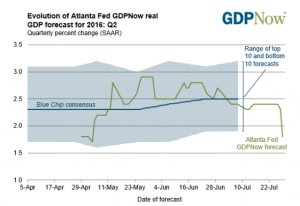
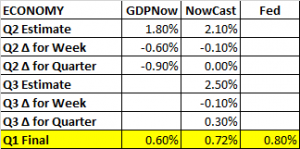
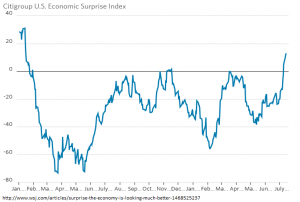
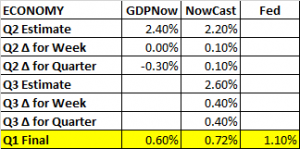
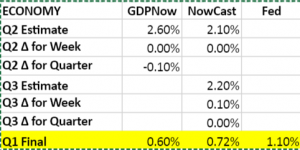
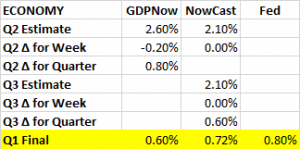
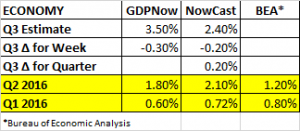
Retail sales came in flat for July, after have a nice increase in the prior months. The consensus was for a 1/2% gain, so the report was a disappointment. The slowdown hurt GDP estimates, and Q3 estimates for both GDPNow and the NowCast fell on the report.

Jobless claims remained steady, falling by 1k to 266k.

GDP Estimates 8 12 2016

THE BENEFITS OF FREE TRADE

Trump especially, but Clinton also, have been railing against free trade. The unfortunate part of all of this is that cutting back on free trade will hurt the majority of Americans. Free trade may not make good politics, but it does make good economics, and ultimately, free trade improves the economy, not hurt it. Specific, legitimate trade issues, such as theft of intellectual property or government subsidies, should be dealt with, but don’t take down the entire free trade infrastructure which has vastly improved economies around the world including here in the United States. Trade wars are dangerous, it has already been tried once, and it didn’t work out so well (read up on the Depression and Smoot-Hawley).

Read Dan Ikenson’s piece from the Cato Institute for more.

LIBOR ON THE RISE

While interest rates have been falling just about everywhere else, The London Interbank Offered Rate (LIBOR) has been on the rise. LIBOR is currently 0.82% up from 0.33% a year ago. LIBOR rates impact costs for banks, businesses and individuals.  LIBOR costs are up because of money-market reforms that have pushed funds into government debt instead of LIBOR based debt. This is another unintended consequence of government regulation. As demand for LIBOR based debt has dried up, rates have increased. Short-duration bond funds should be benefactors but anyone with debt tied to LIBOR is now paying more.

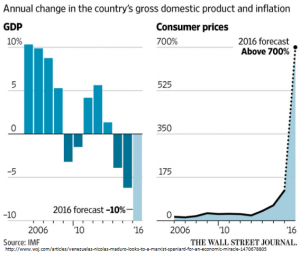
VENEZUELA CONTINUES TO UNRAVEL

Venezuela continues to violate every rule of economics as the Chavez/Maduro team further destroys the country. President Maduro now has turned to a Marxist professor from Spain for advice. Even most leftists now agree the country needs to open up the economy for any hope for positive change. But Maduro is going in the opposite direction, with the help of his new friend, Alfredeo Serrano. There will now be more state control, not less! Massive food shortages are the result of price controls and expropriations. Not according to Serrano, they are the results of “speculative capitalism” and companies hoarding products.

However, at the end of the week, Venezuela did make one good move, they announced they would open up their border with Colombia. That at least is one step in the right direction.

Crisis in Venezuela


Week Ending 8/5/2016

PERFORMANCE

The overall US market as measured by the VTI was up 0.42% for the week. International markets were flat. Bonds declined as interest rates increased. The USD and crude were both up.

Performance 8 5 2016 - Copy

Equity markets got a big lift with another strong jobs report (see below). The SPY (SP500 ETF), which had been trading in a tight range between 215.60 and 217.35 since mid-July, attempted to push lower between Tuesday and Thursday. On Tuesday, the SPY closed 5 cents below that range, but on Wednesday and Thursday the bears could not follow through, and the market closed within its recent range. On Friday, the strong jobs number helped the market break higher, closing at 218.18.

SPY Chart 8 5 2016

ECONOMICS

Nonfarm payroll increased by 255k, making it two straight months of solid gains. The 255k was above the consensus estimate of 179k. The average work week increased by 0.1 hours to 34.5 and average hourly earnings increased by 0.3%.  It was a strong report and the Fed may have a hard time ignoring it when deciding on whether to increase rates or not. The numbers are not consistent with recent GDP data which showed growth of only 1% growth during the first half of the year. The Fed will have to figure out which data point better reflects economic reality.

ISM Non-Manufacturing fell to 55.5 from 56.5 in July indicating growth is continuing albeit at a somewhat slower pace than last month. The Markit US Services PMI flash reading rose by 1/2 point to 51.4, showing slight growth. Light vehicle sales had their best month since March of 2014, up 6.4% in July.

The Bank of England dropped its lending rate to 0.25%. That marks an all-time low in the Bank’s 322-year history. The Bank will also start buying corporate debt, all in an effort to counter Brexit.

GDP

The Atlanta Fed’s GDPNow came out with their initial reading for Q3. The estimate came in at a whopping 3.80%. We have a long way to go until we get final Q3 numbers, but a growth rate of 3.80% would be way above trend and a huge positive for the economy. The NY Fed’s Nowcast estimate for Q3 was a more modest 2.60%.

GDP Estimates 8 5 2016 - Copy

EARNINGS

Earnings have been coming in better than forecast. On June 30th, the estimated earnings decline for Q2 was -5.50%. Currently, the blended earnings decline is coming in at -3.5% (according to FactSet). 86% of SP500 companies have now reported, 69% beat earnings estimates and 54% beat sales estimates.

At some point earnings (green below) will need to turn around and start moving up. The driver of most equity returns this year has been multiple expansion (purple below) with some help from dividends (blue below).

Equity Returns by Source

THE LACK OF ECONOMIC GROWTH

Increased Regulation

The WSJ reports that the Obama administration has just enacted their 600th major regulation rule, defined as a rule imposing costs of more than $100 million. The Bush administration wasn’t much better, they imposed 496 such rules. The American Action Forum calculates the total cost of these rules at $743 billion. If there has been one theme dating back decades it has been the growth of regulation in the US. If you are wondering why we have seen such lackluster growth since the 2008 recession, regulation might be a good place to start.

Demographics

Demographics might be another reason growth is in slow motion. Nicole Maestas of Harvard University and David Powell of the Rand Corp. have published a paper showing that employees leaving the workforce to retire has a negative impact on productivity which harms the entire economy. The authors analyzed the impact of aging on the different states in the US and concluded that for every rise of 10% in the share of a state’s population over the age of 60, growth in per-capita GDP was cut by 5.5%.  A smaller labor force and the loss of experienced employees (impacting productivity) were the main drivers in the cut in growth. A possible solution would be to encourage people to retire later, not earlier.

The Hidden Impact of Aging

VALUATION

Here is another view on valuation. Geraldine Sundstrom of Pimco compares how “certainty” and “uncertainty” are priced. The blue line shows 10-year US treasuries, which now trade at about 65x earnings. Corporate credit, trades at about 35x, and the SP500 trades at 20x. Sundstrom writes that “[corporate] credit is likely to remain attractive, while the jury is still out on equities.” She thinks inflation expectations need to normalize and earnings need to recover to support equities, US treasuries remain an important diversifier, but that comes at an expensive price.

Paying Up

Week Ending 7/29/2016

PERFORMANCE

The US equity markets were flat, but international markets advanced by 1.53% and the bond index managed a 0.44% gain. The US dollar dropped by 1.83% and crude took another hit and fell by 6.49%. July overall turned out to be a great month. The US markets were up almost 4%, international about 4.50% and bonds +0.55%.

Performance 7 29 2016

The SPY (SP500) ETF has traded in a tight range between $215.31 on the downside and $217.54 on the upside. That spread represents just 1.02% of the closing price on Friday. The Volatility Index (VIX) closed at 11.87, a ridiculously low number based on history.

We are now start August, which has been the worst month of the year over the last 20 years. The Dow has averaged a decline of 1.30% during that time period.

SPY 7 31 2016

Treasury rates fell by about 10 basis points from the 5-year bond on out in reaction to the lower GDP number (see below).

Treasury Rates 7 29 2016

ECONOMICS

In a shocking report, GDP grew 1.22% in Q2. That was way off the GDPNow estimate which was 2.4% last week and the NY Fed’s Nowcast which had growth estimated at 2.2%. GDPNow was revised lower earlier in the week to 1.8% but it was a miss that was simply unexpected. The consensus was for a 2.6% advance.

GDPNow July 29 2016

Of course, GDP might end up being revised higher (or lower) as more data comes in, but growth of 1.22% is a big disappointment. The number was hurt by a significant fall in inventories. The good news is that when businesses rebuild their inventory levels, that will provide a boost to GDP down the line. On the positive side, consumption increased by 2.8% for the quarter, the highest growth rate since 2014.

The GDP report must have even surprised the Fed, which earlier in the week indicated that an interest rate hike is back on the table. The Fed stated that “near-term risks to the economic outlook have diminished.”

Of late, economic reports have been coming in better than expected as evidenced by the Citibank Surprise Index that we posted a couple weeks back (click here).  But with the lower GDP number, with the possible slowdown from Brexit, geopolitical problems and the US Presidential election, economic risk to the downside is increasing.

Jobless claims rose to 266k, up 14k from last week. But 266k is a very low number, the labor market continues to be tight.

For Q3, the NY Fed Nowcast dropped only 10 basis points, showing respectable growth of 2.50%.

GDP Estimates 7 29 2016


Week Ending 7/22/2016

PERFORMANCE

The US equity markets were up about 0.70%, international +0.28% and the bond index, +0.24%. The dollar continued to rise, +0.81% and crude oil continued to fall, -3.81%.

Treasury rates were down just slightly for 5-year maturities and up.

FED

Consensus is moving back towards a rate hike this year. The Fed Bias Index is based on a modified Taylor Rule, the US unemployment rate and the Bloomberg Financial Conditions Index. The Bias Index now favors tightening. In addition, with the strengthening of financial markets and improved economic reports the Fed is going to be in a good position to hike rates, likely after the election.

ECONOMIC REPORTS

The Empire Services Business Activity Index improved by 2.2 points, as service activity grew in the NY region. But optimism about the near-term outlook declines to its lowest level in 10 months.

The Markit Flash US Manufacturing PMI was up 1.6 points in July to 52.9, it was the biggest increase since August 2014.

Housing starts were up 4.8% in June. Architecture Billings Index was down slighty by 0.5 to 52.6, but still up from last year.

The Case Freight Shipments Index was up 1.7% in June, the fifth consecutive month, but was down 4.3% year over year.  Railcar loadings have also been heading up. Positive trending railcar loadings would indicate the economy is generating momentum.

GDP

GDP estimates remained the same this week.


QUARTERLY WEBINAR

Our report this week is shorter than normal as we had our quarterly webinar this weekend. We will send around the YouTube link next week.

SUMMARY

It was a fairly quiet week in the US equity markets. Trading was in a tight range. Economic reports continue on the favorable side.


Week Ending 7/15/2016

PERFORMANCE

It took 425 days by the SPY (SP500 ETF) hit an all-time high on Tuesday and finished the week higher by 1.50%. The VTI (overall US market) added 1.57% and the VXUS (international x-USA) was up 3.05%. This continues to be a market that hardly anyone believes in, and that may be enough to keep momentum positive. Market breadth (number of companies advancing versus declining) is solid and strong performance by the small caps all are all good technical signs. But the Dow transports are not near their highs. Market analysts like to see transports confirming the action of the overall market. The US dollar was up another 0.74% and oil was up 1.19%.

Performance 7 15 2016

Treasury rates went sharply into reverse. The general consensus going into last week was that rates were headed lower, thus providing fuel for equities to move higher. But that didn’t happen last week. Rates went higher across the curve.

Treasury Rate 7 15 2016

TECHNICALS

Interest rates have been declining for 35 years. Maybe we saw the bottom last week. As we wrote above, the consensus was that interest rates were still headed lower. But the market had none of it and interest rates reversed higher this past week after setting an all-time record low. The monthly chart below graphs the 10-year Treasury yield (symbol is TNX). After setting an all-time low, the TNX couldn’t hold it, setting up a “spring” (see our May 27th column). There was also a positive divergence with the “volume zone oscillator” (VZO). Notice the white circle in the bottom right of the chart. That sub-graph shows the VZO. The VZO evaluates volume in relation to the direction of the price change. In this example, when the yield on the TNX is moving lower, the VZO was moving higher, resulting in what is called a “positive divergence”. Some technicians would consider that a bullish signal that interest rates would move higher and that is what happened last week.

TNX

Of course, there is no technical indicator that is perfect and works all the time. In fact, all college students learn in Corporate Finance that according to the efficient market hypotheses, markets are “weak form efficient.” That essentially means that securities follow a random walk, and that future prices are not influenced by past prices. In other words, looking at technical charts doesn’t help traders or investors. Many people disagree with that hypotheses.

ECONOMY

Retail sales advanced 0.6% in June, making it three months in a row. Year over year, retail sales are up 2.60%. Industrial production was up .06% in June, the most in nearly a year. But for the quarter, industrial production was down 1% annualized. Year over year industrial production is down 0.7%.

The Consumer Price Index rose 0.2% in June. Year over year, CPI is up 1.0%, but Core CPI (inflation x food and energy) was up 2.3%, the second fastest pace since 2012. Import prices declined 4.8%, year over year, led by drops in the price of fuel. The pace of decline has slowed over the last nine months. Overall, inflation remains under control.

Mortgage refinancing is up 80.3% year over year as borrowers take advantage of lower interest rates, the fastest pace since July 2012. The Freight Transportation Services Index was up 0.2% in May.

Economic reports have been surprising to the upside. The Citigroup US Economic Surprise Index measures how reports come in compared to consensus. After hitting a recent bottom on May 12, the index has been surging to the upside. Positive surprises in economic news will generally move markets higher and that has probably helped move the market to new highs.

Surprise Index

GDP

The Atlanta Fed’s GDPNow estimated Q2 growth remained steady at 2.4%. The NY Fed’s Nowcast estimate increased by 0.1% to 2.20%. The Nowcast estimate for Q3 moved up by 0.4% to 2.60%. It is very early to nail down the Q3 numbers, but right now the trend over the first three quarters of 2016 is going in the right direction.

GDP Estimates 07 15 2016

JOLTS:

Job openings dropped for the first time in six months, falling 4.9% in May. Hires were down by 1%, the third straight monthly decline. Both declines are consistent with late cycle labor market activity.

DOLLAR STRENGTH

The US Trade-Weighted Dollar Index is a measure of the value of the US dollar compared to other world currencies. The index was started in 1973 with a base value of 100. Today, the value is 90.62. The high this year was 95.80 in January. Between June 2014 and March of 2015, when the dollar was spiking, the index increased by 23%. Economists consider a 4% move in either direction as similar to a 25 basis point change in the interest rate. That would mean the 23% move would be equivalent to a 1.4375% increase interest rates. That move, coupled with the December rate increase, would have a net effect of higher rates of 1.69% since March of 2014, possibly help explaining the sluggishness of the economy and the hit to corporate profits. The worry now is that the dollar may strengthen further on Brexit fears.

Financial Conditions Would Tighten on Dollar Rise

DO LOW RATES REALLY HELP THE ECONOMY?

That was the question in Kopin Tan’s Streetwise column in Barron’s this week. Tan notes that U.S. households have $14 trillion in debt but 7x more in assets including $26 trillion in cash and fixed income assets. Deutsche Bank strategists write low rates can be “a sizeable net tax, not a subsidy.”

SUMMARY

The equity markets set a new high after 425 days. Ultralow interest rates helped that move, but rates have gone up over the last week. Economic news has been tilted slightly positive of late.

Pokémon Go

Apparently this is the ultra-hot new game, who would know?! A hint of what gaming will look like in the future.

http://www.bloomberg.com/news/articles/2016-07-11/pokemon-go-s-already-capturing-minds-and-money

Week Ending 7/8/2016

Performance

The market rocketed higher on Friday fueled by a big increase in nonfarm payrolls (see further below). The report signaled the economy continues in slow growth mode and alleviates fears that a recession is right around the corner. The SPY (SP500 ETF) was up 1.30% for the week, closing at 212.65, just shy of its all-time record of 213.50 on May 21, 2015.

Short-term investors are faced with a huge quandary here. On the one hand, the level of uncertainty around the world, which the market never likes, is at historic highs. The US economy appears steady in slow growth mode, but around the world, especially with the possible negative impact of Brexit, there is a greater threat of recession. In addition, while the US economy is not in recession, US large caps have been in an earnings recession going on five quarters now. The US presidential election increases the uncertainty level like never before. Based on traditional metrics, equities look overvalued. On the other hand, bond yields are at all-time lows, which make equities look inexpensive (see further below). Lower bond yields encourages investment in dividend paying equities. Uncertainty and negative interest rates overseas pushes investment into the US. The SPY is $0.85 away from hitting an all-time high and if it breaks through there is the chance for a further run higher. So there are lots of reasons why the market can break higher or lower in the near term, which might explain why it has been trading in an approximate range between 200 and 212 on the SPY for most of the last several months.

Political Uncertainty

Bonds were up 0.53% on the week, the US dollar rallied by 0.21% and crude fell by 7.31%.

Performance 7 8 2016

The 10-year hit another all-time low closing at 1.366%. The yield curve continued to get flatter.

Treasury Rates 7 8 2016

Using a model of the spread between the 10-year and 3-month Treasury rates the NY Fed projects the chance of a recession in the next 12-months at 8.10%.

Treasury Spread 10 year - 3 month

Technical

The market is as close as you can get to setting a new high. In six previous attempts, a failure to set a new high has led to a sell-off. In the event that the market does set a new high, a failure to hold the high, called an “upthrust” (described in our column on May 27), would signal a possible sell-off. However, the market has been trading sideways for a long-time now, and breakouts after such a long sideways trading period often indicate a pretty good move higher.

SPY 7 8 2016

Valuation

Ben Levisohn writes in this week’s Barron’s that stocks, despite selling at a historically high P/E, look cheap on a relative basis. If you flip the price/earnings ratio of 16.7, you get an earnings yield of 5.99%. Subtract the 10-year treasury yield of 1.38% and the difference is 4.61 percentage points, close to the highest level of the last 15 years.

That spread, of course, is no guarantee that stocks are a no brainer buy here. As we have documented in this column in the past and up above, there are many arguments as to why the market is overvalued, including all of the traditional metrics such as price/earnings, price/book, etc.

Economics

Factory orders fell 1% in May. Nondurable goods were up 0.3% but durable goods were down 2.3%. Year over year, factory orders were down 2.5%. Light vehicle sales dropped 4.5% in June, year over year, they are down 2.0%. The ISM New York Current Conditions Index was up 8.2 points to 45.4 for June.

Employment

Nonfarm payroll jumped by a giant 287k in June, an eight-month high. That offset the weak May report which was revised lower to 11k. Jobless claims dropped by 16k last week to 254k. That was the fewest since mid-April and close to historic lows. Average hourly earnings were up 2.6% year over year, the fastest rate of increase in seven years. Taken all together, it looks like the low May nonfarm payroll report was a one-off and the labor market continues to be tight in the US. The unemployment rate increased to 4.9% from 4.7%, and back to where it was in January. The increase was mainly due to more people entering the job market.

Global PMI

Global PMI remained the same at 51.1 in June, indicating slight expansion. Most of the survey was done pre-Brexit. Manufacturing rose to 50.4 and services fell 0.1 to 51.3. During previous recessions, PMI has been less than 50. However, with uncertainty courtesy of Brexit and the US election, we are still on a global recession watch. The Eurozone composite was at 53.1. The US measured 51.2. Japan was at 49. Russia increased to 53.4.

Brexit

Multiple British real estate asset managers put a temporary halt on investors taking money out of their funds. The British real estate market has been booming, but investors are worried that will go quickly into reverse. Many of the investors are foreigners, so declining real estate values doubled with the pummeling of the British pound could lead to a “run” on the funds. Contagion could lead to other sectors.

GDP

The Atlanta Fed’s GDPNow forecast for Q2 growth fell to 2.4% from 2.6% last week. The drop was due to a cut in second-quarter real consumer spending growth due to slower light vehicle sales. The forecast of the contribution of net exports also fell. The NY Fed’s Nowcast forecasts Q2 growth at 2.1%, unchanged on the week. Q3 estimated growth ticked up to 2.3% from 2.2%.

Economy 7 8 2016

SUMMARY

The market is right there, knocking on the door of setting a new high. It has failed in six previous attempts, each of which led to a sell-off. The US economy continues in slow growth mode and solid payroll reports reduced recession fears over the next few months. Brexit is a potential problem as evidenced by the temporary closing off of several real estate funds in the UK.

Week Ending 7/1/2016

PERFORMANCE

What a week! The market fell hard on Monday by 1.79% and then put in a blockbuster 4-day rally advancing 5.17%. For the week the SP500 (SPY) was up 3.34%, international (VXUS) advanced 4.16% and the aggregate bond index (AGG) was up 0.71%. The US dollar was flat and crude moved up by 3.12%.

While Brexit is a big deal, and while the uncertainty factor is sure to slow growth in the UK and maybe the EU, the market may have initially overreacted. At least for now, Brexit is a political not an economic event. And there was even some talk during the week that maybe the UK won’t even invoke Article 50, which would begin the withdrawal process, and give the EU time to reform itself. The EU would be wise to concentrate their union on the benefits of free trade and leave most of the other issues to traditional political negotiation.

Performance 7 1 2016

TREASURY RATES

The 10-year Treasury note touched its lowest yield ever at 1.385% on Friday before closing at 1.46%. Let us emphasize “ever”. As in since the founding of the union. Led by fears of the impact of Brexit, investors are betting on more world wide stimulus and/or a weaker economy. Negative yields around the world are dragging down US rates.

Bank of England Chief Mark Carney said on Thursday that the bank’s expectation was slower growth as consumers and businesses react to uncertainty by cutting spending. Carney indicated that the central bank would cut its key rate over the summer. The yield on the two-year British government bond fell into negative territory for the first time after the comments.

10-Year Yield History10-Year Yield History Notes

Overall treasury rates were down on the week. The curve got flatter. The difference between the 2-year and the 10-year note declined by 6 basis points. The difference between the 5-year and the 30-year declined by 10 basis points.

Treasury Rates 7 1 2016

South Korea

South Korea announced a $17b stimulus package. They join Canada in using fiscal stimulus to get their economies going. Going forward, we will probably see more of this around the world.

Economic Reports

The Richmond Fed Manufacturing Index fell to -7 in June, its lowest level since January of 2013. The Texas Services General Business Activity index fell to -7.7. The near-term outlook declined.

The Chicago PMI came in at 56.8. That is the highest level in eighteen months represents a 13+ point increase over the last six-months. According to the Bespoke Investment Group, in seven of the eight previous times the index increased by that much in that time span, the economy was coming out of recession.

Chicago PMI

Personal consumer expenditures (PCE) were up 0.4% for May. The combined increase for April and May was the biggest two-month gain since August of 2009. Personal income was up 0.2% in May.

The Philly Fed State Leading Indexes, which are six-month projections of economic activity, show that 40 states are expected to expand, seven to contract and three to remain unchanged.

Pending home sales fell for the first time in four month, dropping 3.70%.

The Weekly Retail Chain Store Sales Index rose 1.5% last week. It is now up 3% from last year.

Initial claims for unemployment insurance rose 10,000 to 268,000. The four-week average is 266,750, that is close to the lowest level since 1973. The labor market remains tight.

GDP

Q1 GDP was revised up to 1.1% from 0.8%. The original estimate was 0.5%. The actual growth is now more than double the original estimate.

GDP estimates for Q2 and Q3 continue to remain stable. The Atlanta Fed’s GDP estimate for Q2 growth is 2.6% and the NY Fed’s Nowcast came in a 2.10%, both estimates were unchanged for the week. The NY Fed’s Q3 estimate ticked up by 10 basis points to 2.20%.

GDP 7 1 2016

SUMMARY

The market reversed course on Monday and had a huge rally to close out the week. We are back to about where we started pre-Brexit. Estimated economic growth for Q2 is still projected at 2% plus, an improvement on Q1 and consistent with the slow growth mode we have been in for years.

Week Ending 6/24/2016

Performance

Brexit was the driver of the equity markets all week, it moved the market higher through Thursday and then drove the market much lower on Friday in reaction to the “exit” vote.

Friday’s losses put the market into the red for the year (excluding dividends). Excluding dividends the SPY is down 0.36%. Including dividends the SPY is up 0.67% on the year. Worldwide, about $2 trillion in market value was erased on Friday. The FTSE 100, made up of the 100 largest companies listed on the London Stock Exchange, fell 3%. However, when taking into account the massive drop in the value of the pound (about 9%), the index fell about 12% in dollar terms. The SP500 dropped 3.6%.

Friday's Performance after Brexit

For the week the US market was down about 1.64% (SPY), overseas was down 2.50%. The aggregate bond index stayed above breakeven, +0.06%, the dollar got a boost as a safe haven, +0.67% and oil fell by 0.98%.

SPY 6 24 16

Treasury rates fell about 5 basis points for 10-year bonds and less. The 30-year remained steady falling only 1 basis point.

Treasury Rates 6 24 2016

Technical Analysis

The equity markets rallied from Monday through Thursday. The market was anticipating a “remain” vote on the Brexit. What was interesting is that the close on Monday, Tuesday and Wednesday was towards the low for the day. It was as if the “smart money”, which is generally believed to trade towards the end of the day, was saying “not so fast” on the anticipated “remain” vote. But that caution was thrown to the wind on Thursday as the market shot higher by 1.30%. It looked like the market was setting up for another run at the all-time high. The market was clearly anticipating a “remain” vote but “exit” is what it got, and that set up the market for the 3.6% drop on Friday. The SPY did hold support at about $203 as it has on two recent occasions. The problem would be if the market can’t hold support, there is lots of empty space below.

SPY 6 26 2016

Brexit

On June 23, history was made when the United Kingdom voters elected to leave the European Union (EU). While free trade and regulation were on voter’s minds, limiting immigration was likely the main motivation behind the vote. The EU is a union of 28 states and includes four of the world’s seven largest economies. The UK is the world’s fifth-largest economy representing 4% of the global economy. While the result of the election had a huge impact on financial markets, it is important to remember that at least as of now, this is a political event, not a financial event. In other words, the market went down because of politics, not because of a pending immediate threat to the financial system (like a major bank going under).

The vote itself is not binding, and the splitting of the UK from the EU will likely be a long and complicated process, adding a lot of uncertainty to the process. An act of Parliament needs to be passed to give the EU formal notice of the UK’s intent to leave. Then negotiations begin on the terms of the exit. And to make matters worse, the UK Prime Minister, David Cameron, resigned after the vote and will leave office in a few months.

From an economic standpoint, the question is what happens to the trade agreements? Dropping EU membership means a possible loss of the favorable trade agreements that the EU provides. The EU is the largest trading partner for the UK, accounting for one-half of UK exports. The UK also needs to attract foreign capital to help cover its current-account deficit. That might be more difficult now.

Under two scenarios laid out by the International Monetary Fund (IMF), UK GDP will drop by 1% by 2021 (more favorable) or more than 4% (unfavorable).

But the impact on the UK is only one part of the problem. Another part is how this impacts the EU. This will affect the EU economy but it might also result in the EU itself splitting up. Other countries might be tempted to vote themselves out of the EU. Given that UK voters decided to leave mainly because of immigration policies, and because this same immigration policy is the main impetus for other countries to leave the EU, it would probably be smart for the EU to restructure itself to be primarily an economic (free trade) union, and leave everything else to traditional negotiation between countries.

A third impact is the knock-on effect on the US dollar and the Japanese yen. Both currencies are likely to increase in value, hurting exports and lowering domestic profits.

In sum, Brexit opens up a long period of uncertainty and markets do not like uncertainty. However, the world economy is not going to end, although there will probably be some short-term downside. Countries will still trade with each other and people are still going to live and buy products. Slow growth is expected to continue and the world will adjust. Even in the UK, many economists still expect growth. Deutsche Bank Chief Economist Mark Wall  is looking for UK GDP growth of 0.9% versus 2.1% had the UK remained in the EU. He see Eurozone growth of 1.1% instead of 1.5%.

Fed

Janet Yellen said the chances of a recession this year are “quite low”. A WSJ survey of economists puts the chances of a recession in the next year at 21%. Yellen noted that wages are picking up and that economic output has improved in the second quarter. Yellen indicated that rates would increase gradually and cautiously, she did not give any hint of when. She also said she was not interested in following Japan and Europe to negative interest rates.

Yellen’s comments were before the Brexit vote. Now after Brexit, the chances of a Fed rate hike, at least this year, have dropped dramatically. We are probably looking at Q2 of 2017 at the earliest.

Inflation

We wrote last week that inflation pressures are building in the system. The WSJ ran a story earlier in the week showing that the “sticky-price” CPI, items that fluctuate in price less, such as household furnishings and personal care products, rose at the highest rate since 2009. According to researchers at the Atlanta Fed, changes in “stick-price” items incorporate expectations about future inflation more so than other measures of CPI.

Sticky Price Inflation

Economy

The US Coincident Index rose 0.2% indicating continued slow growth. Existing home sales increased 1.8% in May. Single-family sales were up 1.9%. the highest level since February of 2007. Distressed sales now represent only 6% of the market, a year ago it was 10%. The Architecture Billings Index increased by 2.5 points to 53.1, another good sign for growth. ATA For-Hire Truck Tonnage increased 2.7% in May. That was the first gain in three months and was up 5.7% year over year.

GDP

The Atlanta Fed’s GDPNow estimate for Q2 declined to 2.60% from 2.80% last week. The estimate for real residential investment growth fell to 1.7% from 3.6% after the US Census Bureau released data on new home sales, prices, and construction costs. The contribution of inventory investment also declined. Both factors resulted in the lower estimate. There was no change in the Q2 and Q3 estimates for the NY Fed’s NowCast. The NowCast projects growth at 2.10% for Q2 and Q3. If you split the difference between the two forecasts for Q2, and if the estimates hold at these numbers, the growth would be 2.35% versus 0.80% in Q1, an improvement for sure.

GDP Estimates 06 24 16

SUMMARY

The uncertainty created by the “exit” vote will likely dampen economic activity worldwide at least initially. Over the medium and long run markets should adjust. Brexit was a political event not an economic one, although you can make an argument that it can turn into an economic event down the road. Interest rates were pushed lower, which will offset some of the negative impact from Brexit. And with such low rates, equities arguably remain attractive. From a technical perspective, the market is resting on a major support line. If it breaks support expect further downside in the short run.