Performance
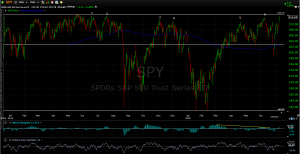
The market rocketed higher on Friday fueled by a big increase in nonfarm payrolls (see further below). The report signaled the economy continues in slow growth mode and alleviates fears that a recession is right around the corner. The SPY (SP500 ETF) was up 1.30% for the week, closing at 212.65, just shy of its all-time record of 213.50 on May 21, 2015.
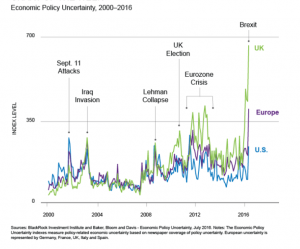
Short-term investors are faced with a huge quandary here. On the one hand, the level of uncertainty around the world, which the market never likes, is at historic highs. The US economy appears steady in slow growth mode, but around the world, especially with the possible negative impact of Brexit, there is a greater threat of recession. In addition, while the US economy is not in recession, US large caps have been in an earnings recession going on five quarters now. The US presidential election increases the uncertainty level like never before. Based on traditional metrics, equities look overvalued. On the other hand, bond yields are at all-time lows, which make equities look inexpensive (see further below). Lower bond yields encourages investment in dividend paying equities. Uncertainty and negative interest rates overseas pushes investment into the US. The SPY is $0.85 away from hitting an all-time high and if it breaks through there is the chance for a further run higher. So there are lots of reasons why the market can break higher or lower in the near term, which might explain why it has been trading in an approximate range between 200 and 212 on the SPY for most of the last several months.
Bonds were up 0.53% on the week, the US dollar rallied by 0.21% and crude fell by 7.31%.
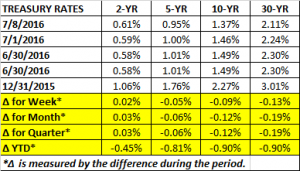
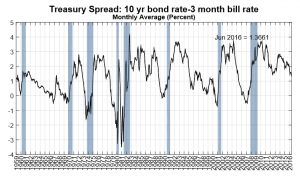
The 10-year hit another all-time low closing at 1.366%. The yield curve continued to get flatter.
Using a model of the spread between the 10-year and 3-month Treasury rates the NY Fed projects the chance of a recession in the next 12-months at 8.10%.
Technical
The market is as close as you can get to setting a new high. In six previous attempts, a failure to set a new high has led to a sell-off. In the event that the market does set a new high, a failure to hold the high, called an “upthrust” (described in our column on May 27), would signal a possible sell-off. However, the market has been trading sideways for a long-time now, and breakouts after such a long sideways trading period often indicate a pretty good move higher.
Valuation
Ben Levisohn writes in this week’s Barron’s that stocks, despite selling at a historically high P/E, look cheap on a relative basis. If you flip the price/earnings ratio of 16.7, you get an earnings yield of 5.99%. Subtract the 10-year treasury yield of 1.38% and the difference is 4.61 percentage points, close to the highest level of the last 15 years.
That spread, of course, is no guarantee that stocks are a no brainer buy here. As we have documented in this column in the past and up above, there are many arguments as to why the market is overvalued, including all of the traditional metrics such as price/earnings, price/book, etc.
Economics
Factory orders fell 1% in May. Nondurable goods were up 0.3% but durable goods were down 2.3%. Year over year, factory orders were down 2.5%. Light vehicle sales dropped 4.5% in June, year over year, they are down 2.0%. The ISM New York Current Conditions Index was up 8.2 points to 45.4 for June.
Employment
Nonfarm payroll jumped by a giant 287k in June, an eight-month high. That offset the weak May report which was revised lower to 11k. Jobless claims dropped by 16k last week to 254k. That was the fewest since mid-April and close to historic lows. Average hourly earnings were up 2.6% year over year, the fastest rate of increase in seven years. Taken all together, it looks like the low May nonfarm payroll report was a one-off and the labor market continues to be tight in the US. The unemployment rate increased to 4.9% from 4.7%, and back to where it was in January. The increase was mainly due to more people entering the job market.
Global PMI
Global PMI remained the same at 51.1 in June, indicating slight expansion. Most of the survey was done pre-Brexit. Manufacturing rose to 50.4 and services fell 0.1 to 51.3. During previous recessions, PMI has been less than 50. However, with uncertainty courtesy of Brexit and the US election, we are still on a global recession watch. The Eurozone composite was at 53.1. The US measured 51.2. Japan was at 49. Russia increased to 53.4.
Brexit
Multiple British real estate asset managers put a temporary halt on investors taking money out of their funds. The British real estate market has been booming, but investors are worried that will go quickly into reverse. Many of the investors are foreigners, so declining real estate values doubled with the pummeling of the British pound could lead to a “run” on the funds. Contagion could lead to other sectors.
GDP
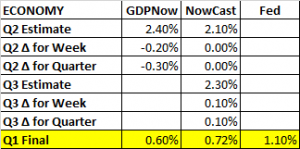
The Atlanta Fed’s GDPNow forecast for Q2 growth fell to 2.4% from 2.6% last week. The drop was due to a cut in second-quarter real consumer spending growth due to slower light vehicle sales. The forecast of the contribution of net exports also fell. The NY Fed’s Nowcast forecasts Q2 growth at 2.1%, unchanged on the week. Q3 estimated growth ticked up to 2.3% from 2.2%.
SUMMARY
The market is right there, knocking on the door of setting a new high. It has failed in six previous attempts, each of which led to a sell-off. The US economy continues in slow growth mode and solid payroll reports reduced recession fears over the next few months. Brexit is a potential problem as evidenced by the temporary closing off of several real estate funds in the UK.

