PERFORMANCE
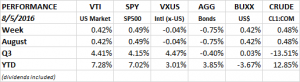
The overall US market as measured by the VTI was up 0.42% for the week. International markets were flat. Bonds declined as interest rates increased. The USD and crude were both up.
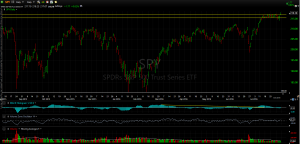
Equity markets got a big lift with another strong jobs report (see below). The SPY (SP500 ETF), which had been trading in a tight range between 215.60 and 217.35 since mid-July, attempted to push lower between Tuesday and Thursday. On Tuesday, the SPY closed 5 cents below that range, but on Wednesday and Thursday the bears could not follow through, and the market closed within its recent range. On Friday, the strong jobs number helped the market break higher, closing at 218.18.
ECONOMICS
Nonfarm payroll increased by 255k, making it two straight months of solid gains. The 255k was above the consensus estimate of 179k. The average work week increased by 0.1 hours to 34.5 and average hourly earnings increased by 0.3%. It was a strong report and the Fed may have a hard time ignoring it when deciding on whether to increase rates or not. The numbers are not consistent with recent GDP data which showed growth of only 1% growth during the first half of the year. The Fed will have to figure out which data point better reflects economic reality.
ISM Non-Manufacturing fell to 55.5 from 56.5 in July indicating growth is continuing albeit at a somewhat slower pace than last month. The Markit US Services PMI flash reading rose by 1/2 point to 51.4, showing slight growth. Light vehicle sales had their best month since March of 2014, up 6.4% in July.
The Bank of England dropped its lending rate to 0.25%. That marks an all-time low in the Bank’s 322-year history. The Bank will also start buying corporate debt, all in an effort to counter Brexit.
GDP
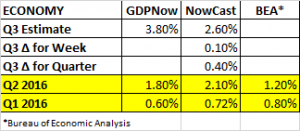
The Atlanta Fed’s GDPNow came out with their initial reading for Q3. The estimate came in at a whopping 3.80%. We have a long way to go until we get final Q3 numbers, but a growth rate of 3.80% would be way above trend and a huge positive for the economy. The NY Fed’s Nowcast estimate for Q3 was a more modest 2.60%.
EARNINGS
Earnings have been coming in better than forecast. On June 30th, the estimated earnings decline for Q2 was -5.50%. Currently, the blended earnings decline is coming in at -3.5% (according to FactSet). 86% of SP500 companies have now reported, 69% beat earnings estimates and 54% beat sales estimates.
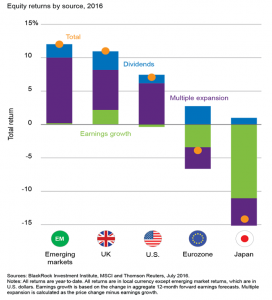
At some point earnings (green below) will need to turn around and start moving up. The driver of most equity returns this year has been multiple expansion (purple below) with some help from dividends (blue below).
THE LACK OF ECONOMIC GROWTH
Increased Regulation
The WSJ reports that the Obama administration has just enacted their 600th major regulation rule, defined as a rule imposing costs of more than $100 million. The Bush administration wasn’t much better, they imposed 496 such rules. The American Action Forum calculates the total cost of these rules at $743 billion. If there has been one theme dating back decades it has been the growth of regulation in the US. If you are wondering why we have seen such lackluster growth since the 2008 recession, regulation might be a good place to start.
Demographics
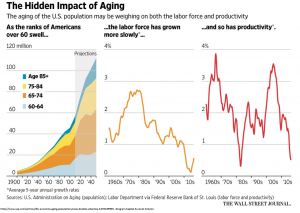
Demographics might be another reason growth is in slow motion. Nicole Maestas of Harvard University and David Powell of the Rand Corp. have published a paper showing that employees leaving the workforce to retire has a negative impact on productivity which harms the entire economy. The authors analyzed the impact of aging on the different states in the US and concluded that for every rise of 10% in the share of a state’s population over the age of 60, growth in per-capita GDP was cut by 5.5%. A smaller labor force and the loss of experienced employees (impacting productivity) were the main drivers in the cut in growth. A possible solution would be to encourage people to retire later, not earlier.
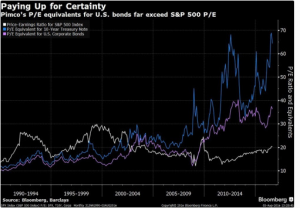
VALUATION
Here is another view on valuation. Geraldine Sundstrom of Pimco compares how “certainty” and “uncertainty” are priced. The blue line shows 10-year US treasuries, which now trade at about 65x earnings. Corporate credit, trades at about 35x, and the SP500 trades at 20x. Sundstrom writes that “[corporate] credit is likely to remain attractive, while the jury is still out on equities.” She thinks inflation expectations need to normalize and earnings need to recover to support equities, US treasuries remain an important diversifier, but that comes at an expensive price.