HIGHLIGHTS
- US stocks fall slightly.
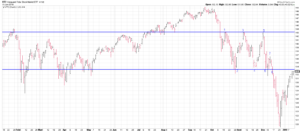
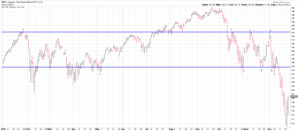
- The S&P is up by 13.34% since the December 24th low.
- The government reopens for at least three weeks.
- Tax proposals by the Democratic left.
- More chaos in Venezuela.
- The LEI declines.
- Jobless claims hit the lowest level since 1969.
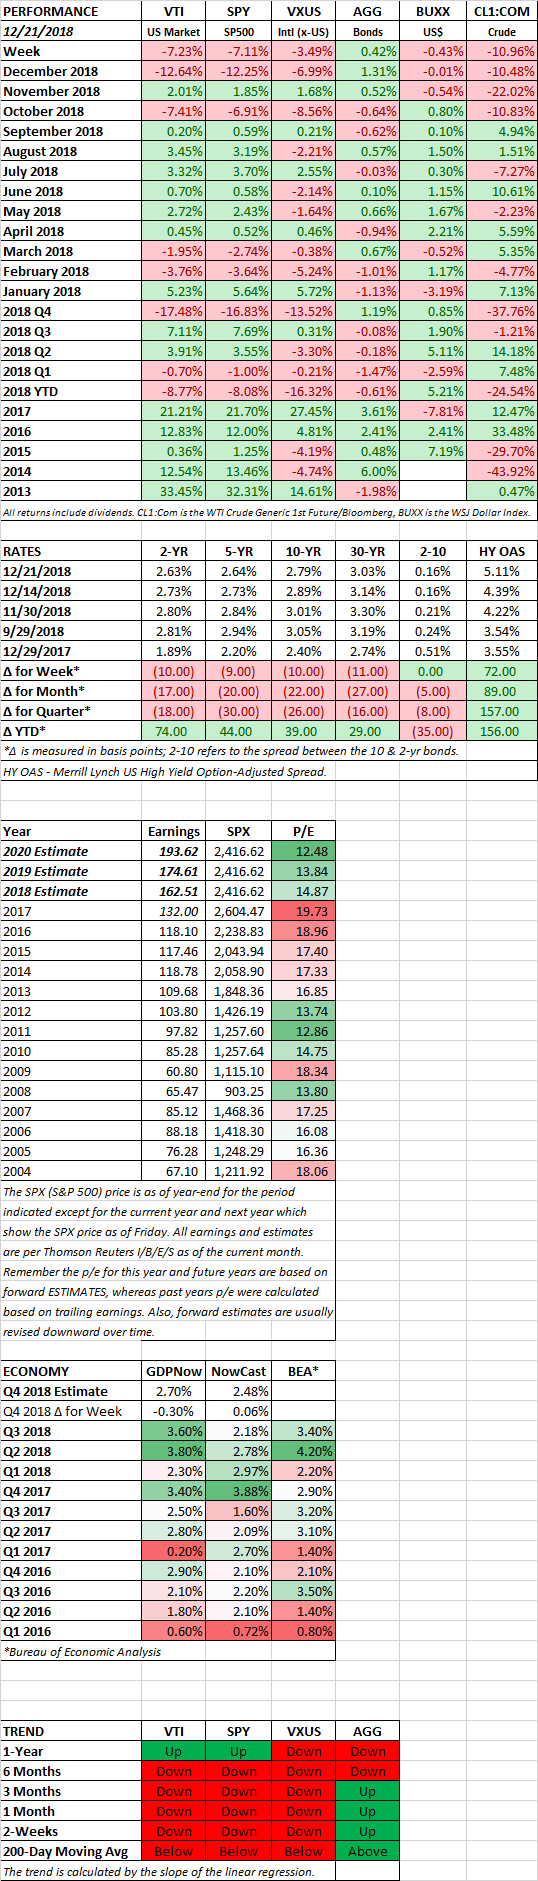
MARKET RECAP
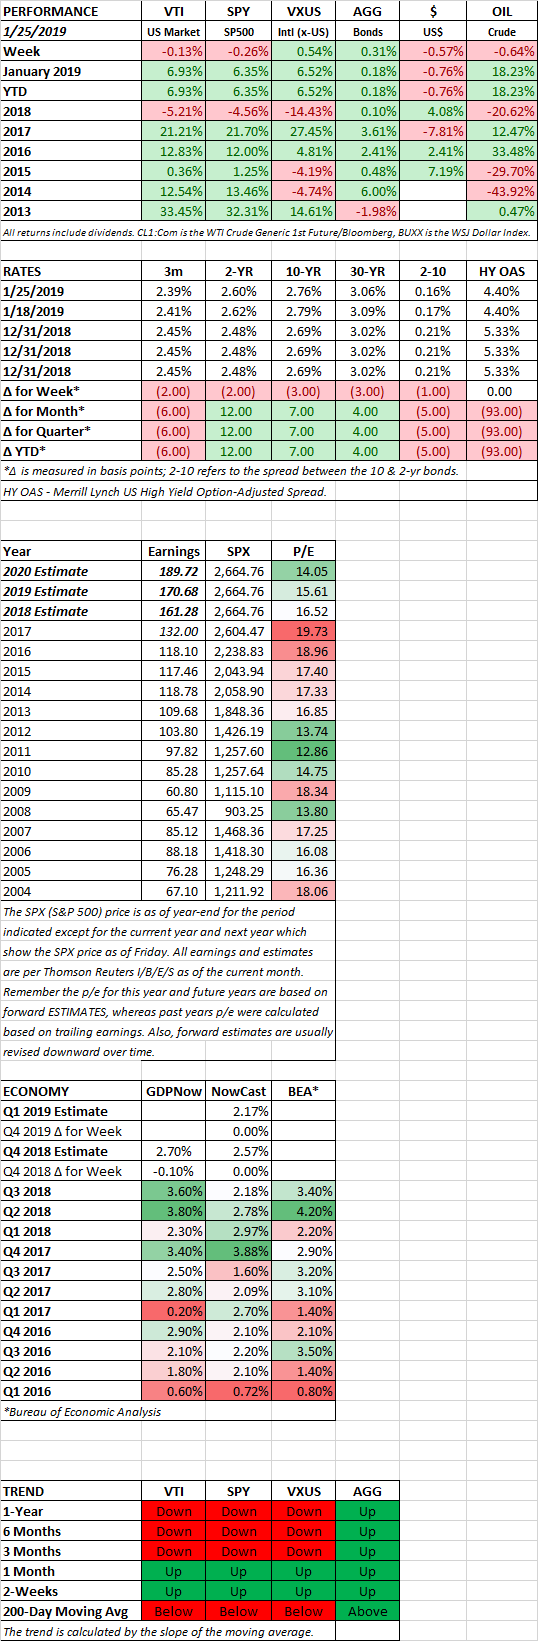
US stocks fell slightly, down 0.13%, while international equities were up by 0.54%. Bonds advanced by 0.31%.
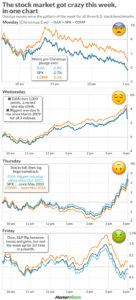
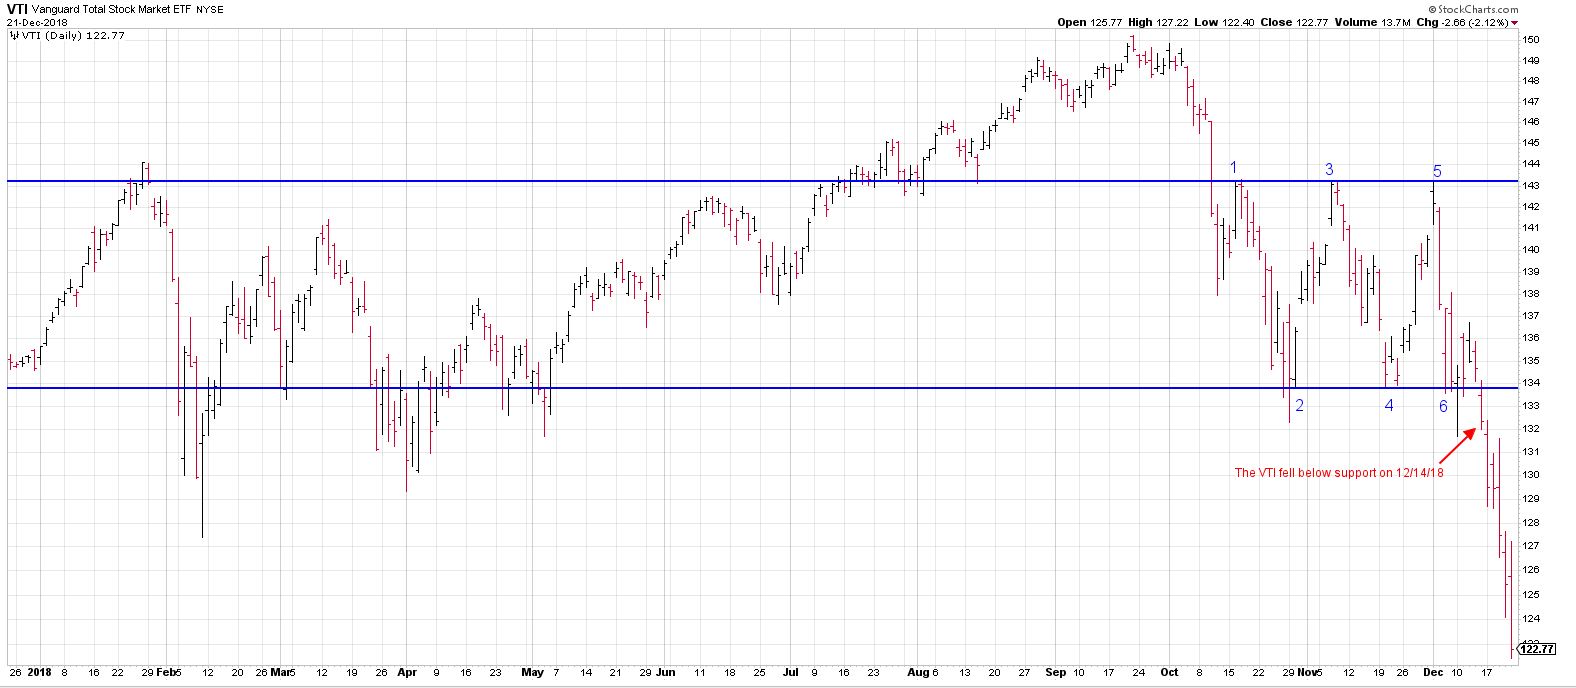
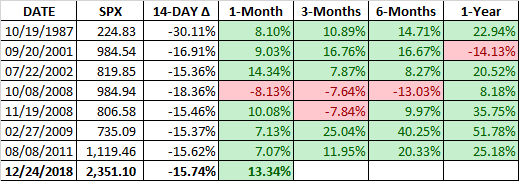
ONE MONTH LATER
It has been one month since the market low on December 24th. At that point, the S&P 500 had fallen by over 15% during a 14-day period. A descent of 15% or more over a 14-day period had happened 7 other times since 1970. In all but one of those cases, the market had a nice rally in the subsequent one-month period. In this instance, the S&P finished up by 13.34%, which ranks second on the list.
GOVERNMENT REOPENED
The government shutdown ended as Trump and congressional leaders reached a deal to reopen the government for three weeks. Trump did not get any of the funding for the wall that he demanded.
TAX PROPOSALS…
In recent weeks proposals for tax increases from the far left of the Democratic party have been picking up steam. First, Alexandria Ocasio-Cortez (AOC) put a 70% marginal tax rate on the table and now Elizabeth Warren has come out in favor of a wealth tax. 70% marginal rates were the standard in the 60s and 70s. Of course, the tax code was taken advantage via loopholes and tax shelters to make sure that essentially no one came close to paying that. The entire idea behind lowering rates in the Reagan era (80s) was to simplify the tax code and take away incentives that did not make economic sense. That set off a long period of positive growth. But if anyone thinks the 70s are the economic period to emulate they need to look again. That is not to say we don’t need some tax increases and tax reform. We do. But ideas like a wealth tax are what one might expect from countries like Venezuela…
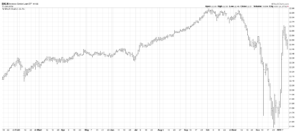
VENEZUELA
Speaking of, Venezuela continues to spiral out of control. The opposition leader, Juan Guaido, declared himself president. The military said it still supports current president, Nicolas Maduro. Street protests demanding Maduro’s resignation are constant and nationwide. Years of hardcore socialism from Chavez and Maduro have turned the country into a complete, economic and social disaster.
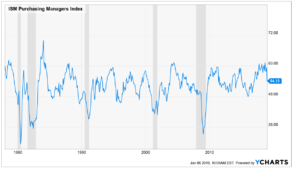
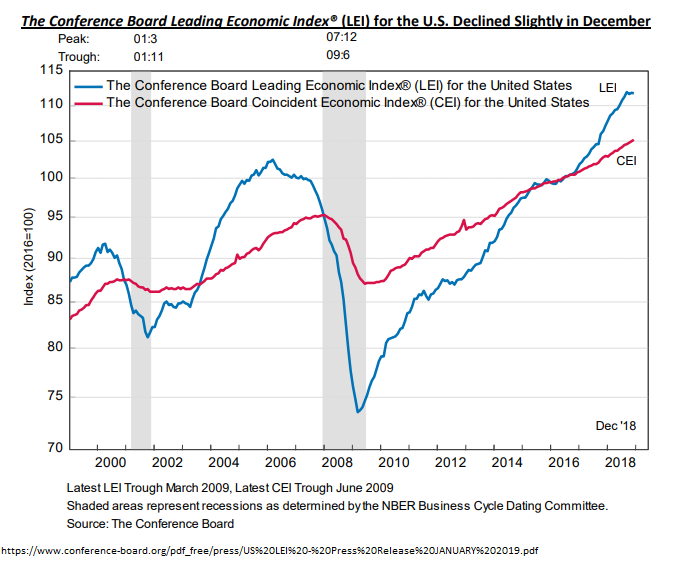
LEI
The Conference Board Leading Economic Index fell by 0.1% to 111.7 in December. “The US LEI declined slightly in December and the recent moderation in the LEI suggests that the US economic growth rate may slow down this year,” said Ataman Ozyildirim, Director of Economic Research at The Conference Board. “While the effects of the government shutdown are not yet reflected here, the LEI suggests that the economy could decelerate towards 2 percent growth by the end of 2019.”
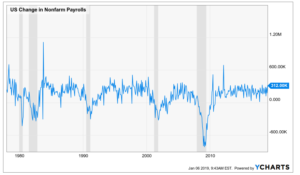
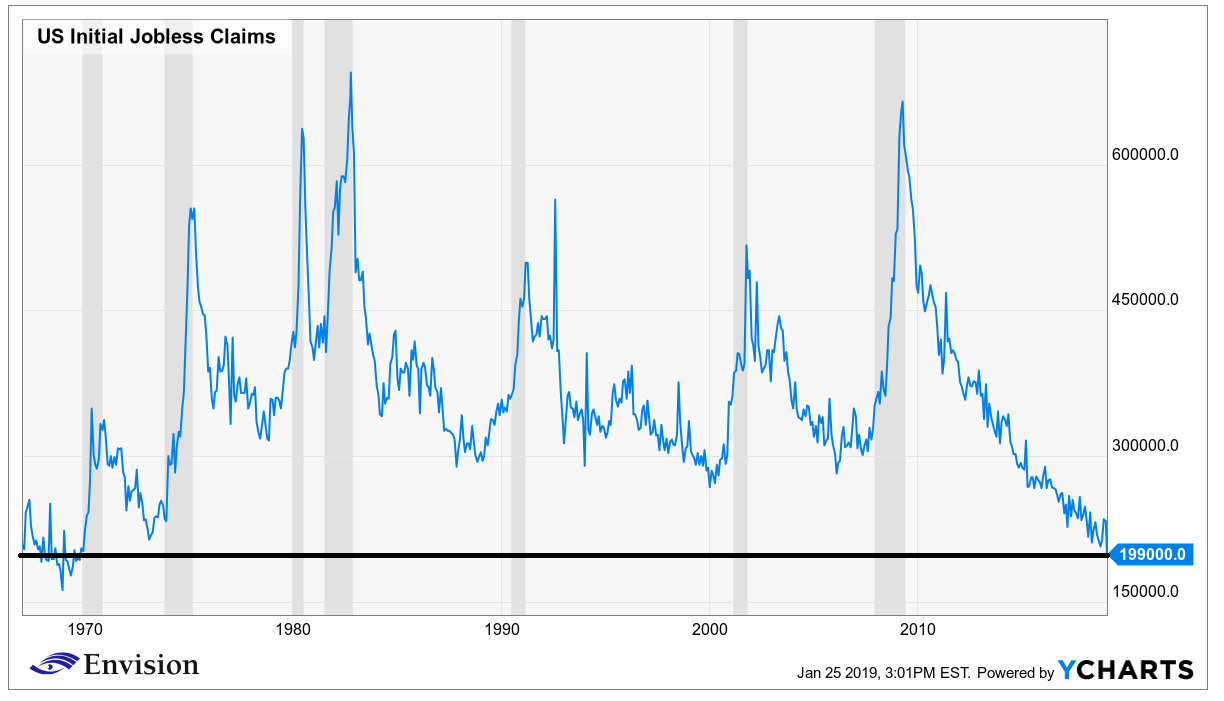
JOBLESS CLAIMS
Incredibly, initial claims for unemployment insurance dropped 13,000 last week to 199,000, the lowest level since November 1969. The previous week was revised down by 1,000 to 212,000 claims. The four-week average of claims fell 5,500 to 215,000, also near its lowest level since 1969, as labor market conditions remained tight.
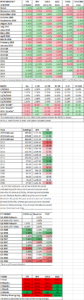
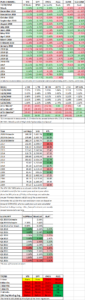
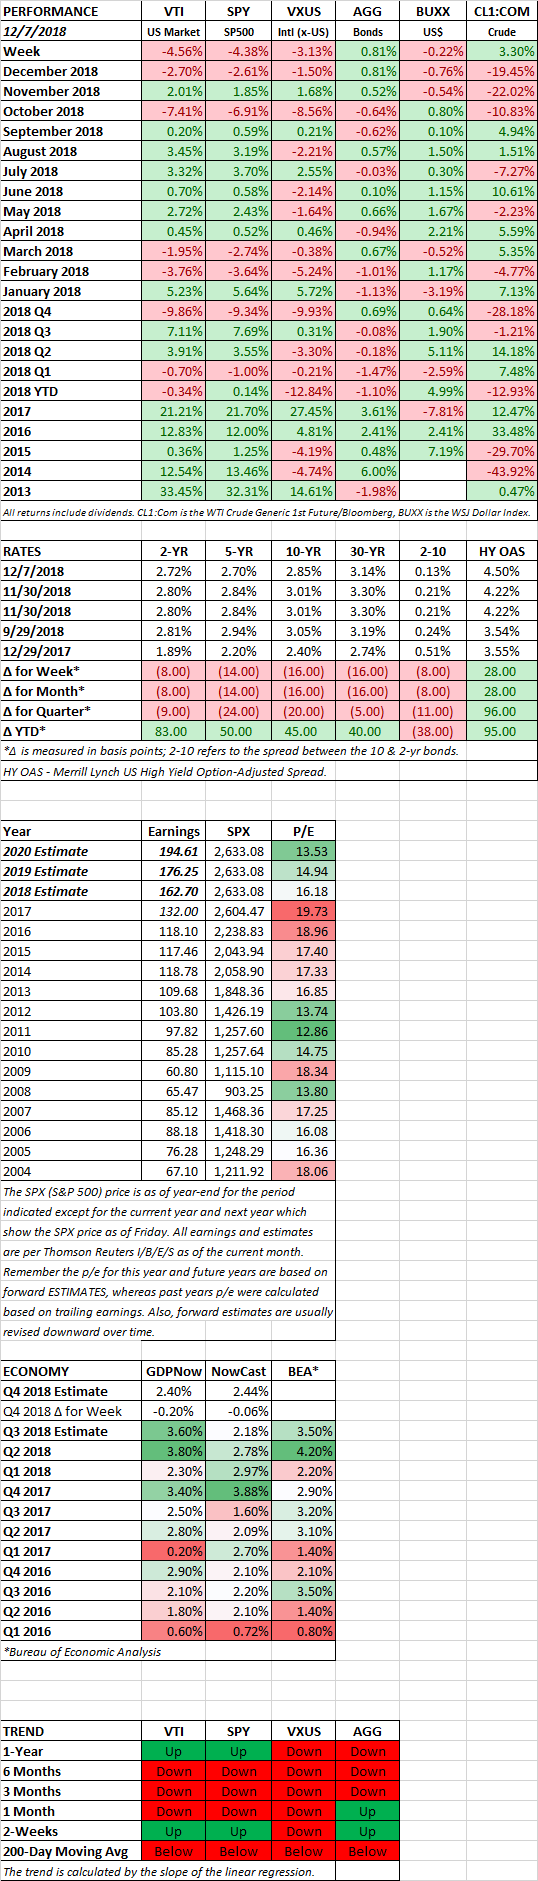
SCOREBOARD
Past performance does not guarantee future results.
The purpose of this commentary is to provide readers with a summary of recent market and economic news. It is not intended to provide trading advice. Investors should have a long-term plan and should consider working with a professional investment advisor. Any discussion of investments and investment strategies represents the presenter’s views as of the date created and are subject to change without notice. The opinions expressed are for general information only and are not intended to provide specific advice or recommendations for any individual. The information and opinions contained in this material are derived from sources believed to be reliable, but they are not necessarily all inclusive and are not guaranteed as to accuracy. Any forecasts may not prove to be correct. Economic predictions are based on estimates and are subject to change. Reliance upon information in this material is at the sole discretion of the reader.