Week Ending 11/30/2018

HIGHLIGHTS

  • Stocks explode higher on dovish comments by Powell.
  • Trump and Xi to meet on Saturday, with hopes that a deal can be made.
  • Initial jobless claims hit a six-month high.
  • GM announces job cuts.
  • Economic Surprise Index has fallen to a six-month low.
  • 2019 earnings projections have declined for seven straight weeks.

MARKET RECAP

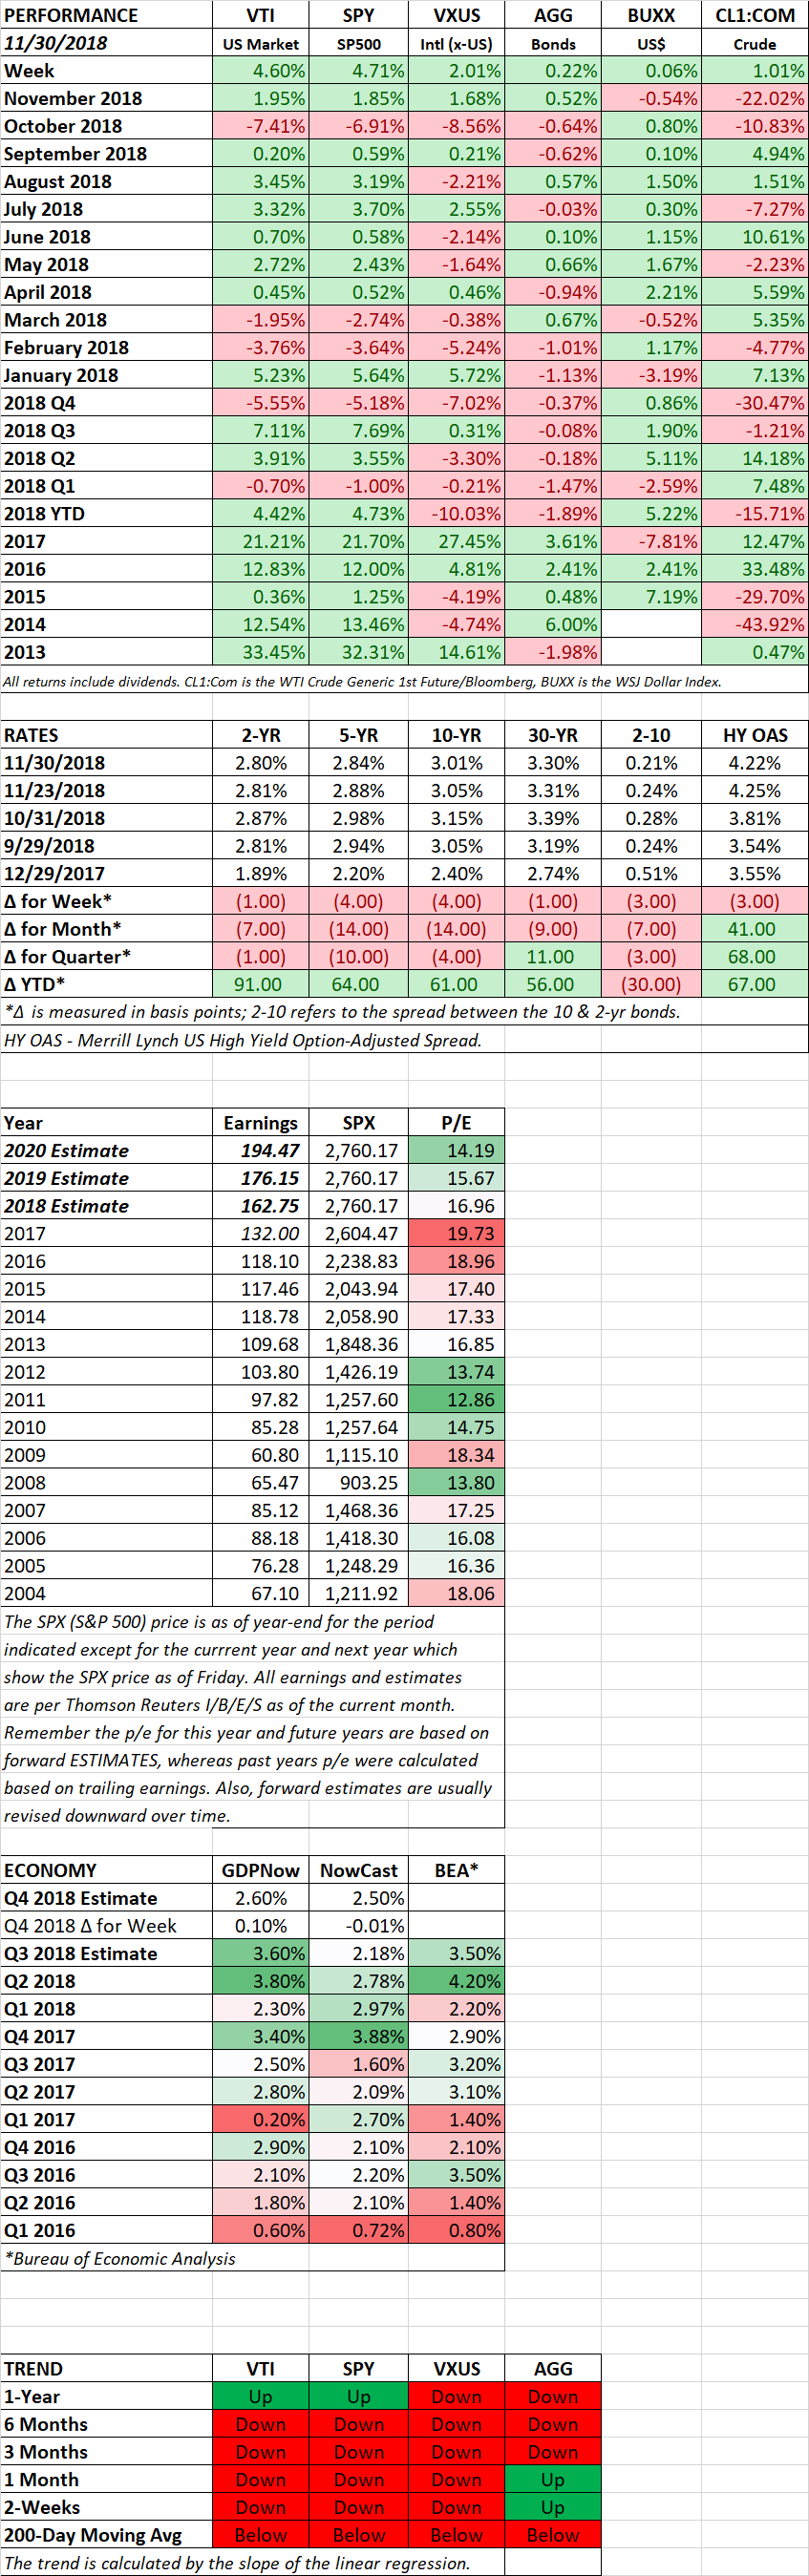
The market exploded higher, US stocks surged by 4.60% and international stocks were up 2.01%. It was the best week in seven years. Stocks were helped by comments from Fed Chair Jerome Powell, and hope that President Trump and Chinese Leader Xi will reach a deal of some sort to forestall the next set of scheduled tariff rate increases. With the rally, equities were up by 1.95% for November and are now up 4.42% for the year.

Back in October, Fed Chair Jerome Powell set a hawkish tone when he said that the Fed was “a long way from neutral.” That set the perception that the Fed was dead set on a series of interest rate increases every quarter.

On Wednesday, Powell, speaking at the Economic Club of New York, shifted to a more dovish position, stating that interest rates are just “below neutral” and that there “is no preset policy path” regarding future interest rate increases. Powell went on to say that the Fed’s decisions would be based on economic data. That is just what the market wanted to hear, and equities burst higher, closing up by 2.3% on the day.

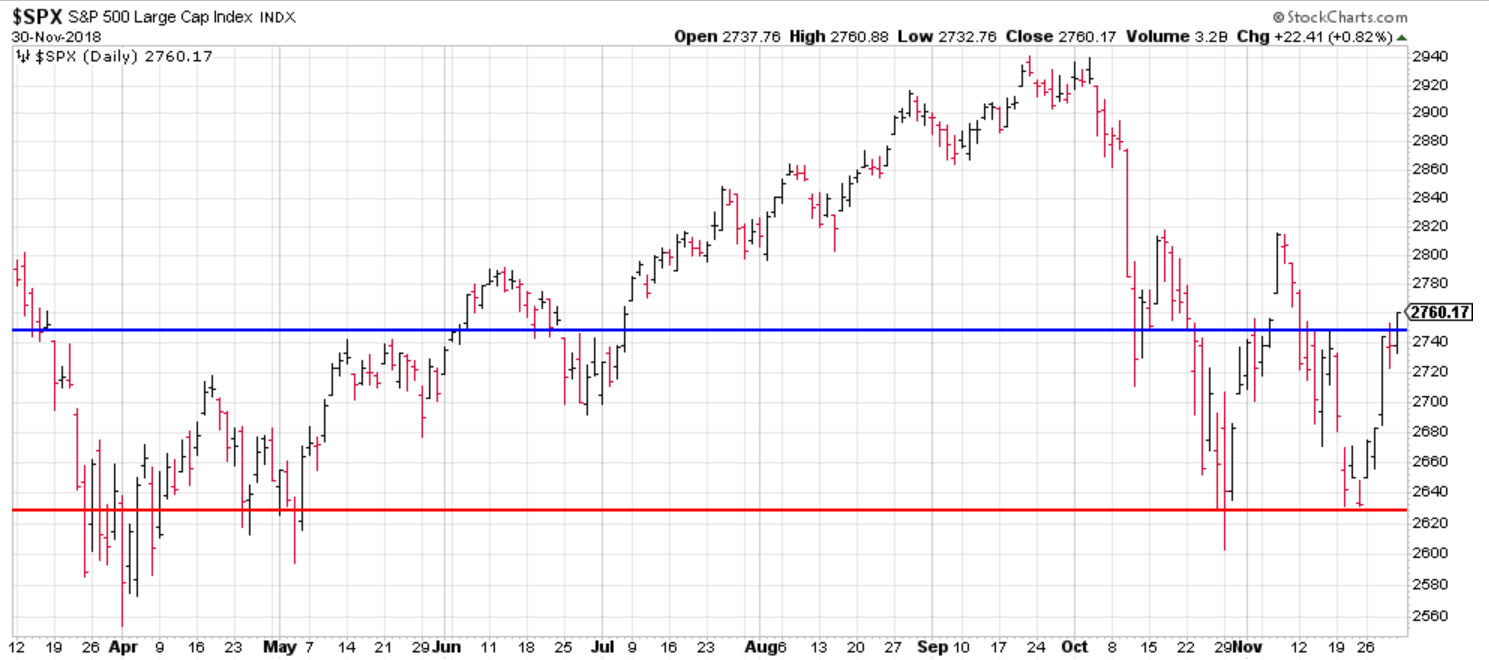
The rally was also good for the market from a technical perspective. Stocks did not put in a lower low (see the red line below) and broke through the high from the two-day rally a couple of weeks back (see the blue line). However, we would not give the all clear yet, there is still economic data out there that is mixed at best.
JOBLESS CLAIMS HIT A SIX-MONTH HIGH

It is too early to say this is the start of a trend, but, initial jobless claims came in at 234,000 this week, the highest reading in six months. Over the past several years, whenever there was a hint of a slowing economy, the fallback was that the labor market was extremely tight and that jobless claims were ridiculously low. At 234k, jobless claims are still very low historically, but the number does represent a recent high in initial unemployment claims.

GM ANNOUNCES JOB CUTS

GM announced that it will cut up to 14,800 North American jobs due to weak sedan sales. This is the first set of large job cuts since the last recession for the company. GM CEO Mary Barra said she wanted to take action ahead of the next downturn, “The industry is changing very rapidly. We think it’s appropriate to get in front of it while the business and the economy are strong.”

President Trump was not happy. He threatened to take away electric-vehicle and other subsidies that benefit GM. Those subsidies shouldn’t be there in the first place but that is another issue. Trump is of the belief that GM has an obligation not to cut jobs due to the government’s help in saving the company during the last recession. While heartbreaking, Barra is making these moves to keep the company financially secure so that they won’t have a repeat of a near-death experience the next time the auto industry falls into a major slowdown.

SURPRISE INDEX

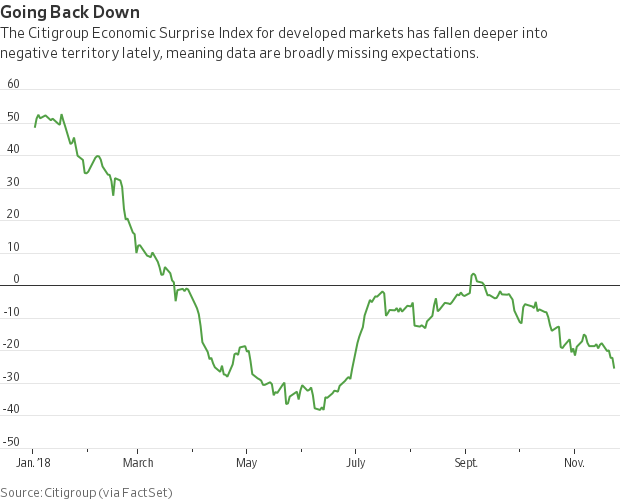
The Citigroup Economic Surprise Index for developed markets has now fallen to a six-month low. The Index measures whether economic statistics are meeting the consensus projections. The index has been falling consistently since September.
EARNING PROJECTIONS

Stocks are selling at a reasonable valuation based on forward-looking earnings. The S&P 500 is priced at 15.67 projected 2019 earnings. The problem is that earnings projections for 2019 have now been revised lower for seven consecutive weeks. Per Refinitiv, earnings for 2019 are now projected at $176.15, down 1.53% from the high on September 7 of $178.90.

SCOREBOARD
Week Ending 11/23/2018

HIGHLIGHTS

  • Stocks take another hit.
  • High-yield spreads are opening up, while treasury yields fall.
  • The consensus is changing on interest rate hikes for 2019
  • Oil is pummeled.
  • Trump and Xi to meet.

MARKET RECAP

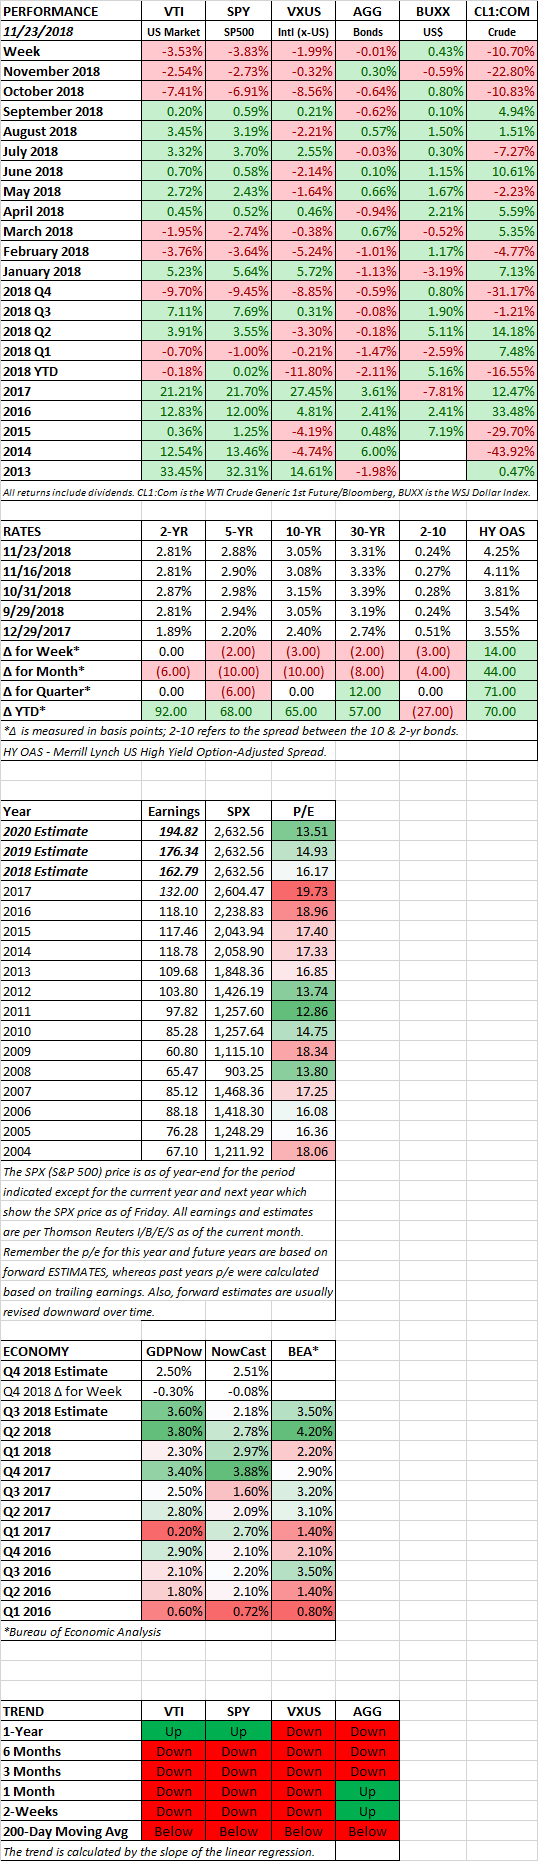
US equities were hit hard, falling by 3.53%. The S&P 500 was off by 3.83%. International stocks continued their recent relative out performance but still fell by 1.99%. US stocks are about 1.5% away from dropping through the low hit on October 29th. Equities will have to hold that level to put in the beginning of at least a consolidation process.

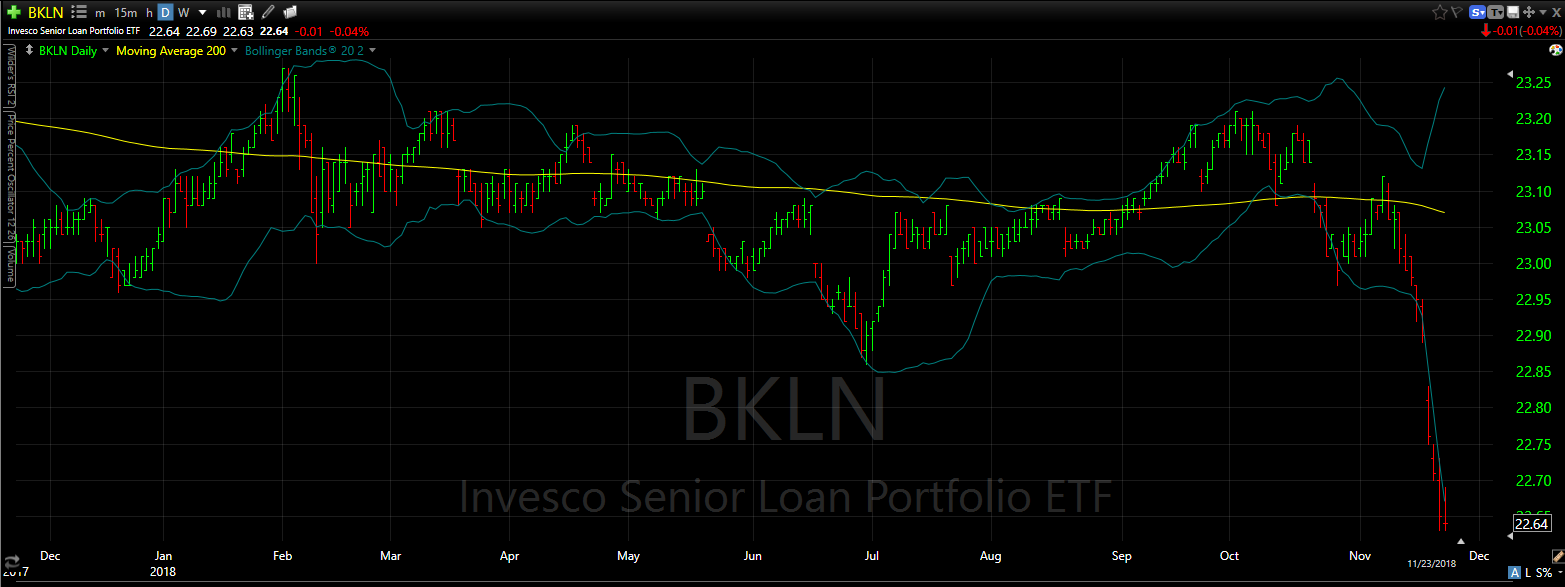
While yields on Treasury bonds were generally down a couple of basis points, the spread on high yield bonds continued to increase. The 10-year treasury yield is down by 10 basis points this month, but the high yield spread is up by 44 basis points. That indicates investors are backing away from debt most susceptible to a slowing economy. Bank loans and floating rate instruments have taken the brunt of the hit, a chart of the Invesco Senior Loan Portfolio (BKLN) is indicative of the damage.

FED

The consensus is rapidly shifting that the Fed will have to back off its aggressive posture of three rate hikes in 2019. The futures market has priced in just one rate increase in 2019. That would be in addition to the projected December rate hike. It looks like projected GDP growth is slowing. Both the GDPNow and the NY Fed Nowcast model have Q4 growth at about 2.5%, down from 3.5% last quarter and 4.2% in Q2.

OIL

Oil was pummeled. WTI crude dropped by 10.7% for the week and is now down 22.8% for the month and is down by 34% from its October 3 peak.

TRUMP and XI

President Trump and Chinese leader Xi will meet in Buenos Aires this week. Trump said he very prepared for his meeting, “I know every ingredient, every stat. I know it better than everybody knows it. My gut is always right…China wants to make a deal. If we can make a deal, we will.” The Chinese currency (yuan) is hanging on by a thread, without a deal, the threat rises of the yuan falling through an important psychological barrier, resulting in possible contagion throughout global markets. The selloff in January of 2016 was driven in part by fears of a falling yuan.

SCOREBOARD

Week Ending 11/16/2018

HIGHLIGHTS

  • US stocks fall by about 1.5% and international stocks are about flat.
  • The out-of-control US deficit gets off to a terrible start in October.
  • Some speculation that Fed might slow up on increases next year.
  • Record amounts of Baa rated debt could be a trouble spot in an economic slowdown.
  • Some weak economic numbers from Germany and Japan.

MARKET RECAP

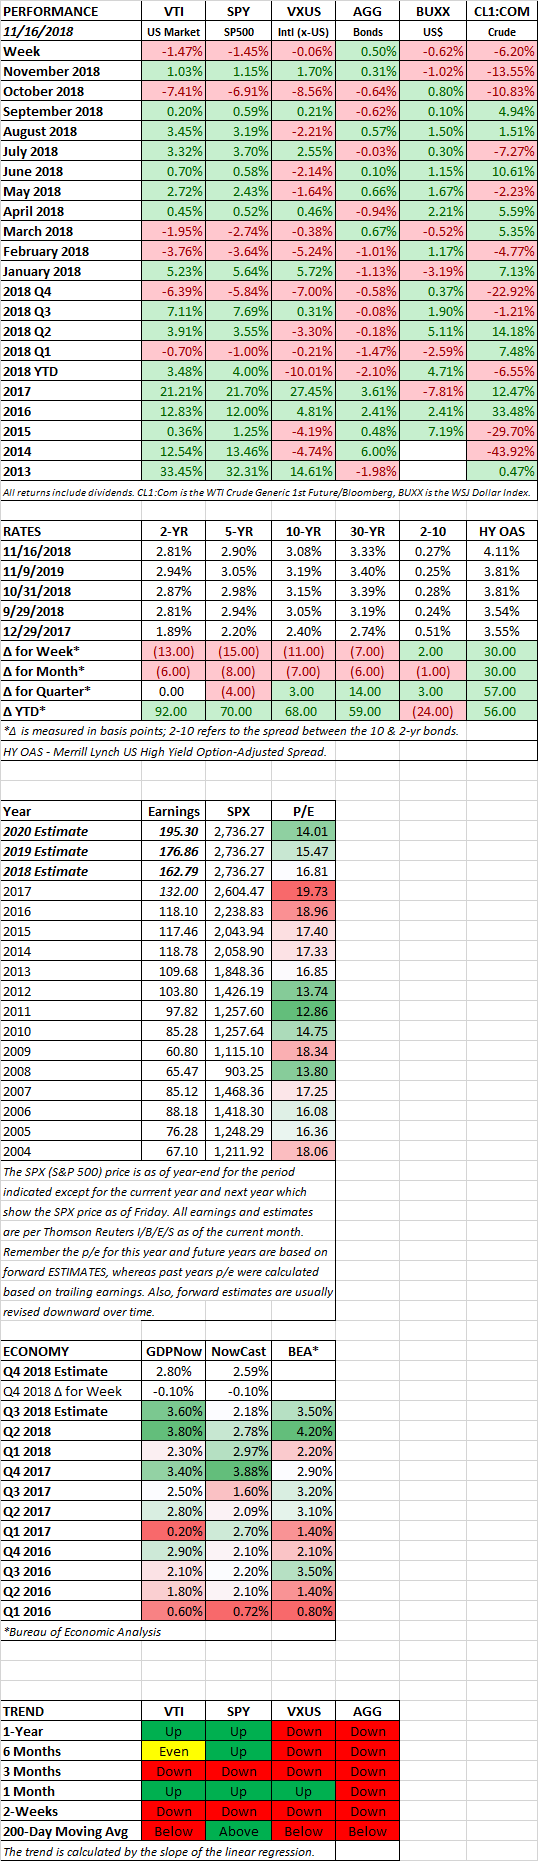
US stocks fell by just under 1.5% for the week, while international equities continued their recent outperformance, down by just 0.06%. Treasury rates fell along the curve, but high yield spreads expanded. While the 10-year treasury dropped by 11 basis points, the high yield option-adjusted spread increased by 30 basis points, an indication that some fear is creeping into the credit markets.

Stocks were down the first three days of the week. On Thursday and Friday, the market rallied on hopes that the Fed will start to get the message that maybe they should take a more gradual approach to interest rate increases. Also, Trump said on Friday that China wanted a trade deal and that maybe an additional hike in tariffs is not needed.

US DEFICIT

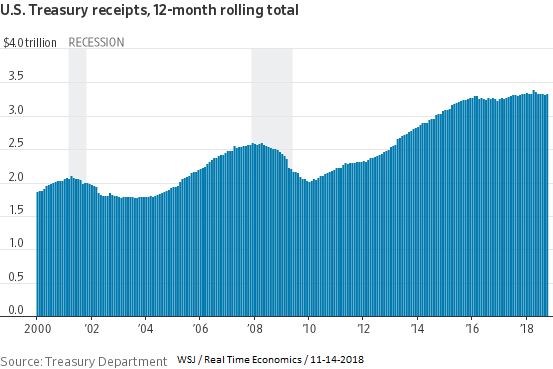
The 2019 fiscal year for the Federal government got off to a terrible start in October (the first month) as the budget deficit widened to $100 billion in October. That is up from $63 billion the prior year. A massive increase that continues to be ignored but just about every politician in Washington. Federal outlays increased by 18% because of higher spending on Medicare, defense and interest. Receipts were up by 7%. The bad part is that unless this problem is dealt with, it is only getting worse from here due to increasing entitlement spending, more and more interest expense and lost revenue from the tax cuts. The idea behind the tax cuts is that greater growth would eventually lead to a net increase in revenues. That has yet to happen.

The Congressional budget office estimates the deficit will hit $1 trillion this year.

INTEREST RATES

The conventional wisdom is that the Fed will continue to increase interest rates from here over the next year. But that might be wrong. While a December increase appears to be in the cards, the Fed can signal at the December meeting that it might consider a more gradual pace to future increases given economic weakness abroad and lower commodity prices. John Lonski, Chief Economist at Moody’s Capital Research, writes that industrial metals are down by 11% year over year, and that historically, such a drop in prices has often led to a lower 10-year treasury yield. If the Fed were to persist with increases at the same time that the 10-year yield is falling, that could lead to an inversion of the yield curve, a situation they might want to avoid.

RECORD Baa Debt

There is a record amount of debt rated Baa, just above investment grade. As of Q3, there was a record high of $2.83 trillion, which exceeded the amount of single-A corporate credit. This is not usually the case, as shown below, prior to the recession in 2001 and 2008 single-A debt was greater than the amount of Baa’s. If the economy begins to falter, a good amount of the Baa’s might drop into high-yield (junk) status, that could increase interest rates in the high-yield market, leading to more problems as the weakest companies must deal with higher interest expense and refinancing issues.

WRONG TURN

The global economy took a wrong turn as Japan and Germany reported GDP that contracted in Q3. Germany dropped by 0.8% and Japan was down by 1.2%. German economists said that temporary factors caused the drop. Japan blamed the fall on a typhoon and an earthquake.  Overall, the Eurozone managed a small increase of 0.7%, the lowest reading since 2013. In comparison, China was up by 6.5% and the US by 3.5%.

But all is not well in China. China reported slower consumer spending in October. Retail sales were up by 8.6%. That would be a monstrous gain in the US, but for China, that was the slowest increase in five months.

SCOREBOARD

Week Ending 11/9/2018

HIGHLIGHTS

  • Stocks are up for the second week in a row.
  • As expected, the Democrats take control of the House and Republicans maintain control of the Senate.
  • 2019 earnings estimates have been falling the last few weeks.
  • Q4 growth estimates are in line with last year at this time but down from the two most recent quarters.
  • Tariffs threaten the economy.

MARKET RECAP

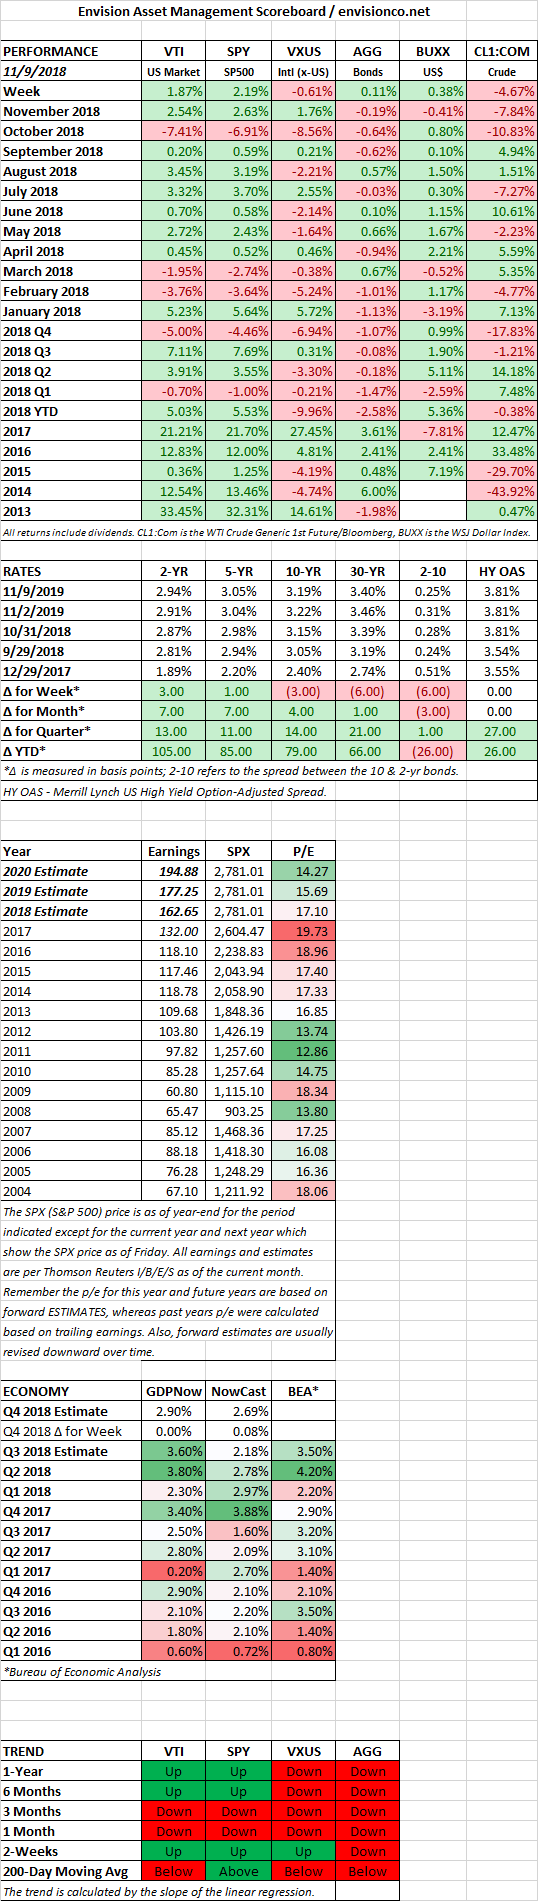
Stocks made it back to back winning weeks, helped by a post-election rally that pushed US equities up by 2.04% on Wednesday. For the week, the US advanced by 2.79% and international stocks were up by 3.88%. Bonds were down by 0.58%. The spread between the 2 and the 10-year treasury notes widened to 31 basis points as the 10-year moved up to 3.22%.

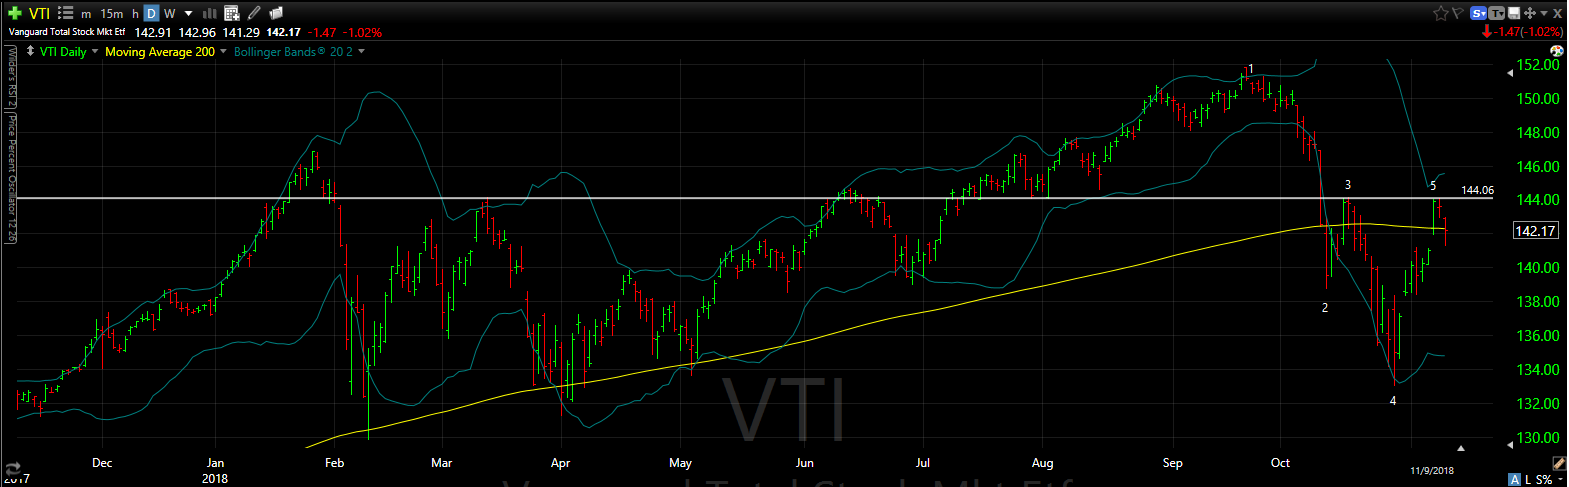
From a technical perspective (see the chart of the VTI below), in the fight to regain positive momentum, stocks broke above the 200-day moving average on Wednesday, and held above it on Thursday, but closed on Friday just below the 200-day average by the smallest of margins (11 cents). However, on a chart of the S&P 500, the closing price was slightly above its 200-day moving average. But in both cases, the rally stalled out right at the high of the October 15th (see the white line).

MIDTERM ELECTIONS

The elections turned out as predicted with the Democrats adding over 30 seats to take control of the House and the Republicans improved their numbers in the Senate. The market took a divided Congress as a positive sign for the markets on the theory that gridlock is good.

EARNINGS

Right now the S&P 500 is selling at 15.7x estimated 2019 earnings, a reasonable valuation if those estimates can hold. Earnings for 2019 are expected to be $177.25 according to Thomson Reuters, up from $162.65 this year. That would be a solid increase of about 9%. But for the last month, the 2019 estimates have been falling week by week, and for the first time, the 2019 estimates are less than they were one-quarter (13-weeks) ago. They are only off by 0.74% during that period, but it is a trend worth watching.

ECONOMY

The Atlanta Fed’s GDPNow model is forecasting Q3 growth at 2.9%. The NY Fed’s Nowcast has growth at 2.69%. Those numbers would be roughly in line with Q4 of 2017 and down from Q2 and Q3. The composite reading of the Institute for Supply Management (ISM) came in at 60.3, down from 61.6. That is a very high reading and it was the first time in the history of the report, which dates back to 1997, that the reading was above 60 for two consecutive months.

Tariffs are a threat to the economy. A paper titled “Macroeconomic Consequences of Tariffs” and written by Davide Furceri, Swarnali Hannan, Jonathan Osry and Andrew Rose, released last month, reviewed the impact of tariffs from 1963 and 2014. The authors write “We find that tariff increases lead, in the medium term, to economically and statistically significant declines in domestic output and productivity. Tariff increases also result in more unemployment, higher inequality, and real exchange rate appreciation, but only small effects on the trade balance.” Let’s hope the President reads this paper.

SCOREBOARD

Week Ending 11/2/2018

HIGHLIGHTS

  • Stocks are up in the US and around the world.
  • Bonds fall.
  • There is still technical damage on the charts.
  • Trump hints of good news on the trade front with China.
  • A solid payroll report.
  • A year after the midterms returns have usually been positive.

MARKET RECAP

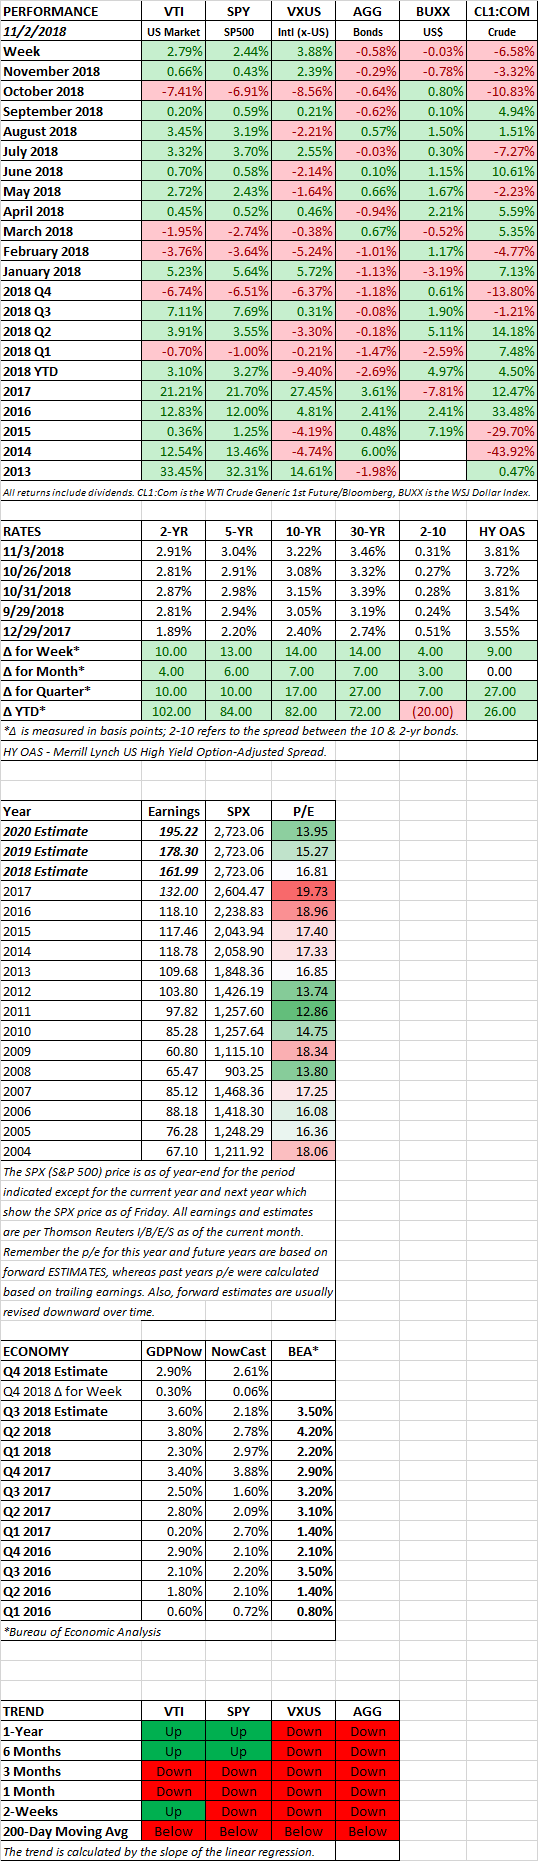
Stocks closed out October and started November with a positive week, advancing by 2.8% in the US and 3.9% outside the US. Bonds fell by 0.6% as a solid payroll report increased the chances of higher interest rates down the road. Crude fell by 6.6%.

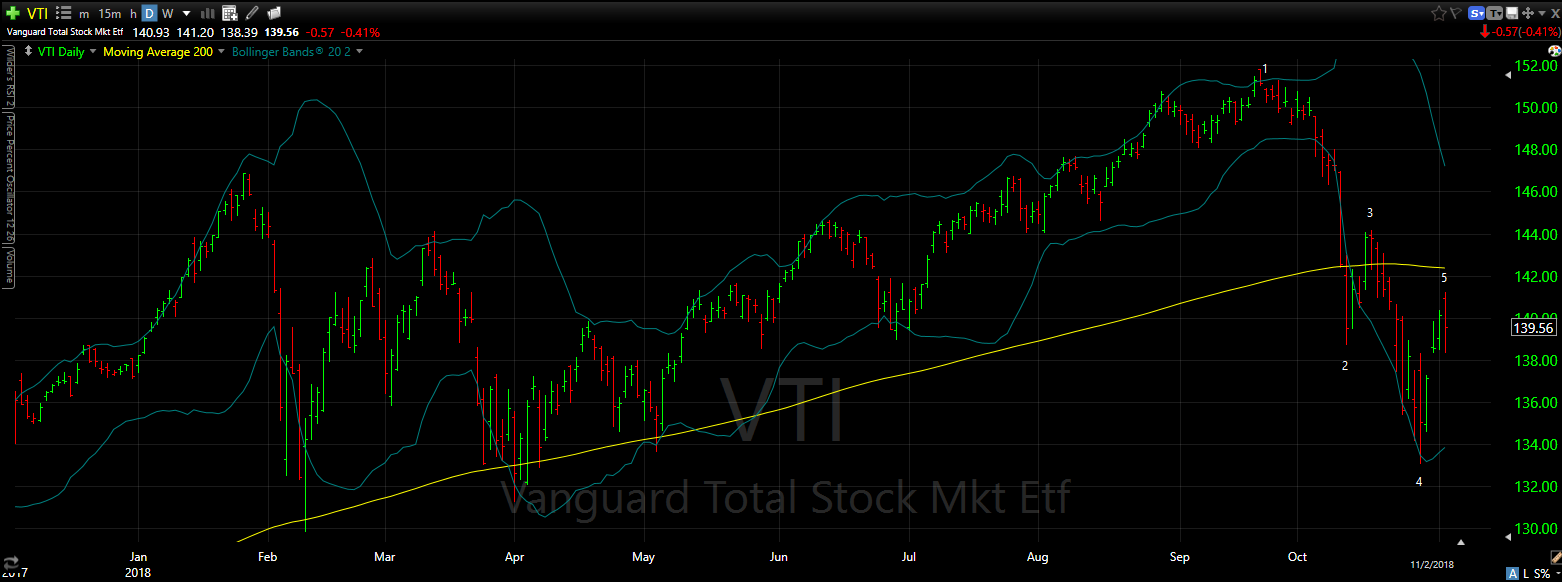
While stocks had a good week, the technical damage has yet to be undone. The charts still show a series of lower lows and lower highs (see 1-2-3-4-5), the market could not break through the 200-day moving average (the yellow line), and what was looking like a promising Friday with the market up by 0.76% in the morning turned into a 0.41% loss for the day. Although stocks did show resilience not breaking through the Thursday lows.

TRADE

There was a hint of good news on the trade front, Trump tweeted that he had a “very good conversation” with Chinese President Xi Jinping on settling the trade dispute. It was also reported that Trump had his staff working on drafting an agreement for the G20 Summit in a few weeks. An agreement would take away a headwind facing the world economy.

PAYCHECKS INCREASE

Private sector paychecks were up by 3.1% compared to one year earlier. It was the biggest year over year gain since 2008. Nonfarm payrolls skyrocketed by 250,000 in October. Unemployment remained at 3.7%, the lowest number since December of 1969. The labor force increased by 711,000 people of which 600,000 found employment.

MIDTERM ELECTIONS

According to Yardeni Research, the stock market has been up for the one year after every midterm election since the 1950s. The gains have ranged from 1.1% after 1986 to 33.2% after the 1954 elections. Moreover, a Republican President combined with a split Congress, the favored outcome for this week’s election, has produced an average annual return of 15.7% for the S&P 500 during that time period. Of course, these are not huge sample sizes and “past performance does not guarantee future results.”

SCOREBOARD

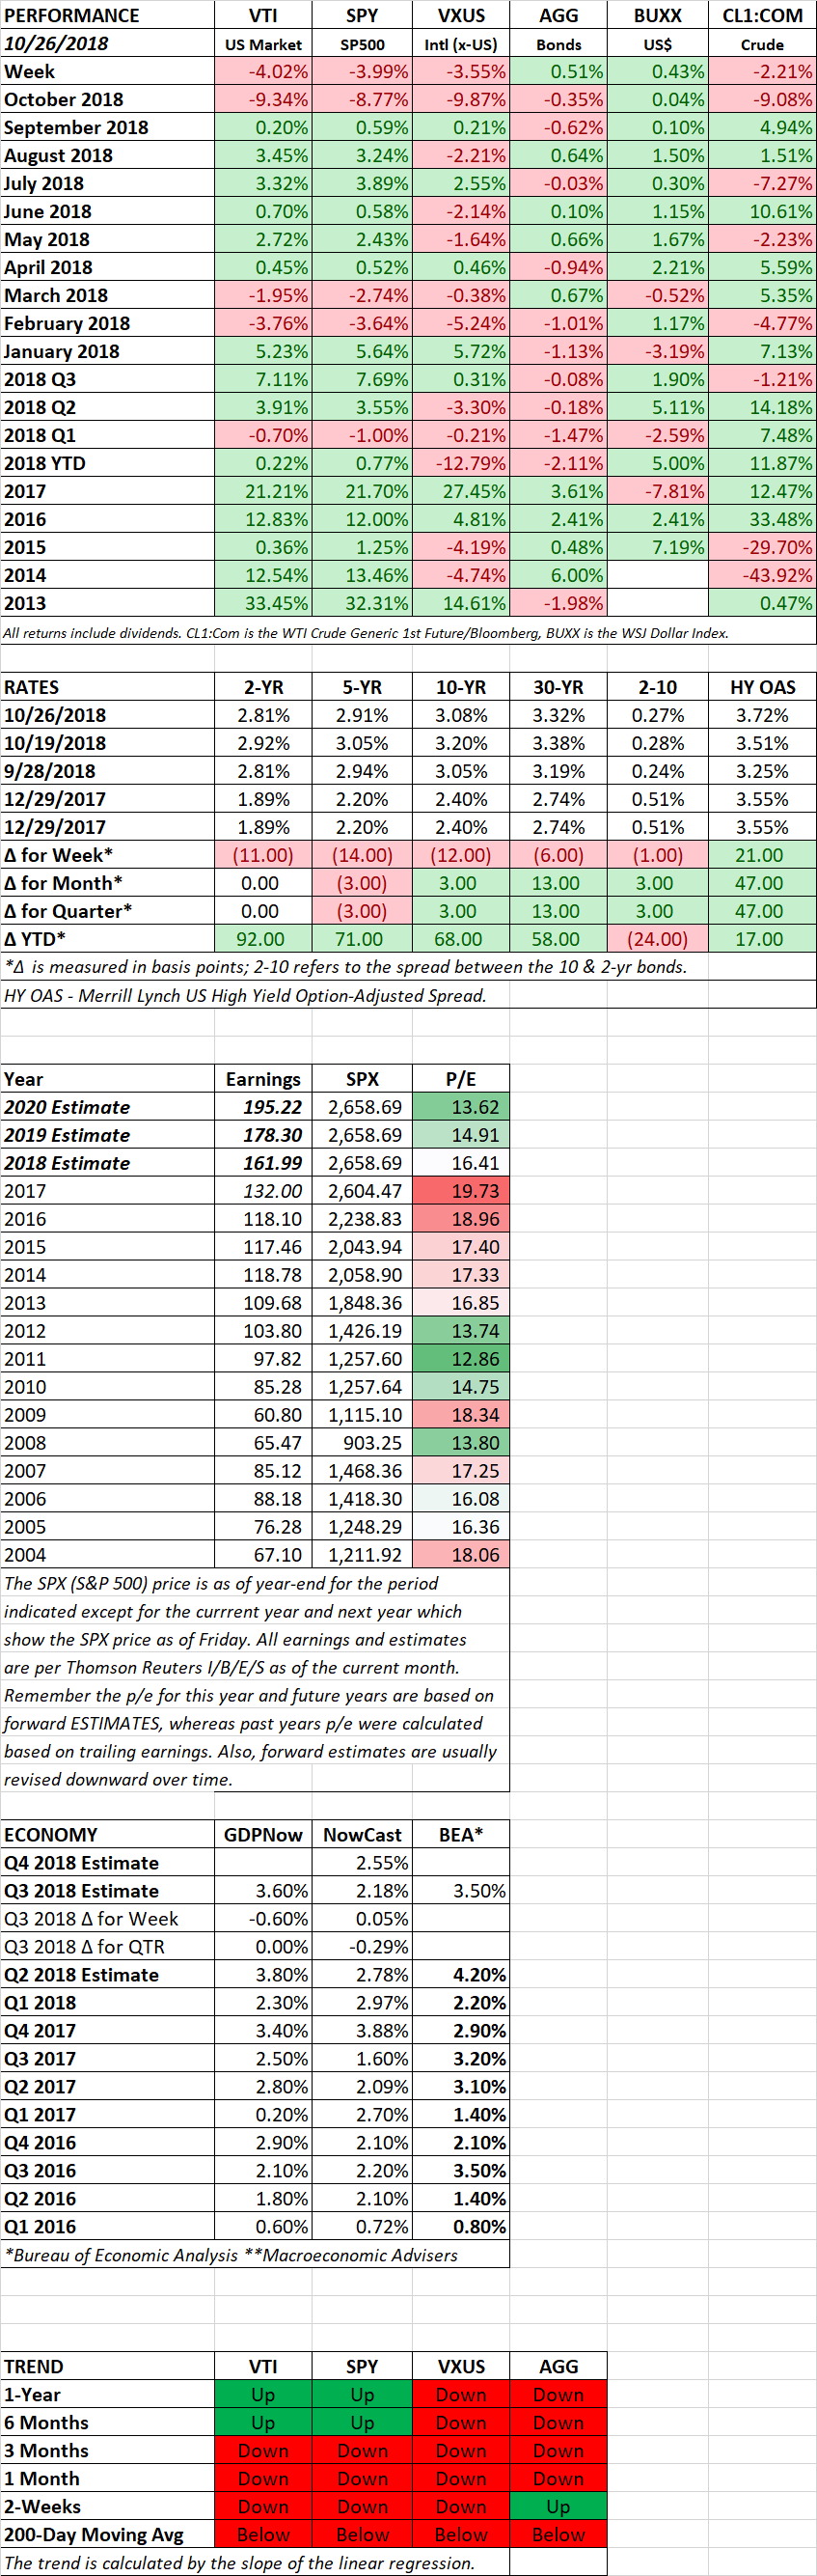
Week Ending 10/26/2018

HIGHLIGHTS

  • A brutal sell-off as US stocks drop by 4% and international stocks were off by 3.55%.
  • Stocks fall through previous support.
  • A solid 3.5% increase in Q3 GDP.
  • Consumer spending highest since 2014.
  • Key inflation gauge comes in lower than expected.
  • Recession risk is better than 50% going out two years according to a JP Morgan model.
  • The overvalued Canadian real estate market is starting to slow down.

MARKET RECAP

It was another brutal week on Wall Street. US stocks fell by 4%. Overseas, was not much better, down 3.55%. Bonds rallied by 1/2% as interest rates fell. US stocks are off by 9.87% from their August 29th high and international stocks are now down by 20.43% from their high on January 26. The S&P 500 was down by 10.3% from its September 20th closing price at its low on Thursday.

Stocks cut right through support established by previous lows earlier in October, June and late May. The next level of support is around the 2580 area on the S&P 500, about 3% lower from here. According to Ned Davis Research, bear markets that occur within an environment without a recession normally stop after a drop of about 20 to 25%. That doesn’t mean we fall that far, or can’t fall further, but that level has some historical support.

The US economy still looks good and at least so far, there does not appear to be a recession on the immediate horizon. The Commerce Department reported that in its initial estimate of Q3 GDP growth, the economy expanded by a solid 3.5%. Consumer spending was up by 4% in the third quarter, the best reading since 2014. And in more good news, the PCE price index, a measure closely watched by the Fed, showed inflation at 1.6%, less than the expected 2.2%.

But worries abound, the Fed is looking at four more interest rate increases of 25 basis points by the end of 2019. The drawdown of the Fed’s balance sheet continues, $271 billion over the last year and it continues at the rate of $50 billion per month. The trade war with China is starting to get more and more play as companies report earnings and discuss their outlooks going forward. There is the uncertainty regarding the midterm elections, the threat of a recession in the next year or two, budget problems in Italy, and the messy coverup of a murder by Saudi Arabia.

At this point though, the decline is taking on a life of its own and might be dropping for technical and psychological reasons as selling begets more selling. Valuations are starting to look reasonable. If 2019 earnings estimates can hold at the current levels, the S&P is only selling at about 15x earnings. Traditionally though, earnings estimates decline as the period approaches.

RECESSION RISK

A JP Morgan model that predicts the chances of a recession has the US at about 28% within one year and 60% in the next two years. Going out three years, the odds increase to higher than 80%.

US & CANADIAN REAL ESTATE

Sales of existing homes in the US were down by 3.4% in September from August, and 4.1% year over year. It was the seventh consecutive monthly decline. Higher home prices and interest rates are getting the blame.

The red-hot Canadian housing market is also slowing down. According to the Canadian Real Estate Association, “About 70% of local markets were down on a y-o-y basis, led primarily by declines in major urban centres in British Columbia, along with Calgary, Edmonton and Winnipeg.” Home buying was down in September, year over year, by 8.9%, it was a six-year low for September. Vancouver, the hotbed of the Canadian boom, was down by 43%. The average sales price was basically flat, up by 0.2%.

While the US has also experienced a slow down in real estate sales, Canada has a bigger threat in terms of valuation. According to Steve Saretsky, a Canadian real estate analyst, the average home sales price in Canada is $371,000 (USD) versus $296,800 in the USA.

SCOREBOARD

Week Ending 10/19/2018

HIGHLIGHTS

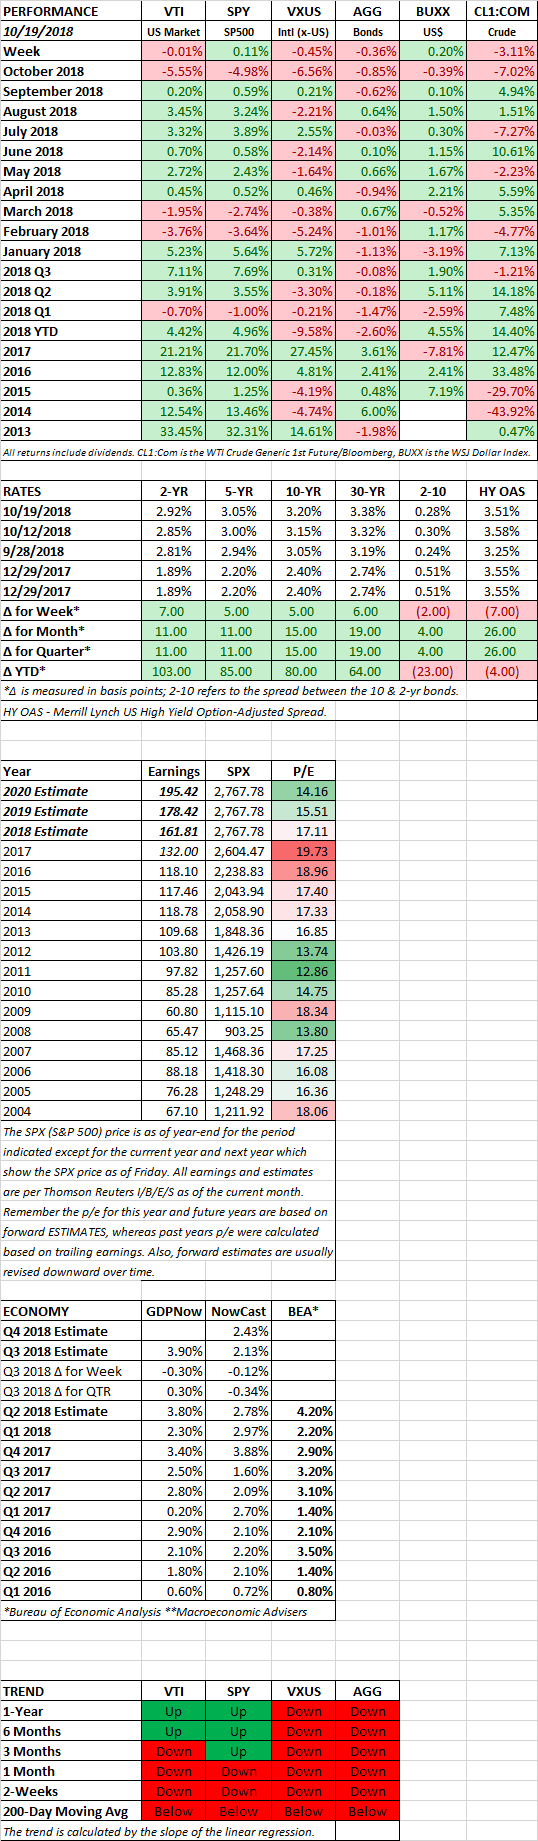
  • US stocks were flat and international stocks fall by 0.45% but lots of volatility during the week.
  • Bonds drop 0.36%.
  • The growth in the estimate of future earnings seems to have stalled.
  • The US economy is strong but there is a rising risk of a global recession based on leading indicators.
  • Sears files for bankruptcy

MARKET RECAP

US stocks were flat and international equities fell by 0.45%. While US stocks pretty much ended the week where they started that hides the fact that it was a wild week in between. Stocks were up by 2.2% on Tuesday on strong earnings reports and down by 1.45% on Thursday on geopolitical concerns. Bonds were down by 0.36% as interest rates about 5 basis points across the curve.

EARNINGS

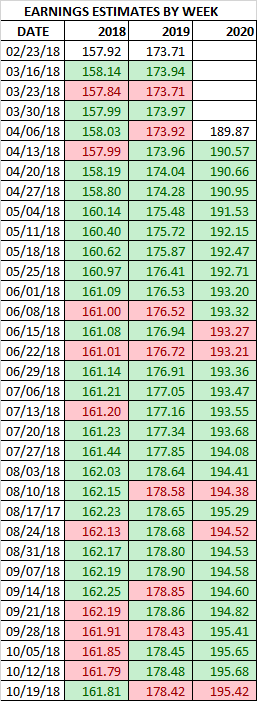
Solid earnings led to a massive rally on Tuesday, but overall, estimates of further increases in future earnings have stopped. This week, estimated earnings were revised down for 2019 and 2020. Earnings should still be up nicely in each of those years, but the consistent revisions up that we have seen for the past couple of quarters appears to be ending.


per Thomson/Reuters

JOB OPENINGS

There were 7.136 million job openings on the last day of August according to the Labor Department. That is 902,000 more than the amount of Americans who were actively looking for work. Prior to March, job openings were never greater than those looking for work in the entire 17-year history since these statistics have been kept. The labor market continues to be extremely tight.

GLOBAL ECONOMY

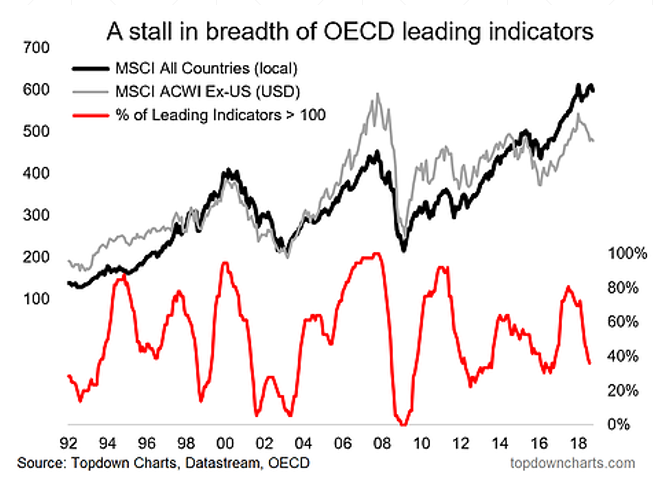
While the US economy continues to look strong, the same cannot be said around the rest of the world. There is a rising risk of a global recession.  Equity markets often move in the same direction as economies around the world. When most countries leading economic indicators are operating above trend markets are generally rising. Likewise, when most countries are operating below trend, markets often fall.

The percentage of OECD countries (36 countries) with leading indicators above trend has dropped to 40% (see the red line below). In the big market sell-offs of 2000 and 2007 (see the black and gray lines below), economies deteriorated around the world to the point that almost every country was operating below trend when measured by the leading indicators. However, two times in recent years, the trend stopped at about 25%, and market rallies resumed without colossal sell-offs.

SEARS

The once-proud retailer Sear filed for bankruptcy. Sears has been headed in one direction, down, since hedge fund manager Eddie Lampert took over. This was more than just the impact of Amazon. Lampert did not invest in stores, Sear bought back stock at high prices, while the stores deteriorated. Lampert kept inventories at extra light levels, meaning they were often out of stock, stopped advertising via circulars and basically neglected the stores.

SCOREBOARD