HIGHLIGHTS
- Stocks are up in the US and around the world.
- Bonds fall.
- There is still technical damage on the charts.
- Trump hints of good news on the trade front with China.
- A solid payroll report.
- A year after the midterms returns have usually been positive.
MARKET RECAP
Stocks closed out October and started November with a positive week, advancing by 2.8% in the US and 3.9% outside the US. Bonds fell by 0.6% as a solid payroll report increased the chances of higher interest rates down the road. Crude fell by 6.6%.
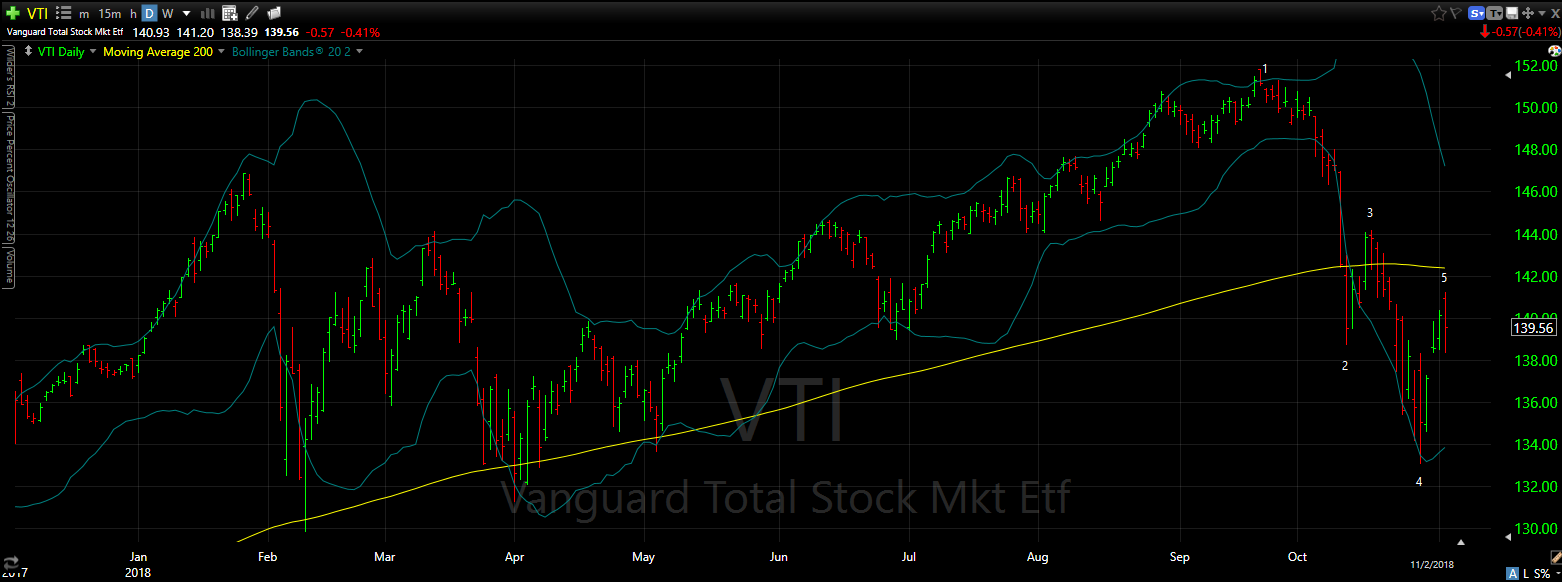
While stocks had a good week, the technical damage has yet to be undone. The charts still show a series of lower lows and lower highs (see 1-2-3-4-5), the market could not break through the 200-day moving average (the yellow line), and what was looking like a promising Friday with the market up by 0.76% in the morning turned into a 0.41% loss for the day. Although stocks did show resilience not breaking through the Thursday lows.
TRADE
There was a hint of good news on the trade front, Trump tweeted that he had a “very good conversation” with Chinese President Xi Jinping on settling the trade dispute. It was also reported that Trump had his staff working on drafting an agreement for the G20 Summit in a few weeks. An agreement would take away a headwind facing the world economy.
PAYCHECKS INCREASE
Private sector paychecks were up by 3.1% compared to one year earlier. It was the biggest year over year gain since 2008. Nonfarm payrolls skyrocketed by 250,000 in October. Unemployment remained at 3.7%, the lowest number since December of 1969. The labor force increased by 711,000 people of which 600,000 found employment.
MIDTERM ELECTIONS
According to Yardeni Research, the stock market has been up for the one year after every midterm election since the 1950s. The gains have ranged from 1.1% after 1986 to 33.2% after the 1954 elections. Moreover, a Republican President combined with a split Congress, the favored outcome for this week’s election, has produced an average annual return of 15.7% for the S&P 500 during that time period. Of course, these are not huge sample sizes and “past performance does not guarantee future results.”
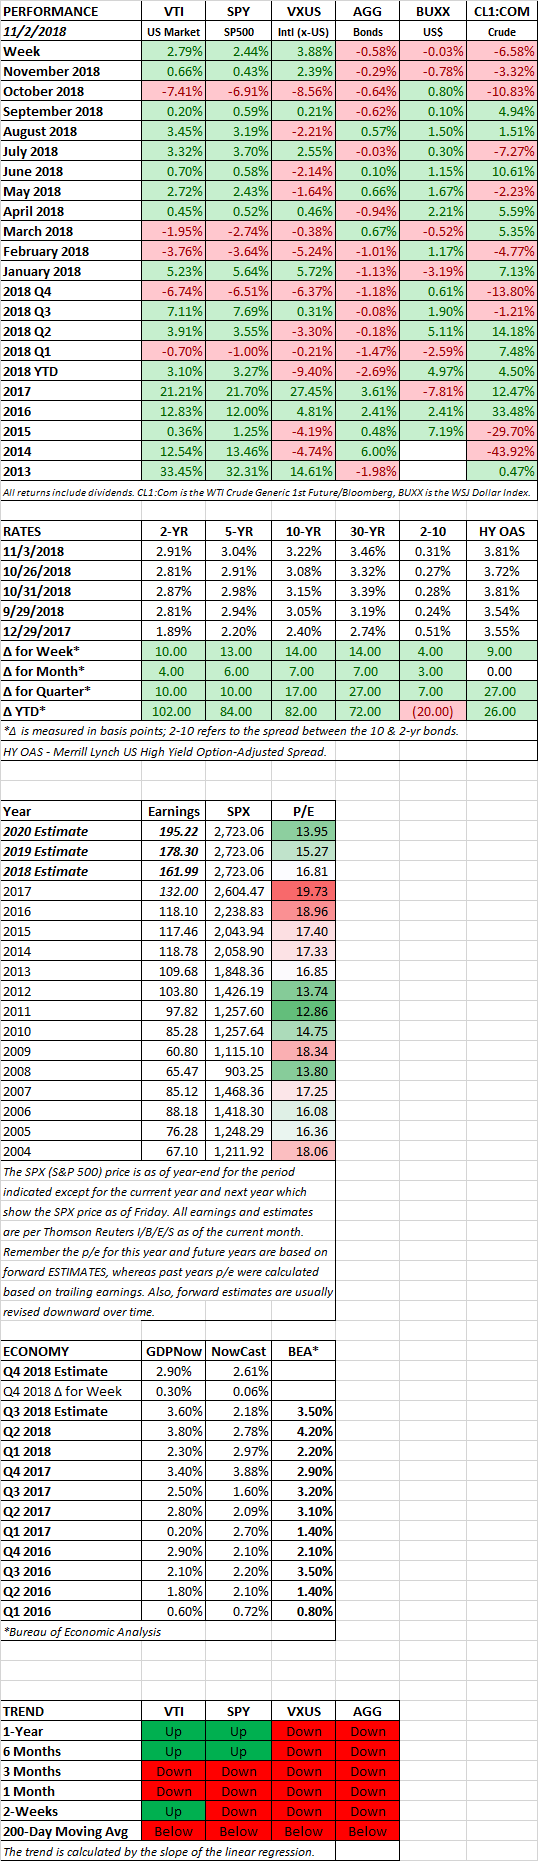
SCOREBOARD