Week Ending 2/5/2017

The US markets continued their decline falling 3.12% (VTI) for the week. Overseas markets dropped 2.32% (VXUS).

Randall Forsyth writes in Barron’s that foreign countries in need of cash, due to the decline in the price of oil, or domestic economic problems (like China), might be tapping into their investments to free up cash for use at home. That might be impacting equity markets around the globe.

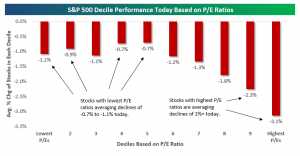
High p/e stocks led the retreat during the big 2%+ sell-off on Friday. LinkedIn (LNKD) dropped about 50%. According to Bespoke, stocks with the lowest p/e’s had average drops from -0.7% to -1.1% while those stocks with the highest p/e’s dropped an average of 1.2% to 3.1%. This analysis was based on splitting the market into deciles and calculating the average declines of the 5 lower deciles and then calculating the five higher deciles. The market has favored growth stocks over value the last couple of years but Friday may mark a change in that sentiment.

deciles

EARNINGS

So far 63% of SP500 companies have reported earnings for Q4. According to Factset, 70% have beaten the earnings mean estimate and 48% have topped the sales mean estimate. The blended earnings decline is -3.8%. Assuming earnings end up in the negative, this would be the first time since the first three quarters of 2009 that earnings have declined three quarters in a row. 57 companies have lowered EPS guidance and 14 have raised guidance. 12-month estimated earnings are now $124.29, putting the SP500 at forward p/e of 15.12. Revenue growth has been led by the telecom and healthcare sectors.  Energy had the largest decline in revenue.

EMPLOYMENT

Employment numbers released Friday were generally favorable. The unemployment rate fell to 4.9% from 5.0% and a 151,000 new jobs were created in January. The labor force also grew for the third consecutive month. Long-term unemployment hit a new post-recession low. Wages and hours worked improved. On the downside, jobless claims were 285,000 which was higher than expected for the fifth time in six weeks. However, while 285 is greater than some of the low jobless claims numbers we were seeing a few months back, it is less than almost all of the other reports dating back to 2005.

PMI

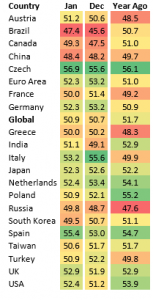
Markit released its Purchasing Manager’s Index for various countries around the world. A PMI reading greater than 50 indicates growth. Of the 20 countries listed, 13 had a PMI greater than 50, two had a PMI equal to 50 and five had a PMI less than 50. Ten of the twenty countries had a month over month improvement. Looking from a global perspective, the PMI improved to 50.9 from 50.7. So growth continues on a global basis at a slow rate.

PMI Feb 7 2016

CREDIT CONDITIONS

There was a negative report this week indicating that credit conditions are tightening. The Senior Loan Officer Opinion Survey showed that credit standards for commercial and industrial loans are starting to tighten. There was also a decrease in these types of loans. In the past, that has been a leading indicator of a recession. However, other types of loans are showing positive growth rates.
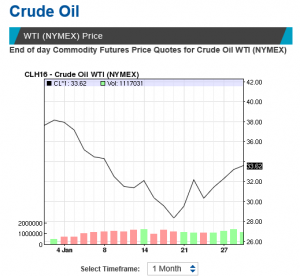
ENERGY

The Department of Energy announced that inventories continued to increase for oil, gasoline and distillates. At the same time, demand for oil and gasoline increased. That set up a short squeeze rally that moved the WTI up by 10%. That rally turned the market around from a 1.61% loss to a 0.60% gain on Wednesday.

DOLLAR

The other big news on Wednesday was a massive drop in the dollar. It was the largest decline in the Bloomberg USD index since March 18, 2015.

PRODUCTIVITY

Productivity fell at a 3% annualized rate in Q4 according to the Advance release. Employee compensation increased. The economy had higher wages and flat output resulting in the lower productivity. This could be a bad sign for corporate profits.
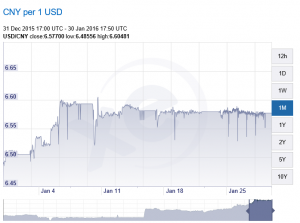
CHINA

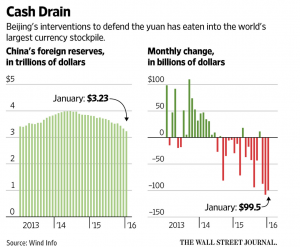
China has been burning through their foreign-exchange reserves, dropping to a 3-year low in January. The government is in a battle with speculators and hedge funds that are betting on a decline in the yuan. China want to maintain a stable currency. For now, their efforts have kept the yuan stable over the last few weeks, the question is how long they can hold out.

Cash Drain China 2 6 2016 WSJ

SUMMARY

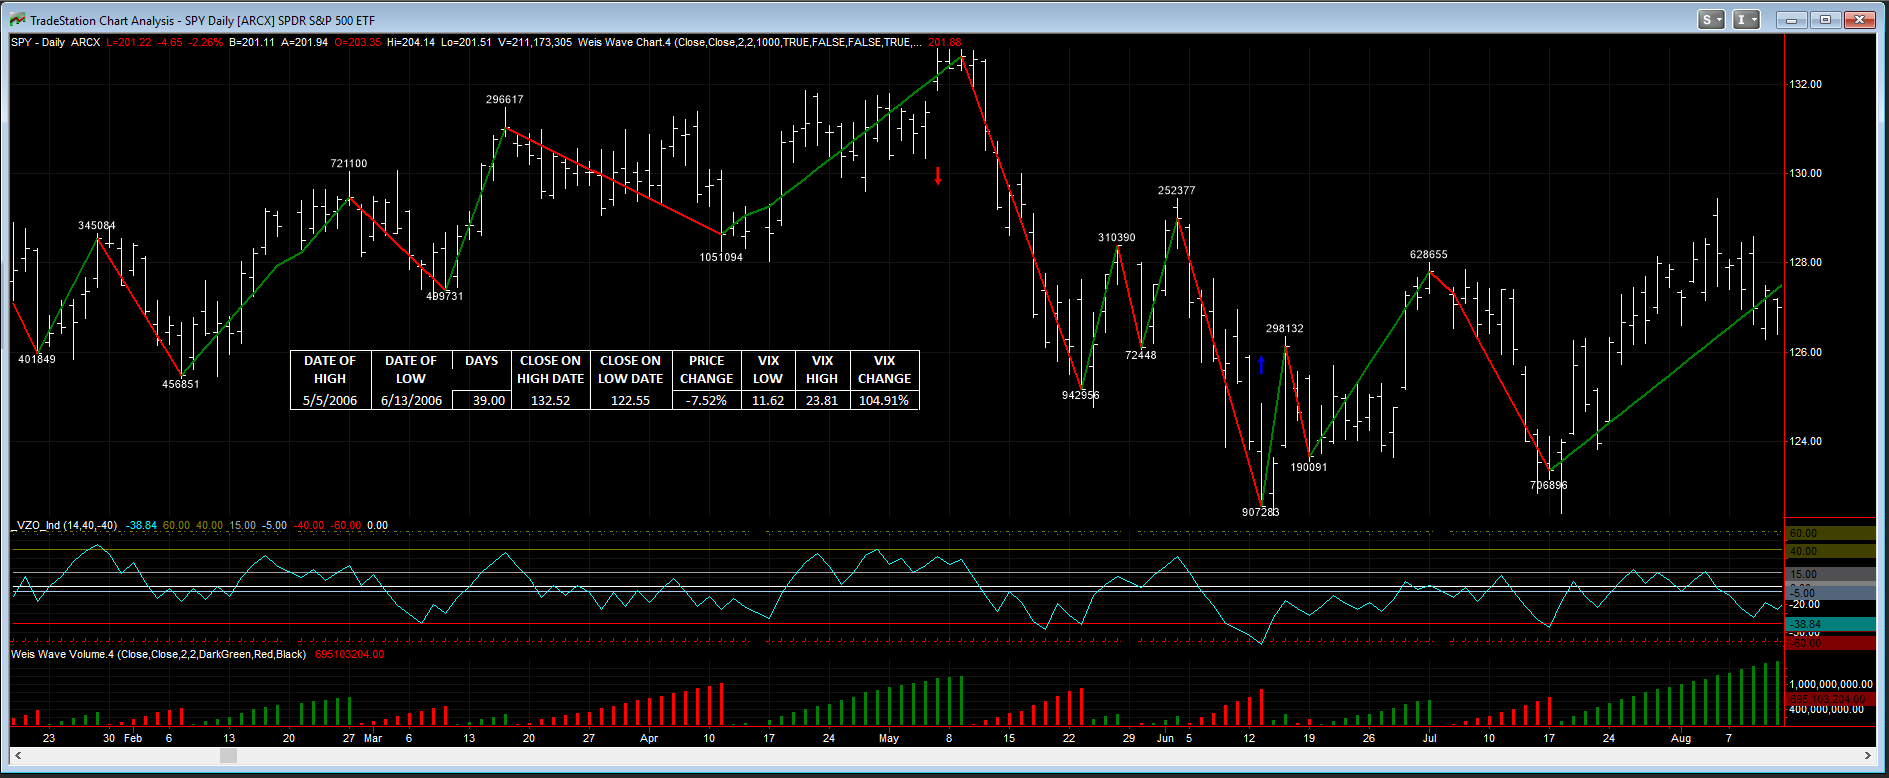
There was plenty of news on the negative side this week. But most every respected economist still does not see a US recession in the near term, although the percentage chances are increasing. The market stalled right at its resistance level of about $95 on the VTI. However, valuations are reasonable. The market is selling at about 15 p/e based on forward earnings and the spread between the dividend yield on the SP500 versus the 10 year treasury bill is at its highest since 2012.

January Recap

It was the worst start to a year ever, but a small rally towards the end of the month made January the seventh worst opening month start for the US equity markets. According to the Stock Trader’s Almanac, for five of the six other January’s that managed a worse return, gains were positive for the remainder of the year. Fear of spillover effects from China and the price of oil are leading to concern of a recession somewhere down the line. As of now, most economists do not see that happening and are looking to a period of more slow growth ahead. The latest numbers from the Atlanta Fed GDPNow forecast, a week by week estimate of GDP, released on Thursday, show Q4 closing out with a 1% gain. The US Bureau of Economic Analysis released its advanced estimate of Q4 GDP growth on Friday at +0.70%.

GDPNow 1 28 2016

The market got off to a bad start during the first few days of January. There was a trifecta of negative Chinese data that clobbered the market and raised fears of China bringing down the rest of the world economy. The PMI reading out of China was less than 50. The Caixin Manufacturing PMI came in at 48.2, down from 48.6 the prior month but up from 47.2 in September. The currency, the Yuan, also depreciated by about 1.5% during the first week of January (see chart below). Volatilty spiked in the Chinese financial markets as equity price plunged, resulting in the use of newly installed “circuit breakers” that closed the exchanges. This led to even more selling. This combination was lethal and sent equities around the world plunging, the SPY dropped 5.84% by Friday, January 8.

cny chart

But the damage was not done. The other problem was the falling price of crude oil. Crude oil (West Texas Intermediate) dropped from about $38 per barrel to almost $28 (see chart below) on January 20. Current market prices are well below the marginal cost of production, and if prices don’t rebound there will likely be a wave of defaults in the high-yield fixed income sector. That could lead to negative consequences for the rest of the US economy. Crude began to rebound in the final 10 days of the month, closing January at $33.62.  The SPY dropped to a closing low on January 20 of $185.65. That coincided with the low price in oil for the month and put the SPY at 8.94% off of the 2015 closing price at year-end and 12% off the recent high of November 3. On an intra-day basis, the SPY was off 14.21% on January 20th.

crude oil chart

As crude oil began to rebound, the market slowly advanced. The market received some surprise news on the last trading of the month when Japan went to negative interest rates on excess reserves. The SPY advanced 2.44% on that. In total, since the January 20th close, the SPY has rallied 4.35%.

Fears that the Fed may move too aggressively and continue on their course of multiple rate increases were somewhat alleviated with their comments of January 27, we are “closely monitoring global economic and financial developments.”

For the entire month, the SPY declined by 4.98%, the overall US stock market as measured by the VTI dropped 5.72%, and international markets (x-US) fell 5.45% (VXUS). In a rush to safety, the aggregate bond index (AGG) moved up 1.24%.

Treasury rates fell. The 2-year dropped to 0.76% from 1.06%, the 5-year to 1.33% from 1.76%, the 10-year to 1.94% from 2.27% and the 30 year to 2.75% from 3.01%. High-yield increased, the Merrill Lynch US High Yield Option Adjusted Spread moved up to 7.75% from 6.95%.The High Yield Corporate Bond ETF (HYG) declined by 1.60%.

Materials (XLB) and financials (XLF) fell 10.71% and 8.85% respectively, while utilities (XLU) led the way with a 4.94% gain. The only other positive sector was consumer staples (XLK) which managed a gain of 0.67%.

The weight of the evidence seems to indicate that the US will avoid a recession, but further downside surprises from China or the price of oil could tip the scales.


A Look Back at Corrections/Pullbacks

The market is down about 9% from its recent high on 11/3/2015. So we are bordering on a correction, normally defined as a drop of 10% or more. This is not the first correction and it won’t be the last. Here is a look back at pullbacks and corrections since the summer of 2005.


DATE OF  DATE OF DAYS  CLOSE ON   CLOSE ON   PRICE VIX VIX VIX
HIGH LOW    HIGH DATE   LOW DATE  CHANGE LOW HIGH CHANGE
9/9/2005 10/13/2005        34.00            124.60          117.43 -5.75% 13.5 16.47 22.00%
5/5/2006 6/13/2006        39.00            132.52          122.55 -7.52% 11.62 23.81 104.91%
2/20/2007 3/5/2007        13.00            146.04          137.35 -5.95% 10.24 19.63 91.70%
7/19/2007 8/15/2007        27.00            155.07          141.04 -9.05% 15.16 30.67 102.31%
10/9/2007 11/26/2007        48.00            156.48          140.95 -9.92% 18.88 28.91 53.13%
12/10/2007 1/22/2008        43.00            152.08          131.54 -13.51% 20.74 31.01 49.52%
5/19/2008 7/15/2008        57.00            143.05          120.99 -15.42% 17.01 28.54 67.78%
8/11/2008 11/20/2008     101.00            130.71             75.45 -42.28% 20.12 80.86 301.89%
1/6/2009 3/9/2009        62.00               93.47             68.11 -27.13% 38.56 49.68 28.84%
6/2/2009 7/8/2009        36.00               94.85             88.00 -7.22% 29.63 31.3 5.64%
10/19/2009 10/30/2009        11.00            109.79          103.56 -5.67% 21.49 30.69 42.81%
1/19/2010 2/8/2010        20.00            115.06          105.89 -7.97% 17.58 26.51 50.80%
4/23/2010 7/2/2010        70.00            121.81          102.20 -16.10% 16.62 30.12 81.23%
8/9/2010 8/26/2010        17.00            112.99          105.23 -6.87% 22.14 27.37 23.62%
2/18/2011 3/16/2011        26.00            134.53          126.18 -6.21% 16.43 29.4 78.94%
4/29/2011 6/24/2011        56.00            136.43          126.81 -7.05% 14.75 21.1 43.05%
7/7/2011 10/3/2011        88.00            135.36          109.93 -18.79% 15.95 45.45 184.95%
10/27/2011 11/25/2011        29.00            128.53          116.31 -9.51% 25.46 34.47 35.39%
12/7/2011 12/19/2011        12.00            126.73          120.29 -5.08% 28.67 24.92 -13.08%
4/2/2012 6/4/2012        63.00            141.84          128.10 -9.69% 15.64 26.66 70.46%
9/14/2012 11/15/2012        62.00            147.24          135.70 -7.84% 14.51 17.99 23.98%
5/21/2013 6/24/2013        34.00            167.17          155.73 -6.84% 13.37 20.11 50.41%
1/15/2014 2/3/2014        19.00            184.66          174.17 -5.68% 12.28 21.44 74.59%
9/18/2014 10/16/2014        28.00            201.82          186.27 -7.70% 12.03 25.27 110.06%
5/21/2015 8/25/2015        96.00            213.50          187.27 -12.29% 12.11 36.02 197.44%
11/3/2015* 1/8/2016        66.00            211.00          191.92 -9.04% 14.54 26.39 81.50%

*The correction that started on 11/3/2015 is still in progress.

SEC adopts new Crowdfunding regulations

On October 30, 2015, after three and a half years of proposals, comments, and discussion, the Securities and Exchange Commission (SEC) announced its final rules on equity crowdfunding for small businesses. The forms that funding portals use to register with the SEC become effective on January 29, 2016, while the final regulations take effect on May 16, 2016.

Small businesses considering this new financing alternative will want to review the new regulations carefully.

Click for more info.


Recap for December/Q4/2015

Major market indexes finished just about flat in 2015, but that disguised some pain as many stocks and sub-indexes were in the red for the year. The SPY was the star performer, up 1.27% for the year (including dividends), the overall US market (VTI) gained 0.36%, and international markets (x-US) lost 4.20%. The aggregate bond index (AGG) managed a gain of 0.48%.

For Q4, the SPY advanced 7.02%, VTI 6.24%, VXUS 2.57%. The bond index (AGG) fell 0.51% as the Fed raised interest rates in December. However, the year did not end on a good note despite the positive Q4 returns for equities. For December, the SPY dropped 1.73%, VTI -2.13%, VXUS -2.18% and the AGG -0.19%.

The market topped out on May 21, and then suffered a 12.29% correction that ended on August 25.  The market rallied from there but did fall 5.2% between November 13 and December 20th

Underneath the positive SPY and VTI numbers, most equities were down. Take out eight large-cap out performers like MSFT, AMZN, FB and GOOGL/GOOG, and the SP500 would have down by 4% according to Jessica Binder Graham of Goldman Sachs.

For the year, the midcaps (VO) fell 1.35%. Small-caps as measured by the IWM fell 4.46%. Dividend growers fell (VIG) 1.92%.  Emerging markets (VWO) were down 15.82%. The big winner was large cap growth as measured by the QQQ, up 9.43%. Materials (XLB) were down 8.65% and energy (XLE) was down 21.47%. Consumer discretionary (XLY) was up 9.93%.

November Recap

The market etched out a gain in November. The overall US market as measured by the VTI gained 0.63%. The SPY was up 0.39%. International x-US (VXUS) dropped 1.32% and the aggregate bond index (AGG) fell 0.42%. The treasury curve flattened slightly. The 2 and 5-year notes were up by 19 and 13 basis points while the 10 and 30 year both increased by 5 basis points.

The financial sector (XLF) was the big winner, plus 1.99%. Higher anticipated interest rates was the driver. On the flip side, utilities dropped 2.13% for the same reason. Commodities took a major tumble. Gold (GLD) was down 6.75%, silver (SLV) down 9.19%, oil (USO) down 12.69% and agriculture (DBA) down 3.62%. Commodities were hurt by more weak economic news from China. Imports fell 19% there.

During November it became clear that the Fed will hike rates in December. Strong job numbers are too favorable to ignore. October payroll was up 271,000 versus an estimated 185,000. The unemployment rate dropped to an even 5.00%. Average earnings were also up.

The anticipated interest rate hike dropped the SP500 3.6% for the week ending 11/13. But it rallied the following week when minutes released by the Fed made clear that the pace of interest rate increases would be slow.

Terrorism tried to interfere with the markets with a brutal attack in Paris by ISIS on Friday night, the 13th. But the market shrugged that off with a 1.5% gain on the following Monday. Later in the month, Turkey shot down a Russian jet. Another indication that the world is becoming a more dangerous place.