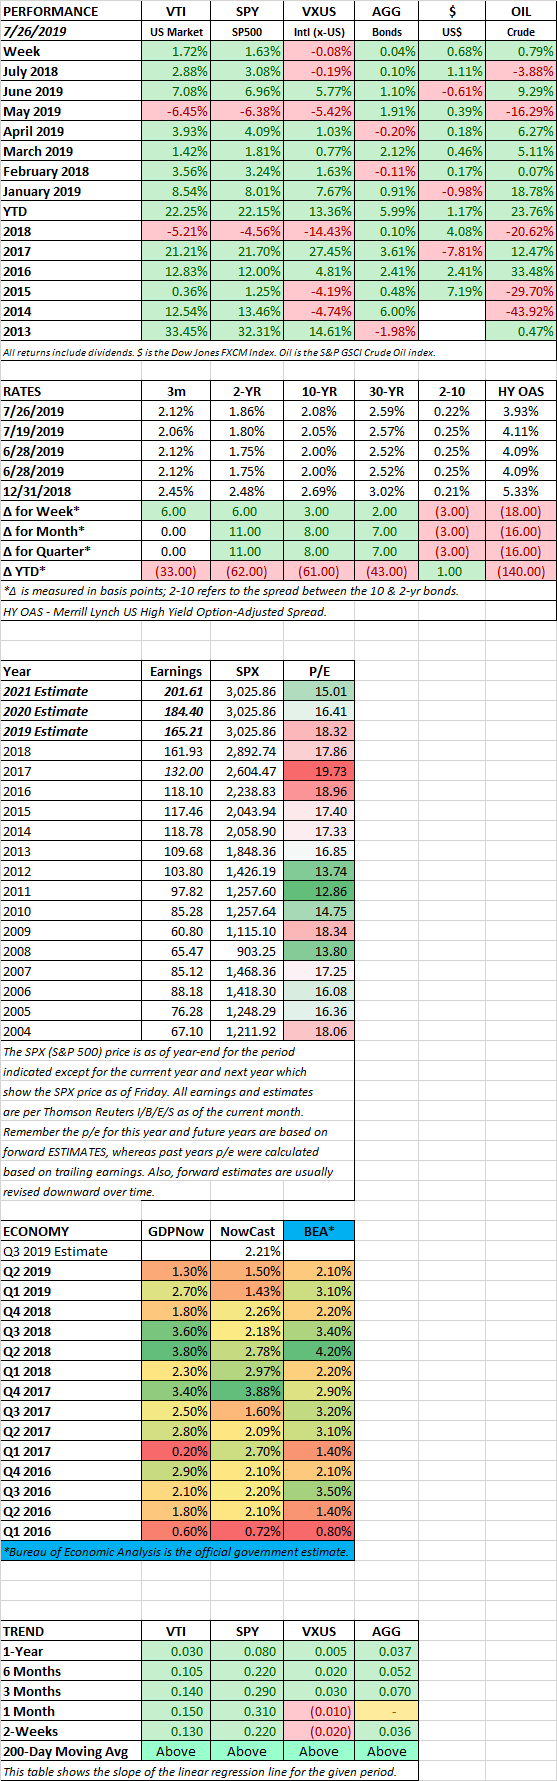
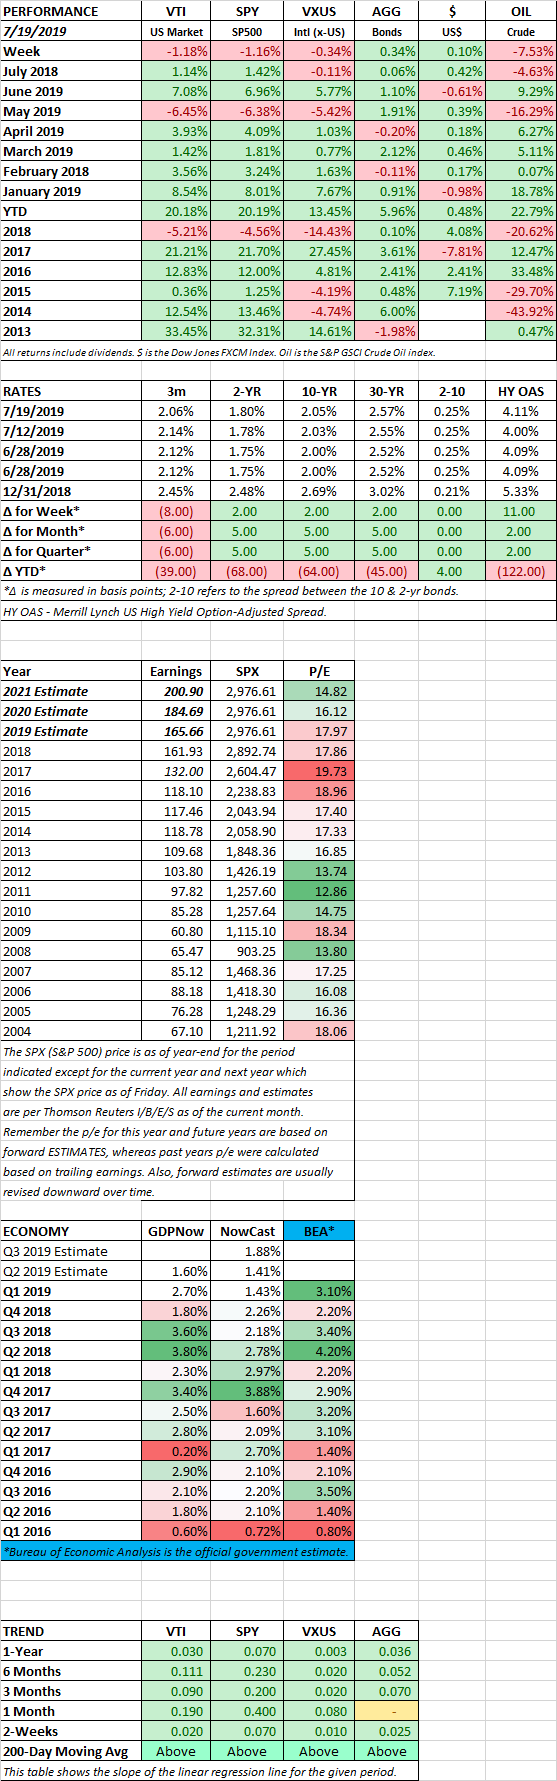
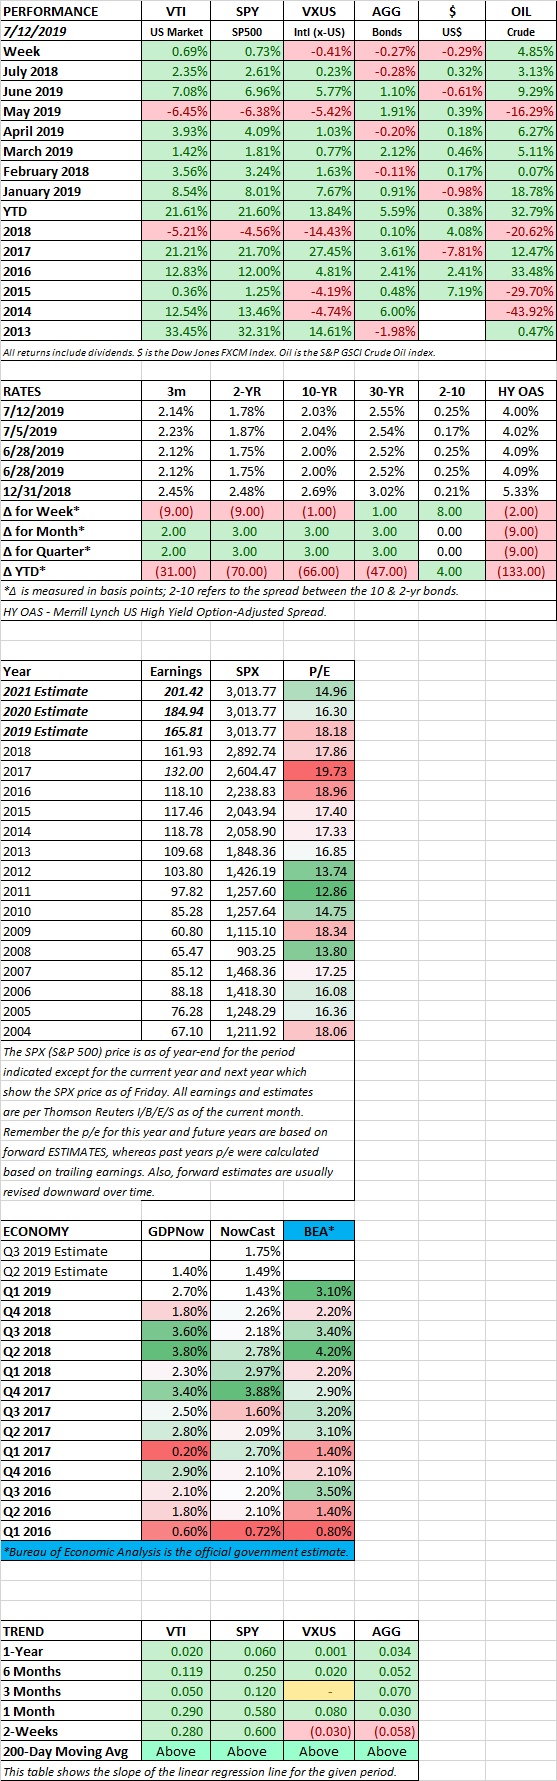
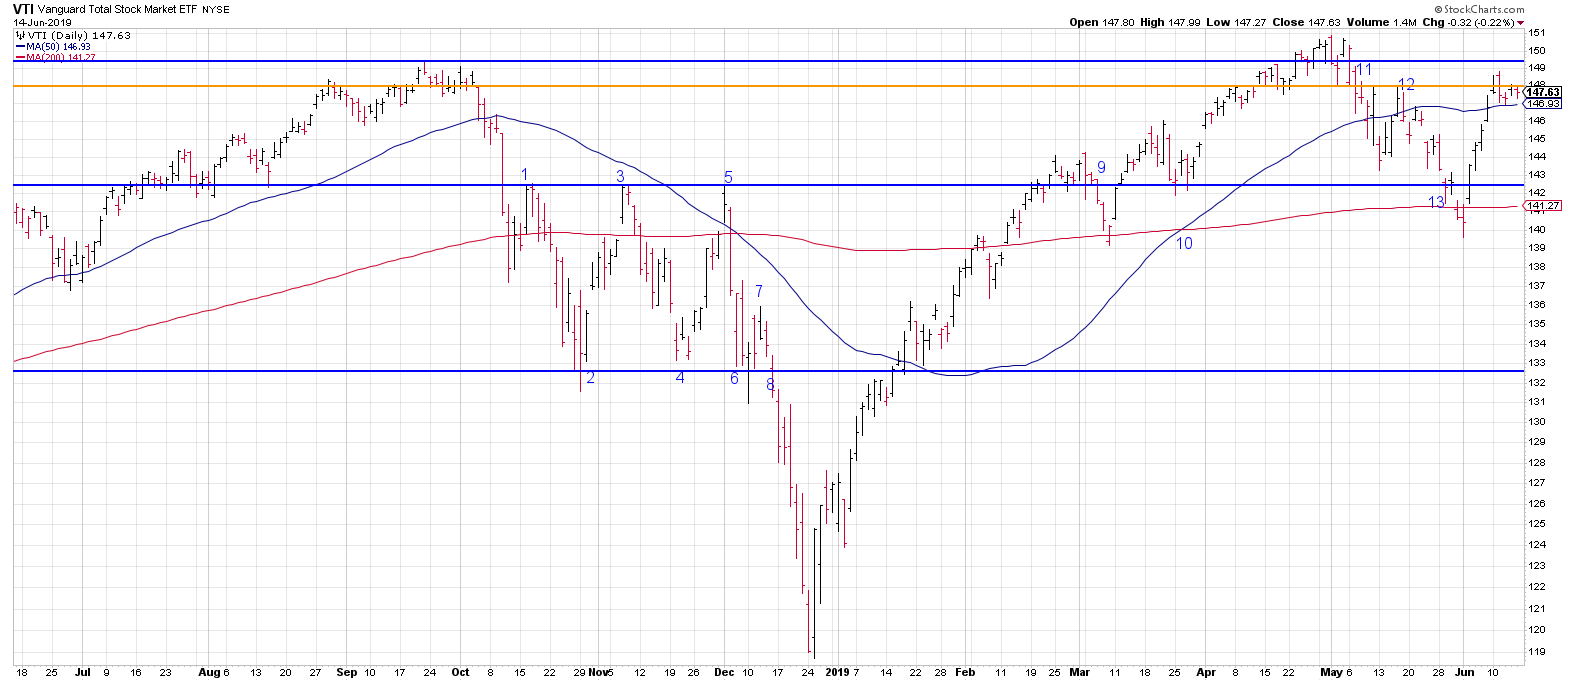
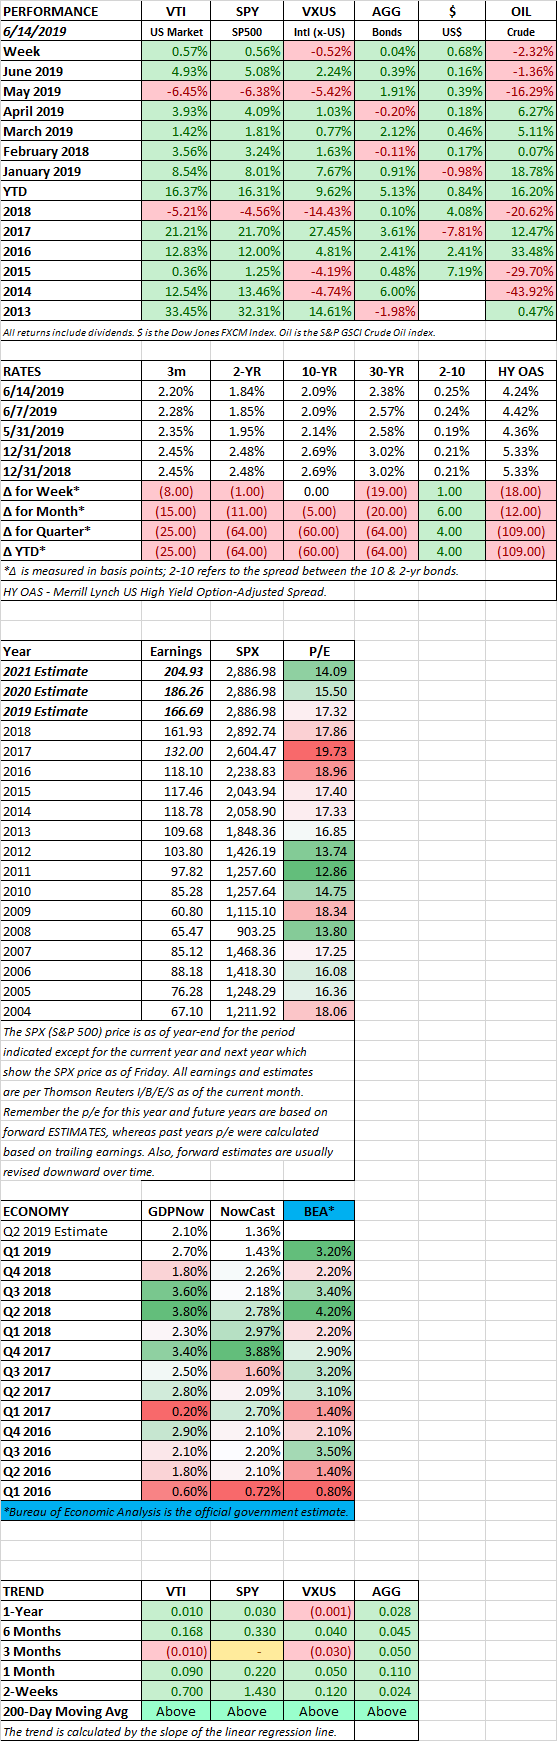
MARKET RECAP
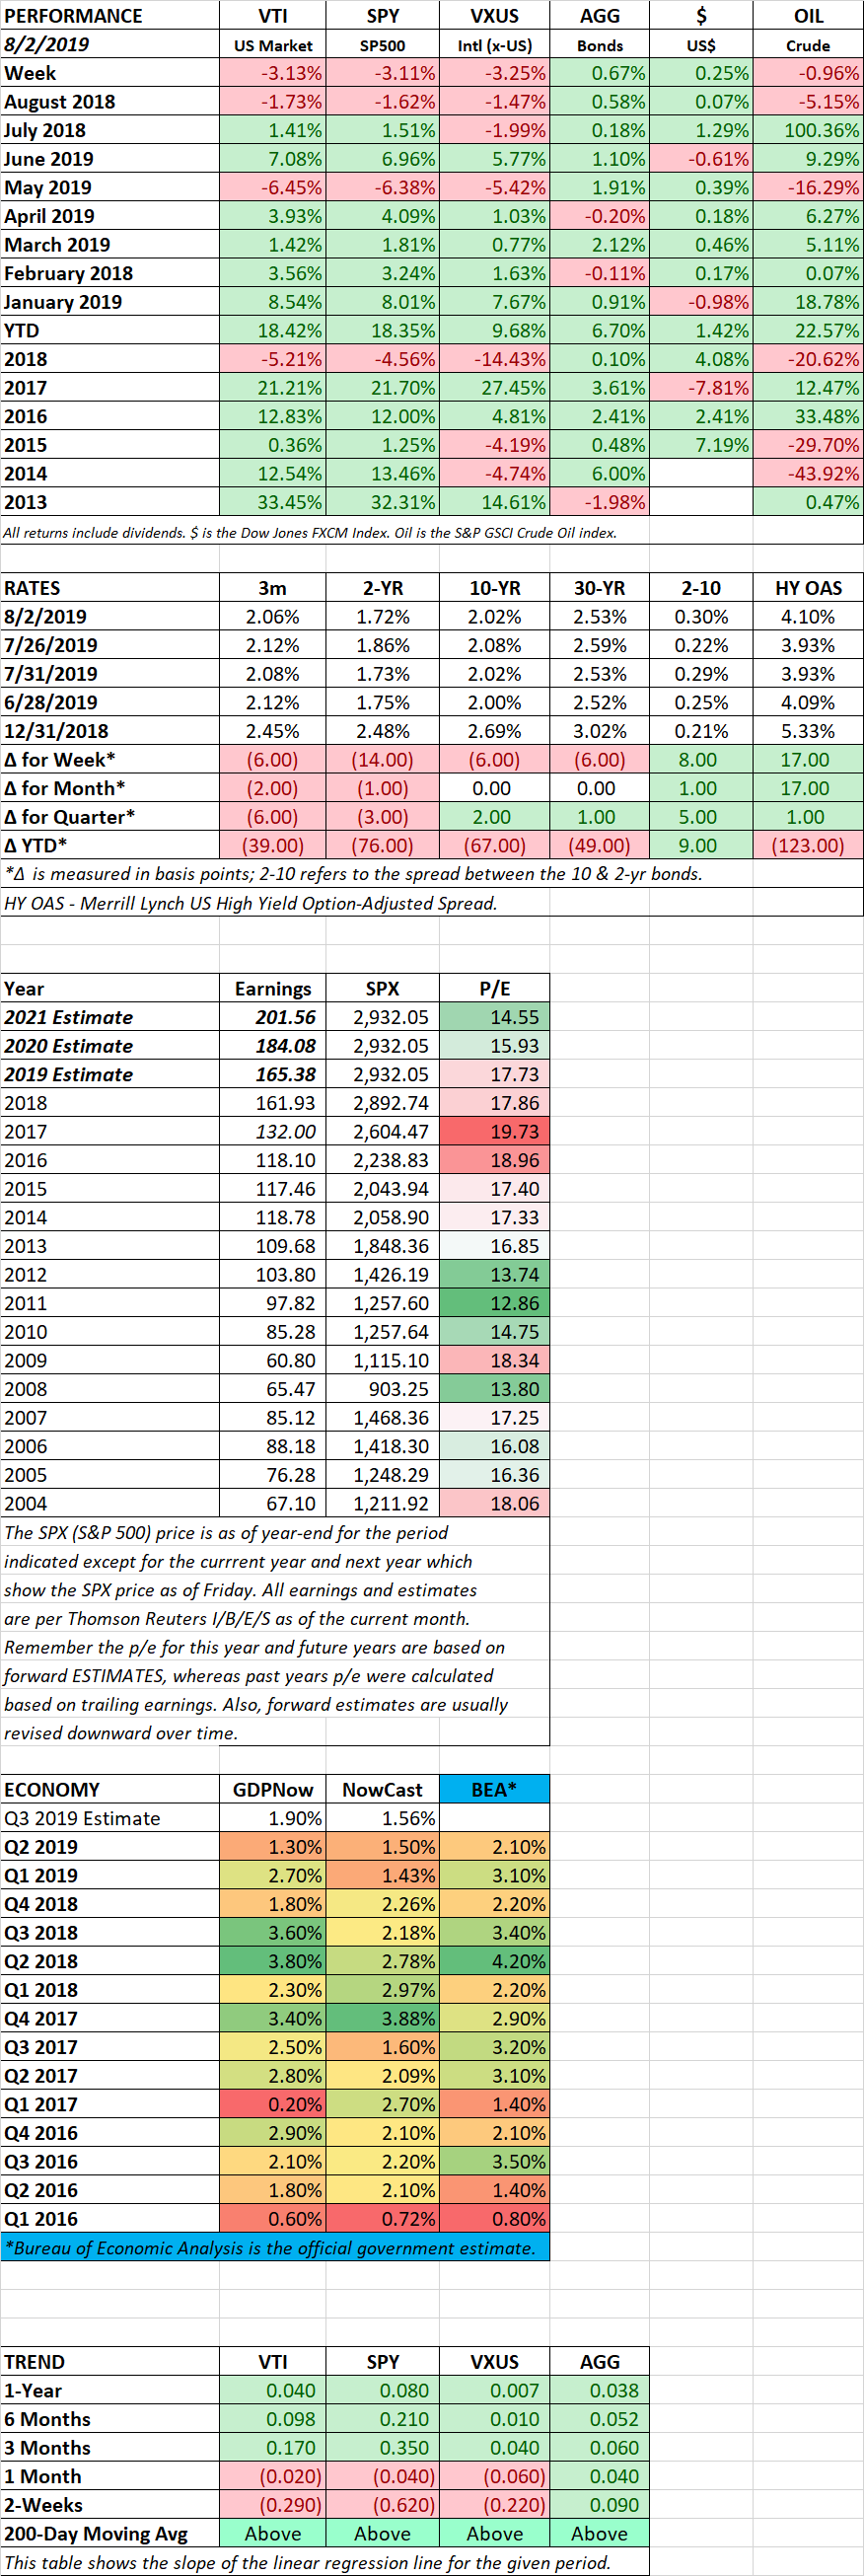
Stocks lost ground every day this week. On Wednesday, losses were due to Fed Chair Jay Powell’s comments on the rate cut (see further below). But the losses accelerated on Thursday and Friday after Trump announced more tariffs on China. For the week, US stocks were down by 3.13%.
Trump said Thursday he will extend tariffs to almost all Chinese imports effective September 1. The tariffs would hit about $300 billion in Chinese goods
and stretch across a wide range of consumer products. The news shook Wall Street. The Dow, which was up by more than 300 points, dropped to a loss of 281,
falling 1.1% on the day. Oil fell by 8%, the most since February of 2015. The new set of tariffs throws more uncertainty into the future course of the economy, and the most recent Fed rate cut may not be enough to help. Powell said on Wednesday (before the new set of tariffs) that “There isn’t a lot of experience in responding to global trade tensions.” Mainly, because the world has been smart enough to avoid large scale
trade wars since the disaster of the Smoot-Hawley tariffs in 1930. But no longer. These are self-inflicted wounds and if Trump follows through it can’t be good for the economy. Trump’s mindset is that the higher tariffs would put more pressure on the Chinese to agree to a trade deal. But Chinese might be willing to hold out. This is the danger of trade wars, one side makes a move, the other makes a counter move, each time expecting the other country to cave, and then egos get involved, and everyone is too proud to compromise. And with Trump, you are dealing with a major ego who seems willing to sacrifice the entire US economy for a “win”.
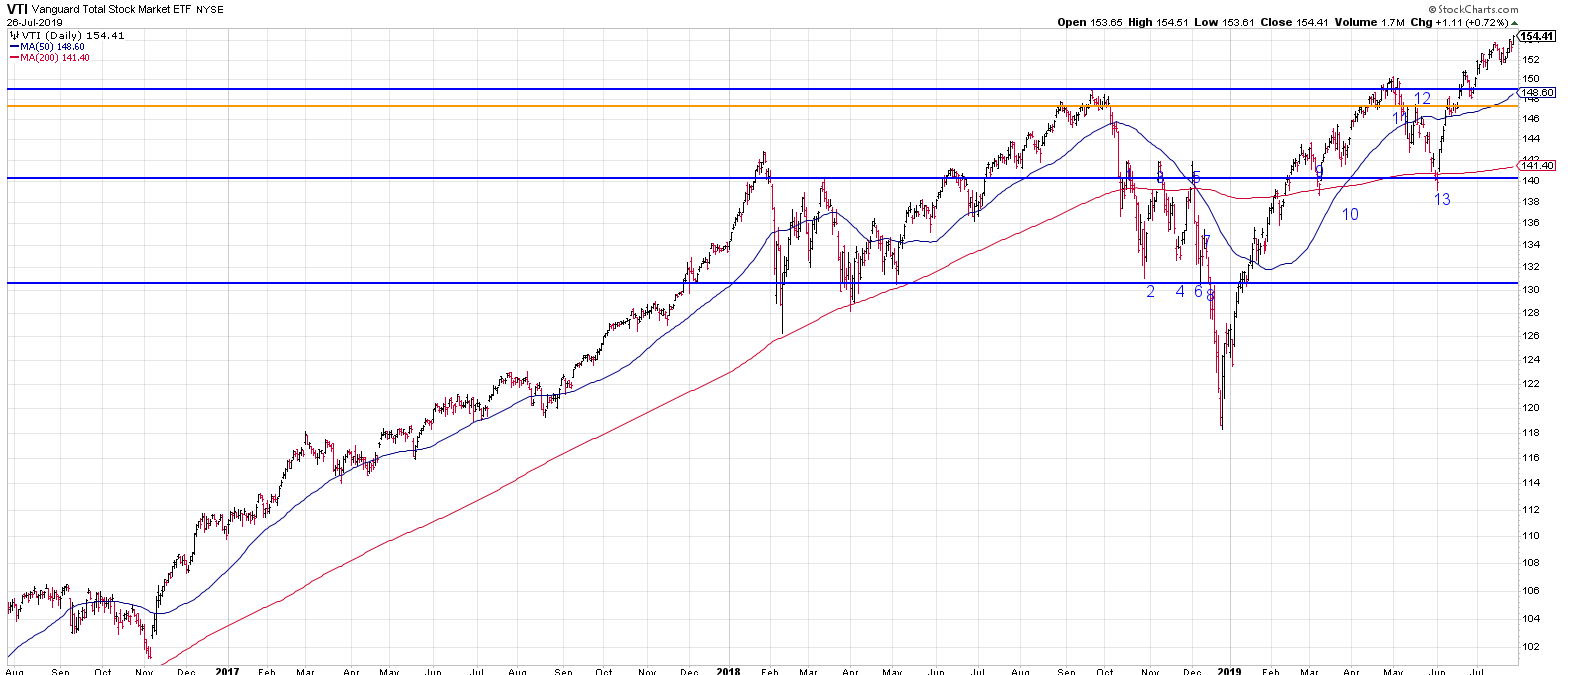
We said in our recent webinar titled “Don’t Fight the Fed,” that one threat that could derail this market rally would be a ramp-up in the trade war. Well if Trump follows through on this newest set of tariffs, that would certainly qualify. We are also moving into a time of year (August through September) where a weak August has led to a sizable drop in October (think 1929, 1987, 2007).
The tariffs to date have already hit the global economy, while the US has slowed down (mainly due to tariffs) it is still in a slow moderate growth mode. But how many times can this economy and market take these kinds of hits without a more severe consequence?
Already, recent market peaks have coincided with Trump’s announcements on tariffs. The January 2018 selloff of 10.16% began when Trump announced tariffs on solar panels and washing machines. That was the first big move in Trump’s turn toward protectionism. The selloff of about 20% that began in September of 2018 began when Trump finalized a list of products subject to tariffs on $200 billion in imports from China.
At least there was one piece of good trade news this week. The US and Japan are close to finalizing a limited trade pact that will increase US farm exports to Japan in exchange for dropping the threat of auto tariffs on imports from Japan.
STRONG WAGE GROWTH
The Bureau of Economic Analysis updated its personal income data on Tuesday and reported that employee compensation rose by 4.5% in 2017 and 5% in 2018. Compensation increased by 3.4% through the first six months of this year. These are upward revisions and above recent trends and indicative of the positive benefits of Trump’s early policies including tax reform which encouraged business investments, and deregulation. All of which occurred before Trump switched gears to concentrate on tariffs.
FED CUTS RATES
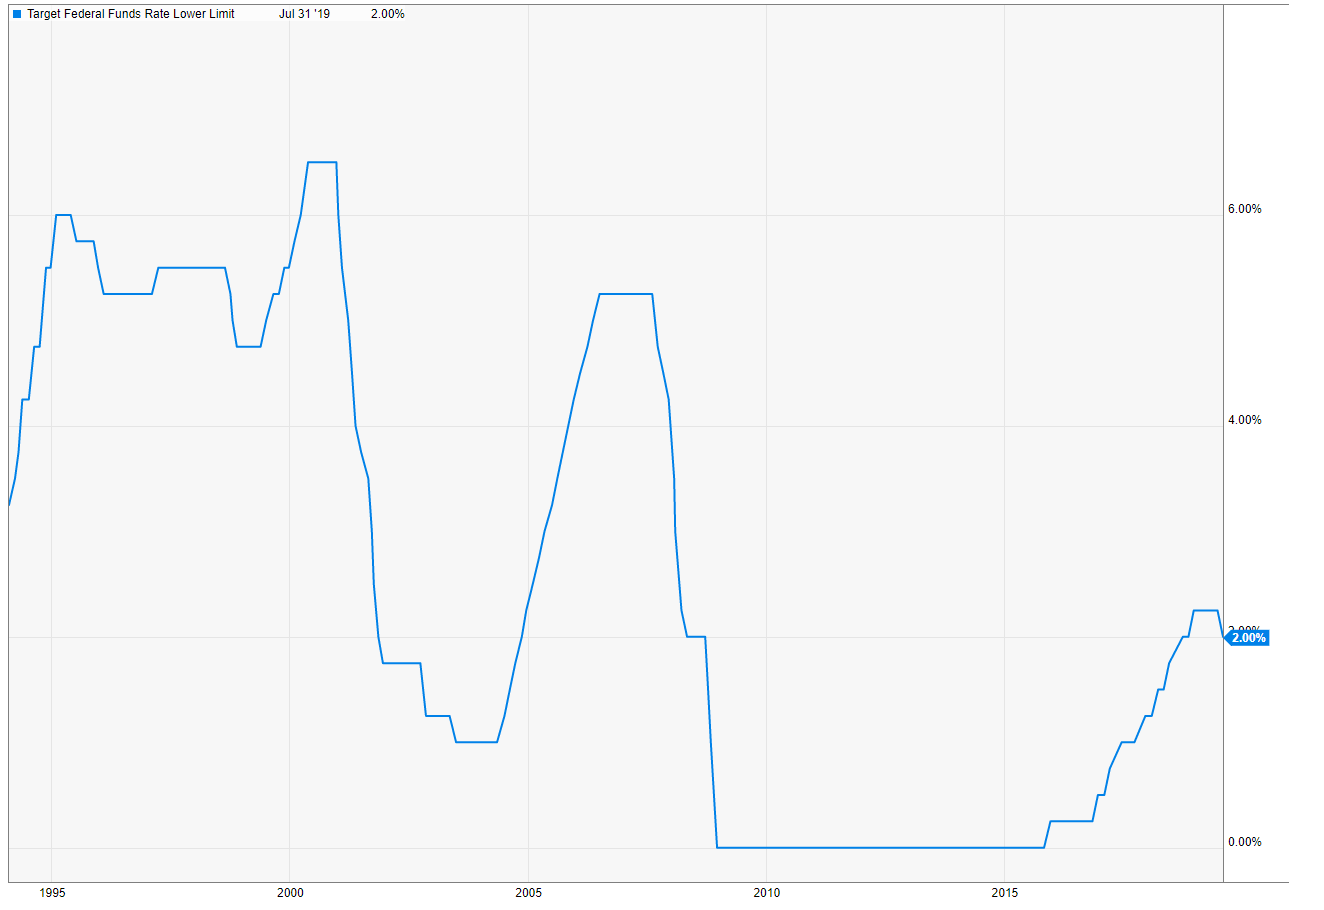
The Fed cut rates for the first time since 2008 hoping to head off a near-term recession. The market did not cheer the announcement as Fed Chair Powell did not indicate that there would necessarily be follow-through. Powell said the cut was a “mid-cycle adjustment.” The S&P 500 fell by 1.1% for the day.
There is a question if a quarter-point cut is even worth it, Catherin Mann, the chief global economist at Citigroup said, “The real issue facing the global economy is trade uncertainty, and monetary policy is not well-targeted to address that uncertainty.”
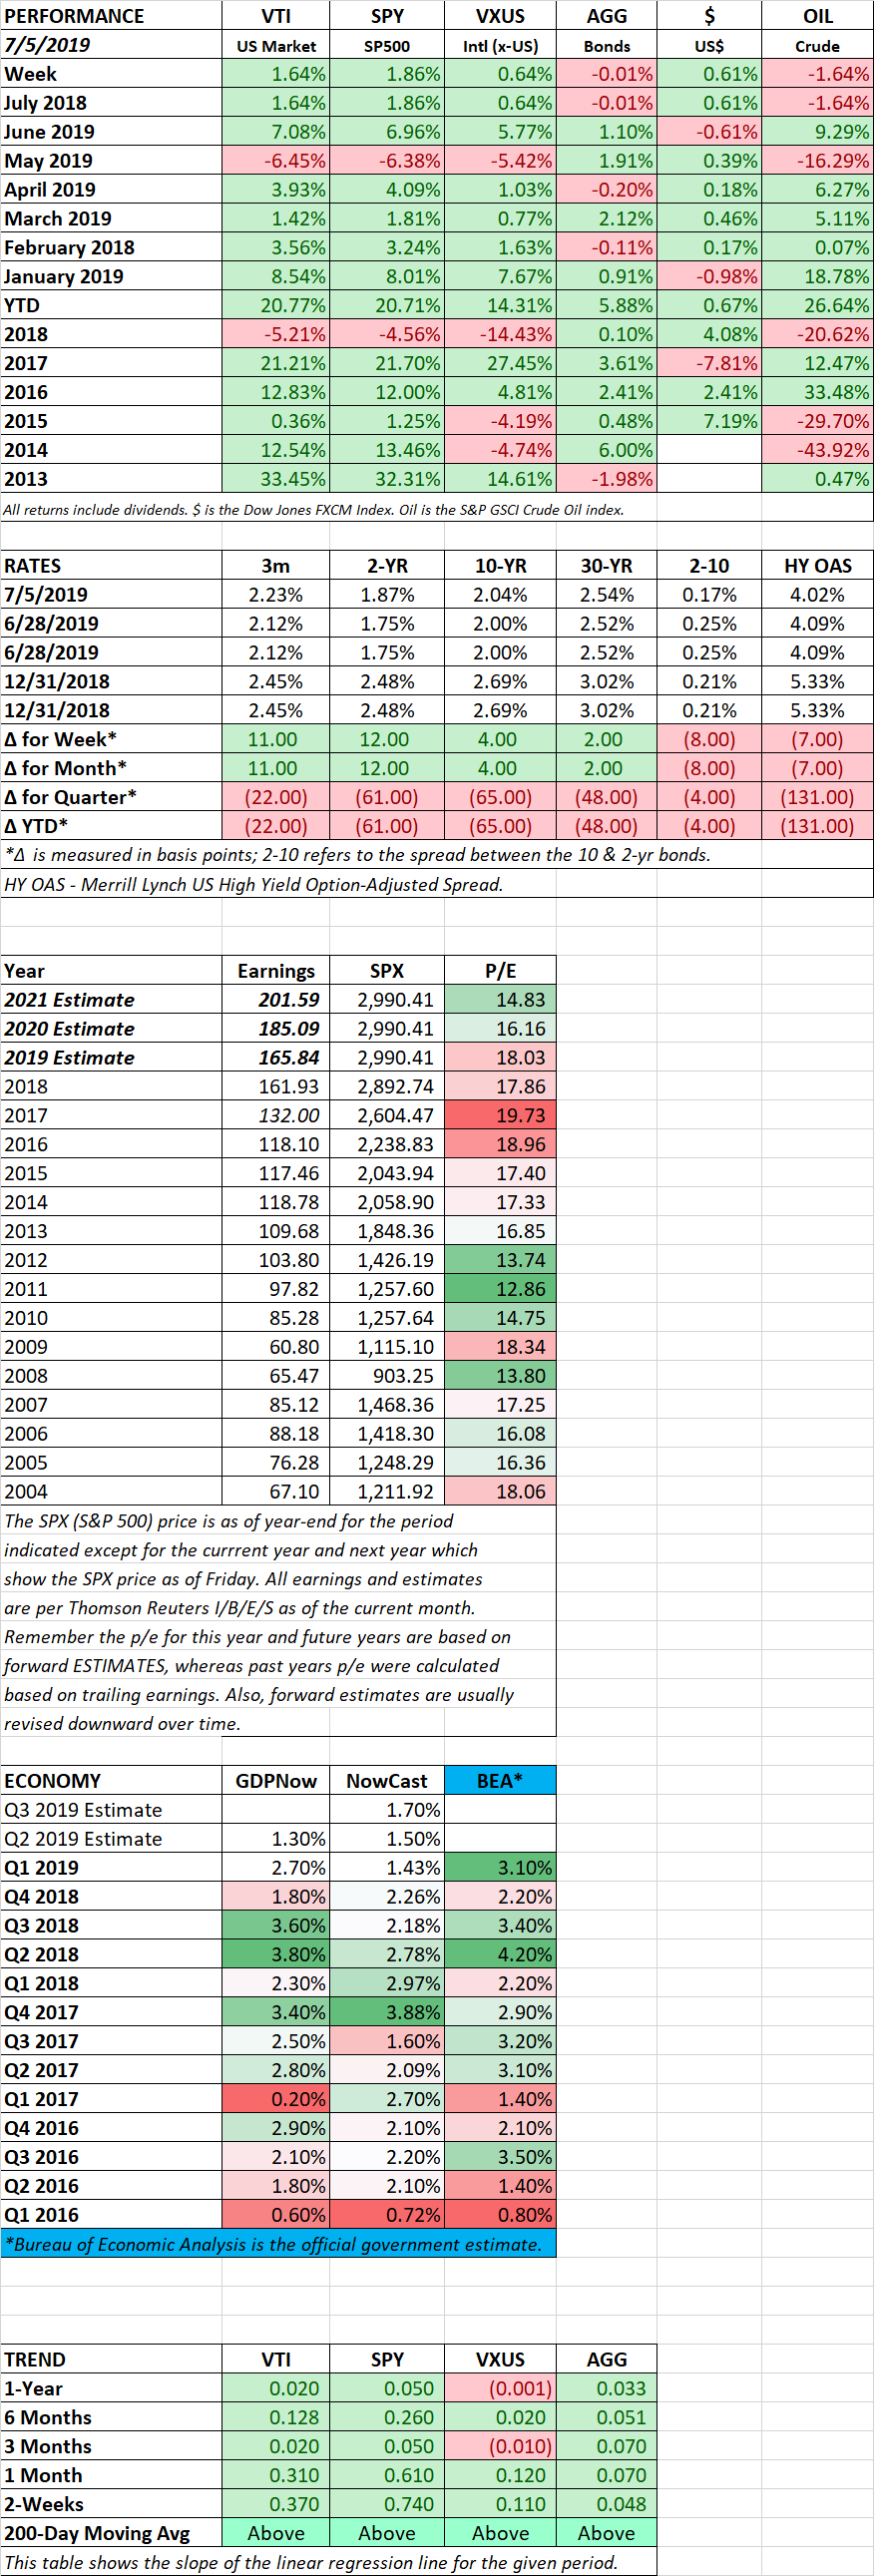
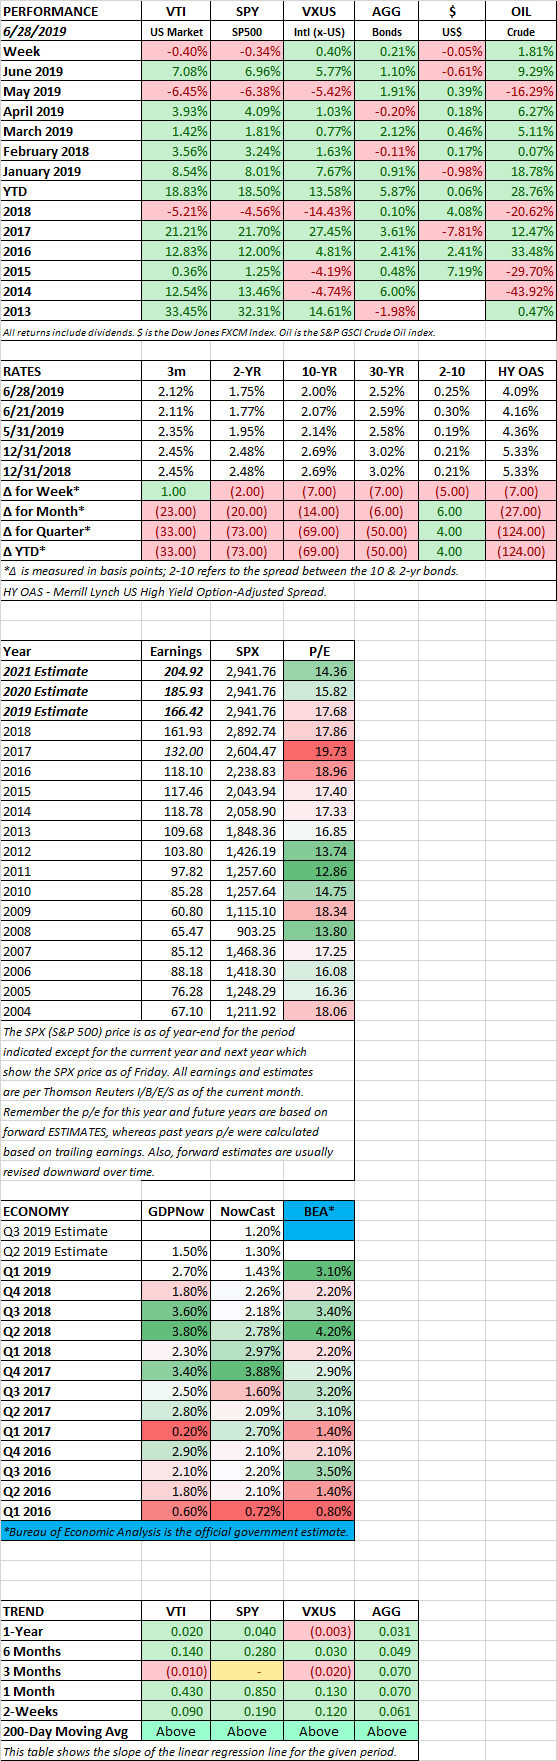
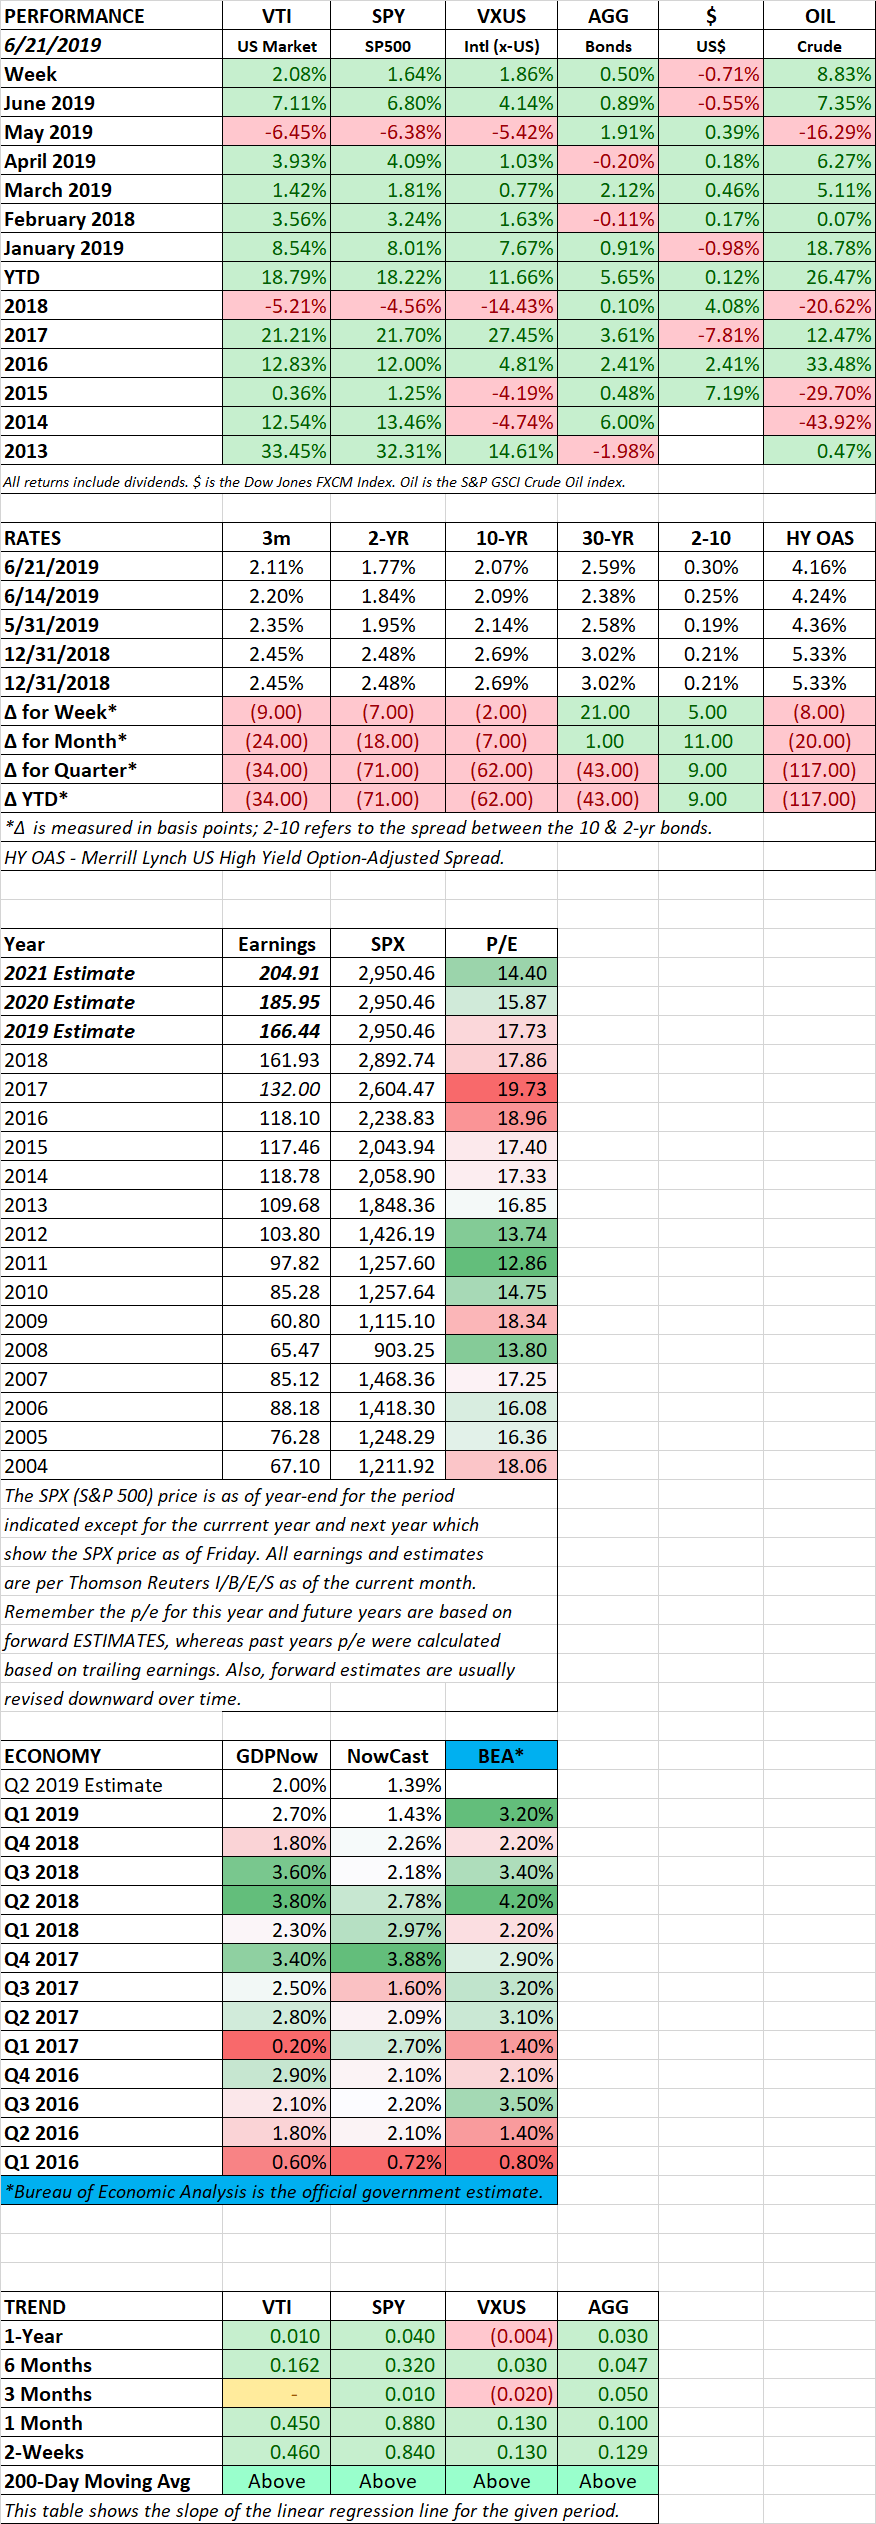
SCOREBOARD