Week Ending 5/11/2018

HIGHLIGHTS

  • US equities were up by 2.5%.
  • Mild CPI report.
  • There are more job openings than unemployed, first time ever.
  • Oil prices continue to rise.
  • But there are signs that growth is beginning to slow globally.

MARKET RECAP

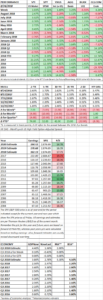
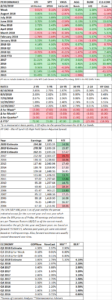
It was almost like the good old days (of 2017), the market shrugged off negative news and marched steadily higher. US equities were up 2.5% and international stocks were up 1.4%. US stocks are now up 2.8% for the year. Bonds were flat.

The chart below, from John Murphy at Stockcharts.com, shows that economically sensitive transports have recently been outperforming utilities, a positive technical sign.

Financials have also broken out of a recent consolidation range to the upside. Markets were helped by a mild CPI report. The index was up by 0.2% in April and the core CPI increased by only 0.1%. Total CPI is now up 2.5% year over year and the core is at 2.1%.

JOBS

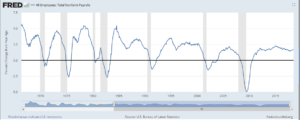
The Labor Department reported that there were a record 6.6 million job openings in March. That is enough so that theoretically, every unemployed person could have a job, the first time that has ever happened. Of course, skill and location mismatches make that impossible. But it is an indication of a continued strong job market.

OIL PRICES ON THE RISE

Oil prices have continued to rise, outpacing analyst estimates, as production cuts by OPEC have reduced inventory levels and Mideast tensions increase. Prices broke the $70 barrier.

SIGNS OF SLOWING GLOBAL GROWTH

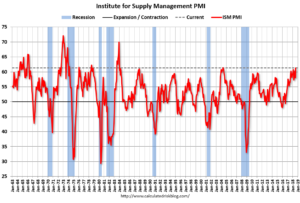
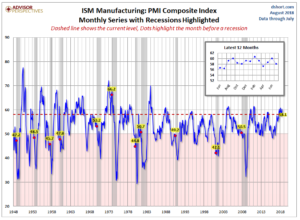
Capital Economics estimates that export growth in China fell 2% in April, the largest drop in nine months. Copper prices are down 6% year to date, copper is a bell weather for growth in Asia. And purchasing managers’ indexes for manufacturing, while still in expansionary mode, have declined from peak levels in the US, Europe, China, Japan and South Korea.

SCOREBOARD

Week Ending 5/4/2018

HIGHLIGHTS

  • A Friday rally save the markets from a deep decline, falling just 0.27% for the week.
  • Unemployment drops to 3.9%.
  • Tariffs aimed at some trading partners postponed for one month.
  • An unusual conference call for Tesla does not add to confidence.
  • Inflation hits the Fed’s target.

MARKET RECAP

A strong Friday rally, +1.29%, saved the equity markets, turning what would have been a bad week into a small decline, just 0.27% in the US and 0.54% outside the US. At the Thursday low, the market was down 2.67% for the week and below the 200-day moving average. Stocks have now bounced off the 200-day three times. And at least so far, each successive test formed a higher low. By no means are we ready to call an “all-clear”, but so far, so good.

EMPLOYMENT

Unemployment fell to 3.9%, the lowest level since December 2000. Employers added 164,000 jobs. It was the 91st consecutive month of job growth, the longest streak on record. Average hourly pay was up by 2.6% year over year.

TARIFFS

The White House will delay a decision on tariffs targeted at the European Union, Canada, and Mexico for one month. A US delegating went to China to see if the countries can come to an agreement.

TESLA

In one of the more bizarre conference calls of all time, Elon Musk cut off legitimate analyst questions in a condescending manner, leading to speculation that the company is beginning to feel the heat from its cash drain. Pressure is mounting on the automaker as Moody’s estimates Tesla will need to raise another $2 billion to cover the 2018 cash burn and to refund convertibles that mature over the next two years. Tesla bonds are now trading as “junk” level.

INFLATION

The PCE Price Index rose 2%, year over year, hitting the Fed’s inflation target. This suggests that the Fed will remain on the path of increasing interest rates.

SCOREBOARD

Week Ending 4/27/2018

HIGHLIGHTS

  • US and international stocks down by about 0.10%.
  • “Peak earnings” was the term that was passed around last week.
  • The 10-year Treasury ends the week flat but finished higher than 3% Tuesday, Wednesday, and Thursday.
  • The highest level of backorders since 2014.

MARKET RECAP

The US and international equity markets were down by about 0.10% on the week. Companies continued to report blockbuster earnings, even better than expected, but that was not enough to move stocks higher.  That was due to the fear of “peak earnings”, as in “it doesn’t get any better than this”. Those were the words that were tossed around all week. It is not that investors expect a recession in 6-months, but the rate of acceleration in earnings growth has probably peaked. The Caterpillar CFO, in a post-earnings conference call, said Q1 earnings would be the “high water mark for the year,” that helped send the Dow on a 400-point tailspin on Tuesday.

But it wasn’t just the fear of “peak earnings” that spooked the market. Give some credit to higher interest rates. The 10-year Treasury topped the 3% mark on Tuesday, Wednesday, and Thursday, only to close at 2.96%, the same rate as the previous Friday. A 10-year Treasury yielding greater than 3% presents competition for equities. On one hand, the market fears a flattening yield curve, represented by static long-term rates and rising short-term rates, and then when they get the opposite, with long-term rates increasing, they are still not happy.  A flattening yield curve stirs up thoughts of a recession down the line, while a steepening curve could indicate inflation.

GDP

The government reported the first estimate of GDP growth for Q1 at 2.3%. That was above estimates but lower than the 3% growth rate for the final 9-months of 2017. For the past few years, Q1 has been the slowest quarter of the year. So if recent trends hold true, GDP should expand from here.

ORDER BACKLOGS HIT HIGH

The Institute of Supply Management (ISM) reports the highest backlog of orders in manufacturing since May of 2004. Supply chains are having difficulty keeping up with the demand. The same problem is occurring overseas, a shortage of labor and equipment are limiting production.

SCOREBOARD


Week Ending 4/20/2018

HIGHLIGHTS

  • Equities were up by 0.67% and are now positive for the year.
  • The spread between the 10 and 2-year treasury hit the lowest level since 2007 on Tuesday at 41 basis points.
  • The yield on the 10-year treasury closed at its highest level since January of 2014.
  • Earnings reports have been strong and the forward p/e on the SP500 is now 16.6.
  • An IMF report shows the magnitude of the US deficit problem.

MARKET RECAP

Equity markets rallied on the week, US markets were up by 0.67% and international stocks increased by 0.14%. The rally was good enough to turn US equities positive for the year. But stocks are by no means out of the woods. Stocks advanced on Monday, Tuesday, and Wednesday, but fell on Thursday and Friday. And when looking at a weekly chart, if this coming is week is down, that would be two successive lower highs. Support in the 253-255 level is still crucial to prevent what could turn into a bigger decline.

Interest rates were in the news this week. The spread between the 10 and 2-year Treasuries fell to 41 basis points on Tuesday, the lowest differential since August of 2007. But the 10-year yield jumped higher on Thursday and Friday to close at 2.951%, to widen the spread all the way up to 50-basis points, basically even with the year-end value at 12/29/2017 of 51. The10-year’s closing yield of 2.951% is the highest for this year and the highest since January of 2014. As interest rates rise, all other things equal, investors will have the incentive to move from equities to fixed income, pushing down p/e ratios.

EARNINGS

Earnings reports continue to be positive. Q1 earnings should now be up by 20% according to Thomson Reuters. About 80% of companies reporting so far have beaten estimates and 71% have topped sales estimates. The current forward p/e is 16.6, a somewhat reasonable level.

US DEFICITS

Exploding US deficits are starting to seep more and more into the news. The two graphs below show the magnitude of the problem. An IMF report shows the US is the only advanced economy expected to show an increase in the debt-to-GDP ratio over the next five years.

The chart below shows how the cost of paying off just the interest on federal debt is going to massively increase in coming years, hitting north of 20% in future years. That is up from the 2017 number of 8.1%. Only Italy currently pays more.

If the recent tax cuts do not generate the hoped-for growth in the economy, taxes will be increased at some point in the next few years.

SCOREBOARD


Week Ending 4/13/2018

HIGHLIGHTS

  • Chinese leader Jinping says he will relax barriers to trade.
  • Trump to reconsider entry into the TPP.
  • Stocks move up by 2%.
  • Earnings season off to a good start.
  • The CBO projects that deficits will explode higher sooner than anticipated.
  • Crude oil hits a three-year high.

MARKET RECAP

It was another week filled with non-stop news. Two Saturdays ago, on April 7, the Syrians launched a vicious chemical attack on their own citizens. On Sunday, Trump said that there would be a “big price” to pay. On Monday, the FBI raided the office of Trump’s personal attorney, Michael Cohen, as part of a wide-ranging corruption investigation. Also, on Monday, the CBO released their latest budget projections. On Tuesday, Chinese leader Xi Jinping promised to relax barriers to trade. And then House Speaker Paul Ryan, announced that he will not run for reelection. Ryan was one of the only members of Congress to even talk about the threat of the budget deficit. Then on Thursday, Trump said he was open to rejoining the Trans-Pacific Partnership. Friday night, hours after the market closed, the US, along with Britain and France made good on Trump’s promise earlier in the week, launching missile attacks against Syrian facilities used for chemical weapons storage and research facilities.

It was Jinping’s comments about trade that moved the market the most. Stocks jumped by 1.62% on Tuesday on his remarks. For the week, US stocks were up 2.02% and international stocks were up 1.77%. Oil advanced by 8.59% and bonds were down slightly. The 2-10 yield curve dropped to 45 basis points.

From a technical perspective, the market held above support and above the 200-day moving average. However, on every day except Tuesday, stocks closed near their low for the day.

EARNINGS

Earnings season got underway. According to Thomson Reuters, of the 30 S&P 500 companies that have reported earnings so far, 70% have beat expectations. That is above the 64% long-term average, but below the average for the last year of 75%. The forward p/e is now at 16.4.

DEFICITS

The nonpartisan Congressional Budget Office announced that US budget deficits will cross the trillion-dollar mark in 2020, two years sooner than previous projections. And that is based on optimistic assumptions such as 3.3% growth this year, unemployment of 3.8% this year and 3.3% next year. In percentage terms, the deficit this year will be 4% of GDP, an increase over the 3.5% last year. By 2019, the deficit will be 4.6% and eventually peak at 5.4% in 2022. But in an “Alternate Fiscal Scenario”, the CBO sees a 6% deficit in 2022 and debt in excess of 100% of GDP by 2027. Both of these projections assume no recession, an unrealistic assumption if there ever was one.

The deficits are blowing up because of the recent Trump tax cuts as well as a wave of red ink that is about to arrive due to the structural problems with social security and Medicare. The US is going to be forced to reverse in some manner the recent tax cuts down the line. And politicians on both sides of the aisle have refused to deal with the structural deficit problems for decades now.

TRADE

In a reversal of trade tensions, Chinese leader Xi Jinping announced on Tuesday that he would reduce tariffs on cars, improve protection of intellectual property and open up the financial industry. And then on Thursday, Trump said he would consider rejoining the Trans-Pacific Partnership (TPP). This was after Trump pulled out of the deal after becoming President, and after spending a good portion of his campaign railing against the TPP. Part of the President’s reasoning might be the threat posed by a rising China. American entry into the TPP, if the other countries would even take the US back in, would be a smart economic and strategic tie-in with one of the fastest-growing regions in the world.

CRUDE OIL

Oil prices ended the week at a three-year high on strong demand and geopolitical tensions. As shown below, the oil glut has worked its way through the system and supplies are back to more normal levels. The threat of military action in Syria and tensions with Iran are also pushing prices higher. In its Friday report, the International Energy Agency (IEA) said that it expects demand for oil to grow by 1.5 million barrels a day in 2018. On top of that, oil production by OPEC nations has been trending lower

SCOREBOARD

Week Ending 4/6/2018

HIGHLIGHTS

  • Stocks fall by 1.36%.
  • Equities are in a dangerous spot from a technical perspective.
  • Trade news has the market in a tug of war.
  • Employment numbers were below estimates.

MARKET RECAP

Equity markets were in a tug of war all week over trade news, moving up and down, finally finishing the week off by 1.36%. International stocks dropped by 0.87%. The market has now moved intraday by more than 1% in 9 of the last 11 sessions, that is more than all of 2017. Prices are back again to their 200-day moving average, a marker used by many technical analysts to determine if the market is in bull or bear mode. Equities are also close to breaching through support, a dangerous condition that led to falls in 1962 and 1987 when the economy was not in recession mode but did carry similar valuations.

Bonds fell by 0.09%. The 10-year treasury yield increased by 3 basis points to 2.77%.

TRADE

The Trump administration seems to be doing everything possible to derail the economy and the markets as tensions flare between the US and China over trade. It is true that China does not operate by the same rules as the US in many regards. Chinese trade policy forces technology transfer, takes US intellectual property, forces American companies into partnerships with Chinese entities, and imposes steeper tariffs on American imports than the other way around. But at the same time, China has been moving in the right direction, albeit slowly. And the Trump playbook of publicly attacking Chinese trade policy may not work from a cultural perspective and might box the Chinese into a difficult spot. Unfortunately, this is how trade wars start. The hope is all these threats and tariffs will lead to real negotiations that can produce a fair agreement before more serious damage is done.

Make no mistake about it, there are no winners in an all-out trade war. As most Americans should remember from their middle school or high school education, a contributing factor and perhaps the main factor in the Great Depression was the Smoot-Hawley tariffs of 1930, which led to a full-scale trade war and a subsequent collapse in economies around the world.

For now, the conventional wisdom is that we are not close to a trade war. That common sense and good economic policy will prevail, and that this will all work out in the end. We hope so but are not so sure. A lot of this market rally has been based on optimistic earnings projections, and the threat of a trade war or its eventual implementation will start bringing down forecasts which would bring down equity prices. At that point, the economy could reach a tipping point that could accelerate the start of the next recession. That would also be political suicide for team Trump.

For now, earnings forecasts remain steady. But as the earnings season shortly begins, it will be interesting to see how companies comment on how future business might be impacted.

The market is hypersensitive to a trade war threat. Equities moved up and down all week as the trade news flipped from negative to not so negative and then back to negative (see below).

EMPLOYMENT

Non-farm payrolls increased by 103,000, much less than the 178,000 estimate. However, the longer-term trend is very positive, plus 202,000 per month over the last three months. Unemployment remained steady at 4.1%. Average hourly earnings were up by 0.3% for the month and are now up 2.7% year over year. The average workweek stayed the same at 34.5 hours.

SCOREBOARD

Week Ending 3/30/2018

HIGHLIGHTS

  • Support holds as equities manage a 2% advance.
  • Markets are still stretched looking at a quarterly chart.
  • Tesla takes a hit in both the equity and fixed income markets.
  • The yield curve flattens as interest rates decline.
  • A comparison between the post-election equity markets after Kennedy won in 1960 and today.
  • Economic news was good this week.

MARKET RECAP

Equities bounced off the 200-day moving average and increased by about 2% in the US and 2.43% outside the US. For the month, US stocks were down by 1.96% and international stocks fell by 0.38%. Year-to-date, US and international equities were down by 0.71% and 0.21% respectively. It was the first losing quarter since Q2 of 2015.

Even with the loss, looking at a quarterly chart (see below) from a technical perspective, the market still looks overbought. The relative strength index (RSI) on the top of the graphic, shows a current reading of 80.91. A measurement over 70 is considered overbought, which could mean a pause or a fall for stocks. Or it could mean nothing at all, as evidenced by the market’s performance in the 90s, when it continued to advance despite being labeled as overbought for a good portion of the decade.

Tesla, a high flyer for most of the past few years, closed the week at $266.13 and is now down 31.87% from its September high of $385. Tesla bonds have been falling in value as higher interest rates and negative cash flow are starting to spook investors. Tesla will most likely have to tap the equity or bond markets at a future point if cash continues to burn up. Facebook, which is off by 17.25% from its January high, managed a small gain for the week.

Bonds were up for the week and the month. The aggregate increased by .60% for the week. Bond yields fell across the curve, but the decline was greatest on the long end. The spread between the 2 and the 10-year treasury declined to 47 basis points, that is the lowest difference of the year and has brought back fears of a flattening yield curve. Most recessions are preceded by a flat or negative spread.

TRUMP V KENNEDY

Comparisons have been made between the market run-up post-election in this cycle and a similar advance after Kennedy won in 1960. In both cases, the market flew higher after the election. And in each case, the economy was growing with no near-term signs of a recession. Valuations were similar, with p/e ratios in the 22+ range.

From the day before each election, until the end of the third quarter, the Kennedy market rallied by 26.20% as measured by the S&P 500. That compares to the current Trump rally of 26.41%. A mere difference of 21 basis points. It is what happened next in 1962 that is of interest.

Last week, the current US market bounced off a double bottom (see C & D below). That may or may not hold. In 1962, a similar double bottom (see A & B below) was broken and the market fell hard through June by 22.95%. From the December 1962 high, the decline was 28%. The good news was that the market then went on for a huge rally and had matched the December 1962 high by September of 1963 and would have a strong advance from there. A testament to why a long-term view is often the better approach.

We are not saying that we will get a repeat of 1962 here in 2018, but the comparison is striking. And it is always good to look back at history to see what has happened before.

ECONOMIC NEWS

For the most part, the economic news was positive. The estimate for Q4 2017 growth was raised to 2.90% from 2.50% by the Bureau of Economic Analysis. Initial jobless claims were 215,000. That is the lowest number in 45-years. And estimates for Q1 growth were raised by the Atlanta Fed to 2.40% from 1.80%. The NY Fed Nowcast model has growth at 2.71%.

SCOREBOARD

Week Ending 3/23/2018

HIGHLIGHTS

  • Stocks take a major hit as US equities fall by 5.66% and international equities drop by 3.55%. US stocks are down 2.62% for the year.
  • The market is selling right at its 200-day moving average and close to the lows from February.
  • LEI is up again. Strong PMI reports and low initial claims for unemployment.
  • More disarray at the White House.
  • Trump and China both announce new tariffs.
  • Facebook data was misused in the 2016 election as calls for regulation increase.
  • A government funding bill totals $1.3 trillion and adds more to the deficit.
  • LIBOR has been increasing at a rapid rate.
  • The Citi Surprise Index for the Eurozone is at a two-year low.
  • FHA delinquencies increase.

MARKET RECAP

It was a brutal week for the markets as US equities fell by 5.66%. The Nasdaq Composite dropped 6.5%. International stocks dropped by 3.55%. US stocks are now down 2.66% for the year. Even though treasuries dropped a few basis points across the curve, the aggregate bond index also fell, by 0.08%. Crude oil rallied by 5.68%.

Market technicals have not been good. On Thursday and Friday, stocks opened close to their high for the day and then sold off and finished very close to their low for the day. The market is now at its 200-day moving average and close to breaking the lows from the February sell-off.

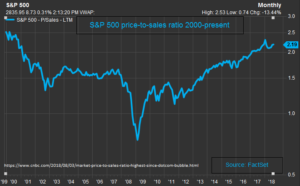
One bright point is that the SP500 is now selling as 16.4 times 2018 estimated earnings, a more reasonable value.

There are lots of reasons to explain the fall. We explain the good and the bad below.

THE GOOD

Economic reports continue to show strong growth ahead. The Conference Board’s Leading Economic Index (LEI) was up by 0.6% in February and it was the fifth consecutive month with an increase. Eight of the ten LEI components made positive contributions and all indicators posted gains over the past six months. The six-month rate of change of rose to 4.0%, its fastest pace since March of 2011. Year over year,  the LEI was up 6.5%, the most since July 2014.

The Markit U.S. flash Manufacturing Purchasing Managers Index (PMI) increased by 0.4 points to 55.7, its highest level in three years. The flash Services PMI fell 1.8 points to 54.1, still in expansion mode. New orders were close to a three-year high.

Initial claims for unemployment insurance were up by 3,000 last week to 229,000 and the four-week average of claims was 223,750, close to its lowest level since 1973, as labor markets.

THE BAD

The market is being hit on multiple fronts, many self-induced.

THE WHITE HOUSE

We wrote about this last week. It is hard to ignore the turnover and complete disarray in the White House. Trump’s primary outside lawyer, John Dowd, resigned. A clear indication, not necessarily that Trump is guilty, but something just is not right about working for the White House. Then Trump fired National Security Council Chief General H.R. McMaster and replaced him with John Bolton. Bolton is considered an extreme hawk. These changes are on top of an avalanche of other changes in prior weeks and indicate serious problems and mismanagement in the Executive office.

TARIFFS

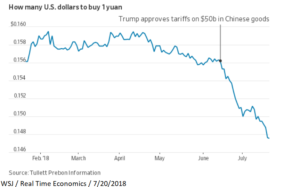
Trump announced that he would impose tariffs on about $60 billion of Chinese imports, in addition to the already announced tariffs on aluminum and steel. China responded announcing it would levy about $3 billion in tariffs on U.S. goods. We have the beginning of what could turn into a trade war. That is what is the market fears.

The U.S. does have legitimate complaints about the way China, and some other countries handle trade. China has stolen intellectual property and forced technology transfer, among other violations. But the government should be doing everything possible to negotiate free trade in China and around the world, to eliminate restrictions, and let companies compete on a fair plane. Work to open markets, not close them.

The question is this, is the tariff plan a negotiating tactic by the Trump administration to force open Chinese markets? Or is it the start of a much bigger and deeper effort to stifle imports, close markets and to bring down the trade deficit. If it is the ladder, and if this escalates into an all-out trade war, the world is in for some darker times.

Even if it does not turn into an all-out trade war, tariffs can impact the intricate supply chains that businesses have built up over decades. Changing supply chains that will result in less efficient commerce translates to lower profits, and lower profits usually mean lower equity prices. So far, the overall tariff numbers being bandied about is not that significant, but for now, the real damage can be the psychological spillover effect.

FACEBOOK

The week got off to a bad start on Monday when it was revealed that Facebook data was utilized to sway voters in the 2016 election. Apparently, this is news. Cambridge Analytica, a vendor of the Trump campaign, used data that it was not supposed to have in their efforts to help elect the President. Millions of users had their privacy data violated, leading to calls from across the spectrum (political and business) for regulation in the social media space and especially at Facebook. Facebook fell x% on Monday to lead the market down and finished off by 14% for the week.

FUNDING THE GOVERNMENT

Trump signed a 2,232-page bill that will fund the government through October. The bill authorizes the spending of $1.3 trillion and further blows up the deficit. This, at a time of economic expansion when the budget deficit should be declining. More deficit spending means a larger supply of treasuries, on top of the already expanded supply to fund the roll off from Fed’s balance sheet. More bond supply requires higher interest rates to attract investors, and higher interest rates results in competition for investing dollars with equities, a negative for the stock market.

LIBOR/FED

On Wednesday, as expected, the Fed raised rates by a quarter point to between 1.5% and 1.75%. However, the interest rate news that was more troubling involved the London Interbank Offered Rate (LIBOR). Libor impacts borrowers worldwide and has been increasing at a rapid rate, now at 2.285% up from 1.69% at the end of 2017.  Higher libor costs will flow directly to the bottom line and especially impact companies that are levered up or operating on tight margins (see our commentary last week on the danger of debt). Libor’s sharp rise is due to (1) the Fed roll off, (2) repatriation of cash from overseas, (3) share buybacks and (4) economic tension around the globe from the US tariffs and the threat to the global trading system. Banks were hit particularly hard this week, as rising interest rates on the short-end and falling rates on the long end can begin to squeeze margins.

EUROPE

Economic reports have been coming in less than expectations recently in Europe. That might be due to more optimism than was warranted. The Citi Economic Surprise Indicate for the Eurozone is now at its lowest level in the last two years.

DELINQUENCIES

The FHA delinquency rate increased by 0.39% to 9.41%, excluding the areas impacted by hurricanes. This should not be happening when the economy is supposedly improving and suggests credit terms have been too easy.

SCOREBOARD

Week Ending 3/16/2018

HIGHLIGHTS

  • US equities fall by 1.14% but bonds rally.
  • The yield curve flattens.
  • Mayhem continues in the White House.
  • Inflation is at bay for now, economic reports were mixed.
  • Two high profile bankruptcies.

MARKET RECAP

US equities fell by 1.14% and international stocks were down 0.61%. The SP500 closed the week at 2752.01, just about halfway between its closing high and low for the year. Bonds managed a 0.31% rally. The yield on the 2-year note increased by 4 basis points but the 10-year and 30-year yield fell by five and eight basis points, accounting for the increase in bond prices. That means the yield curve has begun to flatten again and is only three basis points away from where it started the year (looking at the difference between the 10-year and the 2-year). Bond prices have begun to stabilize, and for the first time in a while, the trend is either up or flat on 2-week and one-month basis, instead of down across the board.

MAYHEM IS EVERYWHERE

Mayhem, you can find it in every State Farm commercial and in the White House. Chief of Staff John Kelly was rumored to be out, but a supposed truce will keep him temporarily in place. Word is that General McMaster, the national security adviser will exit soon. Secretary of State Rex Tillerson was terminated via a Tweet during the week, to be replaced CIA Director Mike Pompeo. Gary Cohen, who ran the National Economic Council, left last week opening the door for Larry Kudlow. That is on the human resource side.

Special Counsel Robert Mueller issued a subpoena to the Trump Organization, demanding information about Russia. A former consultant misused Facebook data on millions of citizens. Infighting over tariffs continues.

This is supposedly the preferred management style of the President. But he might want to consider the consequences, Republicans continue to lose seats they should be winning, including this week in Pennsylvania where Democrat Conor Lamb won a special election in a district that Trump won by 20 points last year, despite personal campaigning by Trump.

ECONOMY

The CPI numbers came in as forecast at a reasonable 0.2%, keeping the inflation scare at bay for now. Housing starts and building permits were less than estimates, but manufacturing data was better. Employment reports continued strong, initial claims for unemployment were a low 226,000 and the JOLTS Job Openings survey hit a new record high.

The Atlanta Fed’s GDPNow model continues to fall, now at 1.8% growth for Q1. And the NY Fed’s Nowcast is at 2.73% estimated growth.  The slowdown in growth estimates has not been felt by small business owners, the NFIB Small Business Optimism survey rose to 107.6, the highest reading since September of 1983 and the third highest reading ever.

BANKRUPTCIES

The poison of high debt often turns deadly, and that has been the case with a couple of high-profile companies this past week. iHeartMedia (IHRT), formerly Clear Channel Communications, filed for Chapter 11 bankruptcy burdened by $20 billion in debt. IHRT was loaded up with debt by private equity firms Bain Capital and Thomas H. Lee Partners when they bought the firm in 2008.

Toys ‘R’ Us, already in bankruptcy, announced they would close or sell their remaining stores. It is the end of an era for what was once an American retail icon. Toys were taken down by multiple factors, but you can count Amazon and a balance sheet loaded with debt as the main reasons.  KKR, Bain, and Vornado paid $6.6 billion in 2005 for the chain in a deal financed primarily with debt. Toys ‘R’ Us was spending more than $400 million per year to cover its financing costs. “These substantial debt service obligations impair the company’s ability to invest in its business and future. As a result, the company has fallen behind,” CEO Dave Brandon previously told the bankruptcy court.

As interest rates rise, there will be more stories like these. Years of artificially low-interest rates and easy money have resulted in poor business decisions and companies that are hanging on by a thread, encumbered with high debt. Ultimately, the economy and productivity should benefit from the process of creative destruction, but there will be disruptions along the way.

SCOREBOARD