MARKET RECAP
Stocks were up for the week but down on Friday on worries that Trump was planning to go forward with more tariffs on Chinese imports and on reports that the US and Canada were not able to reach a trade deal as hoped for.
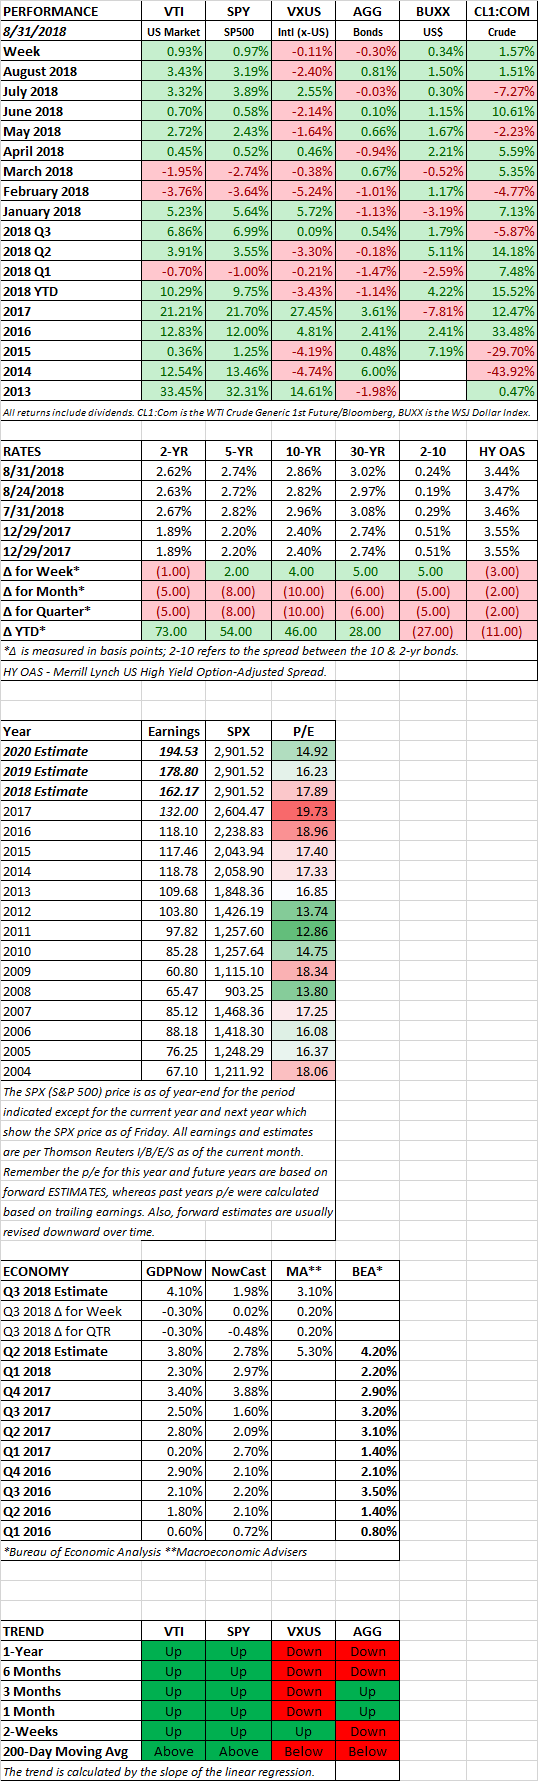
For the week, US stocks were up 0.93% and international stocks fell by 0.11%. Bonds dropped by 0.30%. August was another good month for US stocks, +3.43%, while international stocks fell by 2.4%. Bonds were up 0.81% for the month. The NASDAQ had its best August performance in 18 years, +5.7%, powered by Apple (+20%), Amazon (+13%) and Netflix (+9%).
A strong economy coupled with strong profits has been the main driver behind this market. The GDPNow model from the Atlanta Fed is projecting Q3 growth at 4.1%, Macroeconomic Advisors is at 3.1% and the NY Fed’s Nowcast is at 1.98%. Meanwhile, corporate profit projections continue to improve for 2018, 2019 and 2020. They are up by 0.67%, 1.29% and 0.69% from 13 weeks ago (one-quarter of the year). However, the rate of change has been falling in recent weeks.
US / MEXICO
The US and Mexico came to terms on an updated NAFTA agreement. The agreement would lessen dispute resolution measures and would require higher paying jobs in auto-factories. The focus then turned to wrap up a deal with Canada by Friday but that did not happen.
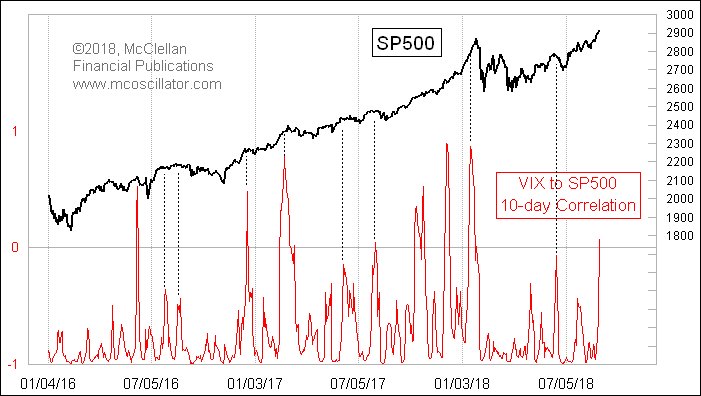
VIX and STOCK MARKET RISE
Something of interest, which might be nothing, is that the volatility index (VIX), often called the fear index, rose this week in tandem with stocks. Normally, there is a negative correlation. When stocks go up, the VIX normally goes down, and the opposite. But recently there has been a positive correlation. The last time that happened was right before the correction we had earlier this year. This correlation has sometimes occurred before previous sell-offs as well as shown below.
YIELD CURVE
New research based on the yield curve from the San Francisco Fed shows that the risk of a recession is rising but a downturn is far from certain. As the difference between short and long-term Treasury’s narrows, there is growing likelihood that the curve will invert, meaning that short-term rates will yield more than long-term rates. While the two and ten-year Treasury’s are most commonly discussed when determining yield curves, the San Francisco Fed says that the difference between the 10-year and the three-month bill is the more useful indicator. While the 2-10 spread is tight at 24 basis points, the difference between the three-month and ten-year is much wider, at 75 basis points.
SCOREBOARD