Week Ending 4/17/2020

HIGHLIGHTS

  • The best two-week rally since 1938.
  • Trump outlines guidelines to reopen the economy.
  • Economic stats get worse and worse highlighted by 5.2 million more unemployment claims.
  • But the stock market is on a different page, up 31% from March 20th.
  • A detailed look at past bear markets.
  • History shows there is usually a retest of the lows.

MARKET RECAP

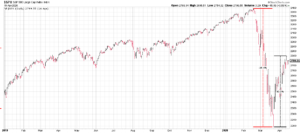
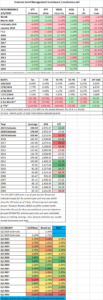
Stocks rallied by 2.71% in the US and 1.14% x-US. US equities have put in their best two-week gain since 1938. The market is now off by 16.4% from the February 19th high. Over the last year, the overall US stock market is down 1.5% and the S&P 500 is up 1.1%.

Trump said on Monday that he wants to open the country “ahead of schedule” and different groups of governors announced they would be working together to coordinate the reopening of their states. Trump initially said he is the one to make the decision on when the country reopens, citing no legal basis for his claim. Previously, when determining when the country “would close”, Trump left it up to the states, but he said that he determines when it reopens, “When somebody is the president of the United States, the authority is total,” which is counter to what we all know. Later in the week, Trump reversed himself and then said he would leave it up to the Governors, but did outline guidelines that seemed to be based on good science.

The economic news gets worse and worse. Retail sales fell by 8.7% in March, the biggest drop since 1992. The NAHB/Wells Fargo Housing Market Index dropped by 58%. The index measures builders’ perceptions of the market for single-family homes. It was by far the largest drop ever. However, their chief economist Robert Dietz struck an optimistic note, “As social distancing and other mitigation efforts show signs of easing this health crisis, we expect that housing will play its traditional role of helping to lead the economy out of a recession later in 2020.”

Unemployment claims increased by another 5.2 million and now total about 22 million. All of the new jobs since the last recession have been wiped out. The Empire State Index of Manufacturing fell to its lowest level ever. Industrial production suffered the biggest decline since 1946. The International Monetary Fund said this will be the worst economic downturn since the Great Depression.

Despite all of this, US stocks are up by 31% from the intraday low on March 20th. There are good arguments that this rally is for real and that the low is in. There has been unprecedented action by the Federal Reserve and the government putting trillions of dollars in to support the economy. The markets have already written off 2020 and are looking forward. There is some progress on therapeutics and vaccines that will eventually end the coronavirus. Interest rates are basically at zero thereby making stocks more attractive. And, history generally shows that if you have a long enough time horizon investors will be rewarded for owning stocks at this level.

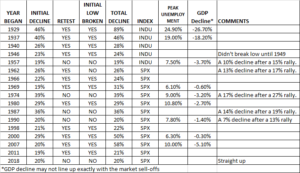
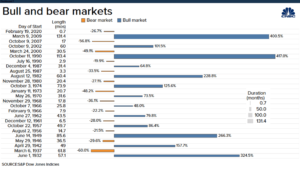
On the other hand, it would be very unusual for the equity markets to get away without a retest of the low, or something close to a retest. Below we take a look at the price action in bear markets since 1929.

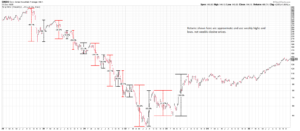
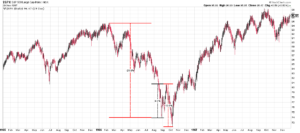
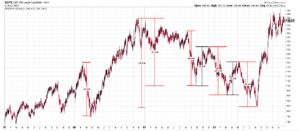
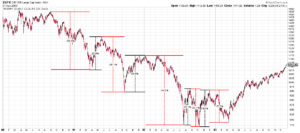
Last week we showed how in 1929, a 46% drop followed by a 50% rally, was just the set up for further declines. We show that chart again here:

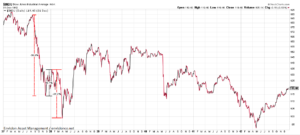
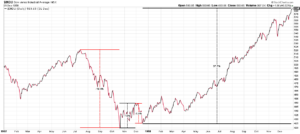
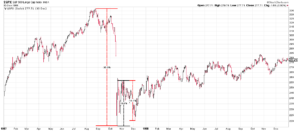
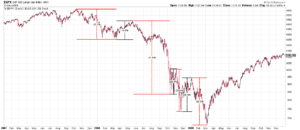
Here is 1937. Stocks fell by 40% from August through November, then rallied by 18%, and then fell another 26%. Overall, it was a 46% decline.

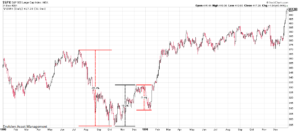
In 1940 when Hitler invaded France, stocks fell by 26%, rallied by 23%, then more or less went sideways for 9-months, down 16% and then up 12%, before falling another 28%. The overall decline was about 28%.

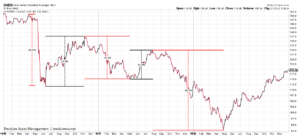
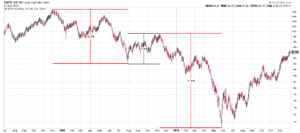
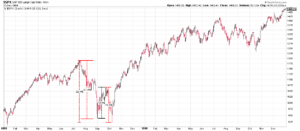
From May of 1942 until May of 1946, stocks increased by 129%. WWII ended in September of 1945, and by August of 1946, the postwar surge in demand fell off, the market dropped by 24% but it was highlighted by a 20% drop from August 12 to October 9th. The market then rallied by 12.8% and would fall again to test the lows, not once, but twice, over the next year. Then in the spring of 1948, a 17% rally was followed by a 16% drop that just took out the 1946 low. That set the stage for a rally into the 1950s.

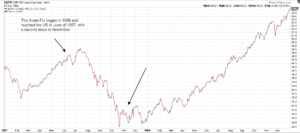
The Asian Flu of 1957, led to a 19% decline. The flu killed 70,000 people in the US across two waves, one started in June of 1957 and a second wave that was more severe started in November. After the market hit bottom, it continued to rally without a retest.

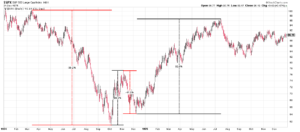
The selloff starting in March of 1962 and lasting until June of 1962 resulted in a 26% sell-off. This was also known as the “Flash Crash.” Business activity began to slow late in ’61, and the market sell-off accelerated when President Kennedy threatened anti-trust action and went after the steel industry. After the fall, stocks rallied by 15%, fell by 10% and then began an advance that lasted until 1966.

Early in 1966, stocks began to sell-off, in a series of small waves. Eventually, stocks dropped by 22%, rallied by 9%, and then would fall by just over 10% for a total 24% decline from the top. During this period, inflation was beginning to emerge, there was sharply higher government spending, Vietnam, and a tight Federal Reserve that led to a credit crunch.

In October of 1969, stocks would fall by 31% without a rally of any significance. When the market hit bottom in late May of 1970, stocks would begin a rally. Inflation was beginning to pick up.

From March of 1974 to October, the S&P 500 fell by 39%. Stocks then rallied by 26%, and then a 17% market decline. This was punctuated by the oil crisis and stagflation.

There was an 18% decline from February through March of 1980, the market rallied from there until November. This period was impacted by the spillover effects of inflation from the 1970s, there was another energy crisis in 1979 due to the Iranian revolution and tight monetary policy. After the interim rally, stocks would fall by 29% until August of 1982. Initially, stocks traded up and down in a range before an 18% drop than a 16% rally, a 17% drop, a 13% rally, and then a 16% decline.

The market crash of 1987 created a 36% fall, followed by a 19% rally, a 14% decline, and then the rally.

There was a 20% sell-off from July of 1990 until October, followed by a 13% rally and then a 7% decline. The Fed had raised interest rates in previous years, and an oil price shock due to the Iraqi invasion of Kuwait.

In 1998 stocks dropped by 22% from July until October. In between, the initial decline was 21%, the up 14%, and then down another 14%.

The 2000 crash led to a series of declines, rallies, and then further declines that ran through 2003.

Like in 2000, the Great Recession of 2007-2009 also had a series of rallies and declines.

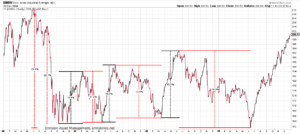
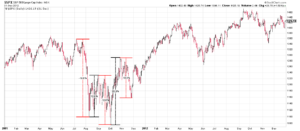
In 2011, stocks fell by 19% followed by a 12% rally, then a 12.6% decline to a new low, then up 20% and down 10% before a sustained rally.

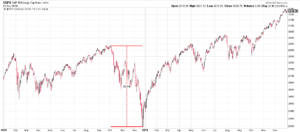
Finally, in 2018, there was a 20% decline in the last quarter of the year. Stocks rallied from there, and never retested the low.

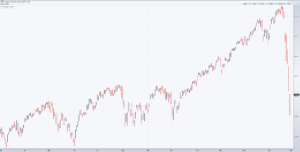
Which leads us to where we are today, a 35% decline followed by a 30% rally. Net net,  the market is down about 17%.

Of the 17 market declines we have shown above, the initial low was tested 12 times and that low was broken 11 times. Of the six times where the initial low was not tested, there was a sell-off of greater than 10% after the initial rally four times. Of the remaining two declines, in 1990, there was a 13% rally and then a 7% sell-off. The only time there was not a subsequent sell-off after the initial rally was 2018.

And then, if you look at the time periods, when there was a major economic downturn, 1929, 1937, and 2007, stocks had a substantial sell-off after the initial decline.

There are a lot of differences between now and the 1930s, mainly the aggressive government intervention and that medicine could put an end to this at some point in the next year or so, and we outlined some of the bullish case up above, but given history, there is a good chance the market we will test the lows (maybe break them) or come close to it.

SCOREBOARD


Week Ending 4/10/2020

HIGHLIGHTS

  • An incredible rally of 12.95%.
  • In five of the last seven weeks, stocks have been up or down by at least 9.5%.
  • US equities are now down only 14.83%.
  • Looking back at the 1930s and 2008, there can be significant declines after big rallies.
  • Economic numbers are simply terrible, 6.6 million file for unemployment and 16.8 million over the last three weeks. 10% of the workforce is unemployed.
  • But the Fed and the government are providing massive support and stimulus.
  • A possible plateau in new cases.

MARKET RECAP

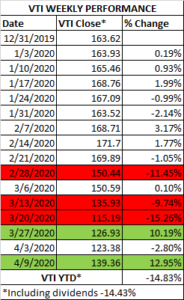
US stocks rallied by 12.95% and international stocks were up by 8.58%. For the US, it was the second time in the last three weeks that the market rallied by more than 10%. Looking back over the last seven weeks, stocks have either fallen or increased by more than 10% four times. And that does not include the week ending March 13th, when stocks just missed the 10% mark, falling by 9.74%, so if you round up that would be five of the last seven weeks.

Remarkably, for the year, stocks are now down only 14.83%, right between the 14 and 18% that they have fallen during previous pandemics. Of course, the previous pandemics, outside the Spanish Flu in 1918, have not been as severe as this one, and we would expect more volatility and more downside.

The VTI (US Total Stock Market) peaked on February 19th at $172.17, then fell to $111.91 on March 23. That was a drop of 35%. On Thursday, the VTI closed at $139.36, up by 24.53% from the low. So in that span of 50-days, equities have had a bear market (greater than a 20% drop) and a bull market (greater than a 20% rally), simply amazing.

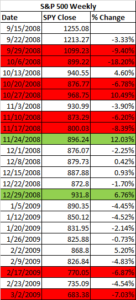
However, based on history, that kind of wild volatility is not exactly an all-clear signal. In 2008, there was a rally of 12.03% and then of 6.76% a few weeks later, in the midst of a continuing bear market.

And in the Great Depression, there were massive declines and rallies over a 2-1/2 year period between September of 1929 and March of 1932. In the chart below of the Dow Jones Industrial Average, by our count, there were 13 declines and rallies of greater than 15% until the market hit bottom, and most of the percent changes were much greater than that.

We don’t think we are going into a long-term depression like the 1930s, but at this point, we don’t think this is going to be a V recovery and we would expect more downside. Hopefully, we are wrong and stocks can stabilize and/or go up, but we would not count on it. Of course, no one knows. Equity investors should be thinking with a longer time horizon of at least 3-5 years. If your timeline is long-term, market declines are opportunities to take advantage of in small increments based on your overall risk tolerance and the appropriate capacity.

Jobless claims came in this week at 6.6 million, down from a revised number of 6.9 million the previous week. Total claims over the last three weeks are now 16.78 million. These are numbers never seen before. Auto sales for March were down by 35%, and April will be much worse. The Michigan confidence index dropped by 9.5%.  It is estimated that 10% of the US workforce is now out of work. That is what happens when you intentionally shut down the economy. Again the numbers will get worse from here at least over the near term.

On the other hand, the Fed continues to rollout program after program to support the economy. No one will ever say the Fed did not do everything possible to help. The government is supporting the economy with massive fiscal stimulus and more is on the way. The long term impact of all of these measures is up for debate, but this is one of the big distinguishing characteristics compared to the 1930s. The other one is that this slowdown was mandated by the government and that there should be an end date, when therapeutics and a vaccine end the epidemic. The question is how much damage has been done by then and how quickly can the economy recover.

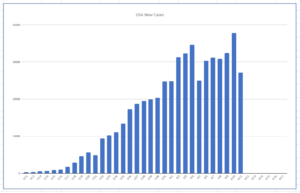
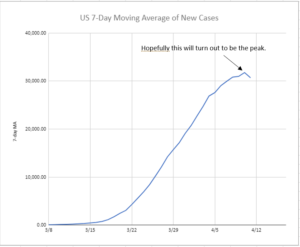
The USA might be plateauing in the number of new cases. It would appear the new case count is taking on the shape of a flatter bell curve as opposed to a steeper curve, which was the objective. USA cases did hit a new high on Saturday, which obviously is not good.

But despite that, if you look at a 7-day moving average, the US might have hit a peak. We emphasize the word might.

The US needs to get the economy moving again, even if it is in slow-motion at first, as soon as it is safely possible.

SCOREBOARD


Week Ending

MARKET RECAP

Stocks were up for the week by 10.74% in the US and 10.07% outside the US. On Monday, the Fed stepped in and said it would buy unlimited amounts of Treasury and mortgage bonds but the market shrugged it off, investors were more concerned that Congress did not seem close to passing a relief bill. Stocks fell by 2.84%. But that all changed on Tuesday, as stocks had their best day since 1933 as stocks soared by 9.48% on hopes that a massive stimulus deal was close to passing. Treasury Secretary Mnuchin and Democratic leader Chuck Schumer announced they were close to finalizing a deal. The rally continued on Wednesday (+1.30%) and on Thursday (+6.07%) before falling on Friday by 3.19%.

The three-day rally from Tuesday to Thursday was good for a 17.74% advance in the overall US stock market. But if you measure from the Monday low to the Thursday high, stocks shot up by 20.22%. It was the best three-day run since October 5 to October 8, 1931, when the Dow was up 22.33%. That is not the kind of company you want to keep, as that was in the heart of the Great Depression. From that point in 1931, the market went up another 10.4% until November 9 (up by 34.81% from October 5) and then stocks would fall by 64.71% until the Dow bottomed on July 8, 1932.

On Friday, Congress passed and the President signed a $2 trillion dollar federal relief package. That represents about 9% of GDP and its purpose is to keep some semblance of economic stability for the next few months. There will need to be more in the coming months.

The shutdown of the economy is a shock we have never experienced before. In the first week, unemployment claims went from 271,2000 to 3.28 million. There will millions more let go in the coming weeks.

Are we headed for a depression? The 1930s never saw any kind of government help especially like we are seeing now. With government support, the odds of a depression would be less, but we have never seen a forced shutdown of the nation. In a worst-case, if this virus keeps the nation and the world shut down for quarters, rather than weeks or a month or two, it cannot be ruled out.

We are going to take the positive view that the country will peak out in new cases sometime in April, cases will ramp down along the same timeline that they ramped up, and then widespread testing, tracing, quarantines, social distancing, and other common-sense measures can keep the virus under control at the same time the country, or at least parts of the country, can get moving again. And, more importantly, we get saved by science in the form of therapeutics and then a vaccine. That, plus government support, avert the worst and get the economy moving again.

Former FDA Commissioner Scott Gottlieb wrote this on Twitter on Saturday, “April will be a hard month but we’ll get through it. This will end. We need to stick with current strategies. We can look toward May as a month when we carefully transition to a new posture. For now, [the] focus must be on supporting healthcare systems, preserving life, ending epidemic spread,”

How long the nation is sidelined and how long it takes to get the virus under control will be the major determinants in when we can begin to recover and how long that will take. While it now seems like any recovery would be measured in years, civilization has often surprised. This is what John Stuart Mill wrote in 1848,

“What has so often excited wonder, is the great rapidity with which countries recover from a state of devastation, the disappearance in a short time, of all traces of mischief done by earthquakes, floods, hurricanes, and the ravages of war. An enemy lays waste a country by fire and sword, and destroys or carries away nearly all the moveable wealth existing in it: all the inhabitants are ruined, and yet in a few years after, everything is much as it was before.” John Stuart Mill, Principles of Political Economy, 1848

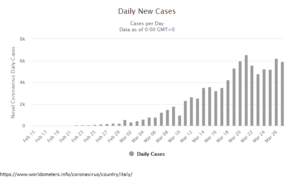
The number of new cases, which is the key metric to plot the growth of the disease, seems to have plateaued in Italy at around 5,500 to 6,000 cases per day for the last week. If the stay-at-home measures that are in place in Italy are working there, and if the experience of Korea and China holds, there should be a consistent decline in new cases soon.

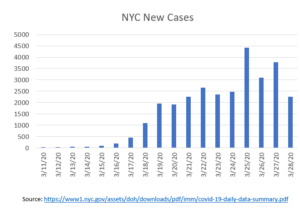
In New York, it is too early to say if the peak has been reached but the new case count has not expanded in the last few days.

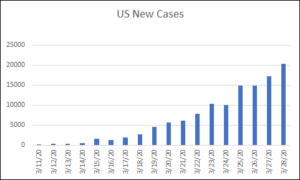
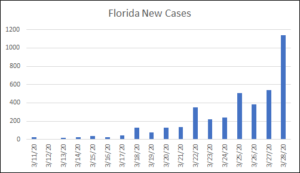
But cases in the USA and Florida continue to increase.

On the therapeutic front, many companies, universities, and research labs are working around the clock to develop drugs to help. As an example, Regeneron Pharmaceuticals (REGN) has identified antibodies that could neutralize the virus. Clinical trials should start in June. Roche (RHHBY) already has clinical trials underway for an existing drug called Actemra. Abbot Labs (ABT) announced a test that can detect Covid-19 in five-minutes. These are just a few examples.

On the investment front, in regards to equities, we would lean towards high-quality companies with strong balance sheets, consistent earnings over time, and high return on equity. Equities that are in a position to benefit from a stay-at-home nation can also be considered. Contact us with any questions.

SCOREBOARD

Week Ending 3/20/2020

HIGHLIGHTS

  • US stocks lost 15.26%. The S&P 500 is 32% off its high.
  • The Fed cuts rates to zero.
  • The economy is brought to a “sudden stop.”
  • Unemployment claims are going to explode.
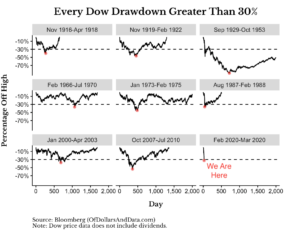
  • Every Dow drawdown greater than 30%.
  • There is no playbook.
  • Ready or not Modern Monetary Theory is on the way.
  • How to get out of this mess.

MARKET RECAP

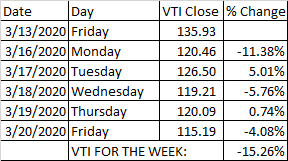
Stocks lost $4.3 trillion in value, and are now down by $12 trillion since the start of the bear market on February 14, according to Wilshire Associates. The S&P 500 was down 14.55% last week and is now off 32.23% from the high. The overall US stock market as measured by the Vanguard Total Stock Market Index (VTI) was down 15.26% for the week.

Last Sunday, the Fed announced they would cut interest rates to 0% to 0.25%, essentially as low as they can go without going into negative territory. Trump acknowledged that a recession might be on the way. Stocks then fell by 11.38% on Monday. Stocks rallied on Tuesday as the Fed began to try to help the debt markets to function better. Equities were hit hard on Wednesday, down by 5.76%, as stocks, bonds, and commodities all fell in unison in a race to raise cash. The Dow fell to below 20,000 for the first time since the beginning of 2017. Stocks had a small rally on Thursday, up 0.74%, after central banks put into place a series of measures to help the global economy. On Friday, stocks fell by 4.08% and closed at session lows as investors worried about exploding jobless claims and Goldman Sachs said Q2 US growth would fall by 24%.

Oil fell during the week to less than $20 per barrel.

The economy has essentially been brought to a “sudden stop” as hotels, restaurants, schools, and many other “non-essential” businesses have been closed. Social gatherings of more than a few been eliminated. In the span of a couple of weeks, we have become a stay-at-home nation in the attempt to slow down the spread of the Covid-19.

This is an experiment that has never been tried before, and it remains to be seen what the consequences are, but the stock market is not waiting to find out, assuming the worst, and then later thinking, it will be worse than that. A recession is almost definite and some are even mentioning the “D” word.

Unemployment claims hit 281,000 last week, which is up from 211,000 the week before. We have been close to 50-year lows on claims for a long-time, but this spike is just the beginning. There will be an avalanche of layoffs on the way. Treasury Secretary Munichin said unemployment could eventually hit 20% without government intervention. Other economic indicators were worse, the NY Fed Empire Manufacturing index fell to -21.5 from +12.9 in February, the biggest drop ever. The Philly Fed diffusion index for current activity fell to -12.7 from +36.7 last month, the lowest reading since 2012.

The Fed has been trying to do all it can, cutting interest rates, and trying to support the debt markets, but even treasuries have been falling in price of late. Interest raises have been rising, possibly due to the deficits that every country around the world is about start financing on a scale never seen before. Congress has already passed an $8.3 billion public health spending bill, followed by another $100 billion dollar bill for free virus testing and expansion of paid sick leave, and they are now working on a trillion-dollar-plus deal.

But for the most part, investors don’t see it as enough.

What happens when you close down large parts of the economy? We are about to find out. In the past, outside of the Great Depression, drops of 30% in the stock market have been good buying opportunities. But it feels like there is a lot more downside.

There is no playbook for this. The US has never voluntarily shut down large parts of the economy for a virus. Not in 1918 for the Spanish flu or any of the others. The government is attempting to do all it can, although no one has articulated a clear plan, other than throwing as much money as possible at the problem. Of course, one of the long-term problems is that the government doesn’t have any money to throw. We will be adding trillions to the already out of control debt. So ready or not, Modern Monetary Theory, the darling of the ultra-left, is about to get a real-time tryout.

What happens going forward is a function of what letter type recovery we have. If we get a “V”, then we have a somewhat quick recovery and before you know it, we are back to where we were and then beyond. A “U” would imply whenever we hit bottom, we stay there for a period of time (maybe extended time) and then ramp up to where we started. An “L” would be the more negative scenario, where we stay at a diminished level of economic output for a much longer time.

Last week we wrote that the country needed to take tougher measures to get the virus under control. We moved in that direction in a big way this week. That is what it will take to “flatten the curve”. Once China peaked out, the number of new cases began to decline daily (as if you are looking at a bell curve), and if the numbers are too be believed, there are relatively few new cases at this point. Time will tell if China can keep the numbers down.

If the US is fortunate enough to get to peak new cases in the next 10-days, we would next be on the downside of the curve, and then we can slowly begin to get back to a normal existence faster than almost everyone now believes. I may be way off base here and much too optimistic, but let’s hope. Some areas, like NYC, where there is a big breakout, might need longer. It took 50-days of quarantine in Wuhan to break the virus.

Whenever the US attempts to begin to get life back to normal, there has to be a rigorous test and trace program. South Korea set the standard (see above). Any sign of symptoms requires a test, and if positive, immediate quarantine, and then a trace of any possible contacts. The country needs a massive education program on how to wash hands. Any public business or place needs to have hand sanitizer readily available. We must practice social distancing and have regular temperature checks. We need to follow common sense. That is the only way to help keep the numbers down once we begin to dig ourselves out of this and until therapeutics and a vaccine are ready. With all of that, we can begin to return life to normal sooner rather than later.

SCOREBOARD

Week Ending 3/13/2020

HIGHLIGHTS

  • Stocks fall by 9.74% for the week.
  • We are now in a bear market, off by 27% as of Thursday.
  • An all-out price war between Saudia Arabia and Russia exasperated the sell-off.
  • Life changes in the US as lots of things begin to shut down, but more needs to be done and quickly.
  • China has shown great success in getting the virus under control.
  • We don’t think the world is coming to an end!
  • Some advice from Baron Rothchild.

MARKET RECAP

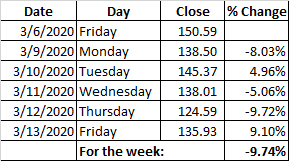
Stocks got hammered again, falling by 9.74% in the US and international markets dropped by 13.74%.


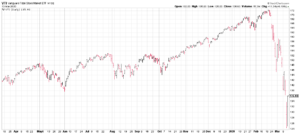
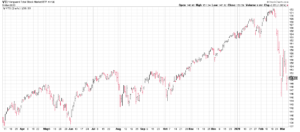
(price of VTI – Vanguard Total Stock Market Index)

The week did not get off to a good start. The price of oil collapsed on Monday after Saudia Arabia and Russia got into an all-out war for market share, each trying to max out on production. Oil prices went into a tailspin and the equity markets followed, fearful of mass defaults on loans to the energy sector in the US. Stocks in the S&P Energy sector fell by a stunning 20% on Monday and by 8.03% overall. Energy prices were already way down from the coronavirus but this was another shock at the wrong time in the wrong place. West Texas Intermediate fell 25% to $31.13 per barrel and Brent Crude, the international benchmark, dropped 24% to close at $34.36. It was the biggest decline since the Persian Gulf War in 1991.

On Tuesday and Wednesday, stocks traded gains and losses, up by 4.96% on Tuesday followed by a 5.06% loss on Wednesday.

On Thursday, stocks suffered their biggest loss since the crash of 1987, falling by 9.72%. Aside from 1987, there were only three other days where the market suffered a bigger fall, and they were all in 1929 (10/28/29, 10/29/29, and 11/6/29). That put stocks officially into a “bear” market, a decline of 20% or more. At the Thursday close, the Vanguard Total Stock Market Index fund (VTI) was down by 27.44% from the February 14 high. The US started to shut down on Thursday as some schools, Disneyland, and the NBA all announced closures.

Markets rallied by 9.10% on Friday as Trump declared a National Emergency and was close to a deal with the Democrats on a relief package. Trump’s declaration of a national emergency opens up access to $50 billion in financial assistance for states and localities. The Fed said it would buy $33 billion of bonds to improve the functioning of the markets and would make $1.5 trillion of short-term financing available. As of the close Friday, stocks were down by 20.83% from the high and down 16.92% year-to-date.

LIFE IS CHANGING FAST

Italy which has been hit hard has basically shut down for a few weeks. Trump announced a ban on flights to and from Europe. Europe has become the new epicenter of the disease and the US is probably not far behind. All of the major sports leagues and the NCAA have postponed or canceled their seasons. Schools in at least 12 states, including Florida, are going to be closed for a few weeks, and public gatherings of more than 200 or so are either prohibited or are being canceled. The aim is to “flatten the curve” so that Covid-19 cases don’t pop in such a manner as to overwhelm the health care system.

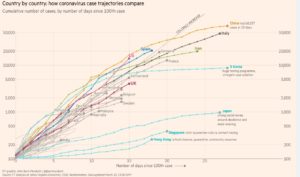
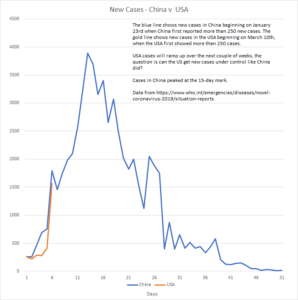
While the measures above may seem tough, they are probably not enough. A full lockdown of the country (except for essential type businesses) similar to what China did, will probably be necessary to stop the virus in its path. And the US will have to act fast before it becomes too late. Cases in the US will begin ramping up immediately if we follow a similar path to China (see graph below). But China has shown the path on how to get the virus under control.

APPLE CLOSES ALL STORES OUTSIDE OF CHINA

Apple announced they will close all stores outside of greater China until March 27th. Tim Cook, Apple CEO, said that “the most effective way to minimize [the] risk of the virus’s transmission is to reduce density and maximize social distance.” The fact that stores will be open in China, but closed outside China, tells you all you need to know about how successful China has been in, at least so far, turning the tide on Covid-19.

While the virus started in China and was exploding there, so far about 80,000 plus cases, from the time new cases had reached 250+ on January 23, China peaked in new cases only 17 days later on February 10th, and remarkably, has been declining ever since. There have been less than 40 new cases reported in China every day since Tuesday, with only 11 on Friday and 18 on Saturday. China has shown the virus can be beaten and in short order. That is the bright spot that shows it can be done. That is the path the US needs to follow.

It remains to be seen if China can keep the numbers down as they return to normalcy. But for now, the turnaround is nothing short of remarkable and the US and the rest of the world will have to learn from China’s success. That will require quick action which at least for now, doesn’t seem like it is coming. There are a lot of half-measures now in place in the US but it will take a full-court press to beat down the virus.

THE WORLD IS NOT COMING TO AN END

While there is a feeling of panic in the streets (and the markets), we don’t think the world is coming to an end. Although life and financial markets can get much worse before they get better. China (as well as Korea) have shown that the virus can be brought under control. Furthermore, this is not the first pandemic. We wrote a couple of weeks back about the Spanish Flu, the Asian Flu, the Hong Kong Flu, and SARS and they all eventually faded. While Covid-19 is probably the worst since the Spanish Flu (1918), at some point there will be therapeutics and a vaccine to knock it out, and until then, there will be lots of tough adjustments to life. Fast and strong measures can work. China and Korea have shown that. China seems to have turned around the growth of the virus in less than a month, time will tell if it can keep it down, but so far it is encouraging. Governments around the world will be pouring in billions, probably trillions, to support their economies. Once the turn in the virus happens, we are hopeful that economic growth will quickly rebound.

During past flu scares, governments never took the kind of actions we are seeing today. So how this plays out economically is an unknown. There is a legitimate worry that there is too much corporate debt out there, and a weak economy will throw a lot of companies overboard. The near-term economic future is unknown and will get worse before it gets better. While we would hope for a V-shaped economic recovery, there is the risk of a U shaped recovery, where the economy falls and then goes sideways for a while, and then increases back to normal.

But these are the kinds of moments that the legendary investors have taken advantage of in the past. As Baron Rothchild famously said in the 18th century, “the time to buy is when there is blood in the streets.” He learned that from the Battle of the Waterloo against Napoleon.  If history is any guide, unless we are going to go into a Great Depression, investors with a long-term focus and that are not overallocated to equities for their risk tolerance (consult a financial advisor) should consider taking advantage of this sell-off. We would not be jumping in all at once, to be clear, stocks can certainly decline a lot more from here, but small purchases here and there in financially strong companies, now and as the market declines further should work out over time. Of course, there are no guarantees. No one knows what the future of the stock market holds, but buying at times when it hurts the most has usually worked out.

SCOREBOARD
 

Week Ending 3/6/2020

HIGHLIGHTS

  • Stocks finish flat for the week but explosive volatility in between.
  • Economic numbers, highlighted by a strong jobs report, indicate the economy was accelerating economy before the impact of the virus.
  • Interest rates continue to plunge.
  • The yield on the S&P 500 now exceeds the 10-year yield by the most since 2008.
  • Joe Biden is now the favorite to capture the nomination for the Democrats.
  • The coronavirus continues to spread but while absolute numbers are small the economic impact will be big.

MARKET RECAP

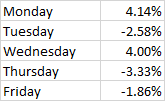
US stocks advanced for the week by the thinnest of margins, +0.1%, but it didn’t feel that way as stocks were way up or down every day. International stocks fell by 1.19%. Here is how it broke down day by day in the US:

The momentum from the late market rally from the prior Friday continued on Monday with the 4.14% advance. But that was reversed on Tuesday as the market fell late as the Fed was holding its news conference announcing a 1/2 percent interest rate cut. News of Joe Biden’s Super Tuesday performance helped the market rally by 4% on Wednesday. Then coronavirus fears dropped the market on Thursday. Friday was more of the same but stocks rallied 2.36% off of their lows late in the day to close down by 1.86%. Add it all up and stocks were pretty much flat for the week.

The wild ups and downs reflect the fact that no one knows how bad the virus will be and what will be the ultimate impact on the economy. Economic numbers that were reported this week were good, and show a US economy that is improving. The Atlanta Fed’s GDPNow model raised the Q1 estimate of growth to 3.1% from 2.7%. It was a blockbuster jobs report as nonfarm payrolls increased by 273,000 (the estimate was 175,000) and the unemployment rate dropped to 2.5%. December and January’s numbers were revised up by 243,000. But most of the survey was done before the coronavirus accelerated in the last couple of weeks. No one expects anything close to that for the next few months.

INTEREST RATES FALL HARD

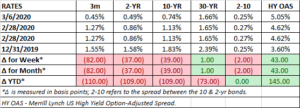
The Fed on Tuesday cut interest rates by one-half point to a range of between 1% and 1.25%. It was the first time since 2008 that the Fed cut rates in between scheduled policy meetings. The market immediately sold-off on the news, probably realizing a rate cut would have minimal impact on the supply-side shock to the economy. Meanwhile, interest rates plunged. The 3-month treasury bill now yields 0.45%, which is down from 1.27% last week and 1.55% at the end of last year. The two and ten-year yield fell by about 37 and 39 basis points for the week. The 10-year yields an all-time low of 0.74% and the 30-year is at 1.66%. High-yield bonds are now at 5.05%, up from 4.62% last week. The falling interest rates indicate fixed income investors expect some bad times ahead.

ADVANTAGE TO STOCKS BASED ON YIELD

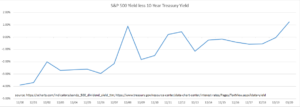
The differential between the yield on the S&P 500 and the 10-year treasury are now at the highest levels since 2008. That doesn’t mean the bottom is in but stocks are attractive based on this valuation measure.

BIDEN IS THE ODDS ON FAVORITE

Biden’s surprise surge on Tuesday has vaulted him to be the front-runner for the Democrats according to fivethirtyeight.com. Along with the Tuesday performance, all of the remaining candidates have dropped out, giving Biden has an 89% chance of winning the Democratic nomination.

VIRUS

The coronavirus continues to spread but while absolute numbers are still small. the economic impact will be big. According to Johns Hopkins, there have been 107,000 confirmed cases as of Sunday morning and about 3,600 people have died. In the US, there are 440 cases over 32 states. The fear factor and efforts to minimize the spread of the virus are beginning to have a real economic impact. Cases in the US will probably skyrocket over the coming days just because testing will be going up dramatically.

SCOREBOARD
Week Ending 2/28/2020

HIGHLIGHTS

  • Stocks drop into correction territory in record time falling 11.45%.
  • The biggest point drop in the history of the Dow on Thursday, falling 1,190 points.
  • Interest rates plunge, the 10 and 30-year Treasury yields are at all-time lows.
  • A look back at the Spanish Flu, the Asian Flu, the Hong Kong Flu, and SARS.
  • The dividend yield on the S&P 500 exceeds the 30-year Treasury yield by the most since March of 2009.

MARKET RECAP

Reality finally caught up to the stock market this week as US equities fell by a stunning 11.45%. It was the fastest decline into correction territory (a 10% drop from the high) ever and the worst week since the financial crisis. Despite news going into last weekend that the growth of the coronavirus (Covid-19) was possibly getting under control in China, outbreaks in Italy, South Korea, and Iran woke investors up to the fact that maybe there is a problem here or even a big problem. Micheal Ryan, the WHO’s chief of health emergencies, outlined three possible scenarios: (1) the virus can be contained, (2) the virus develops a regular pattern of continual or seasonal transmission, or (3) it becomes a pandemic. Goldman Sachs said that earnings would be flat this year, indicating two straight years of no earnings growth.

Stocks fell 3.3% on Monday, 3.1% on Tuesday, 0.6% on Wednesday, 4.4% on Thursday, and 0.7% on Friday.

On Thursday, the Dow fell by 1,190.05 points, the biggest one-day point drop in history (not percentage drop) as panic over the Covid-19 spread, putting the market into correction territory.

Stocks weren’t the only financial instrument to fall, interest rates also plunged. The yield on the 10-year Treasury dropped to 1.16% on Friday, an all-time low and 11 basis points less than the July 2016 low. The 30-year bond fell to 1.67%, another all-time low.

Where the economy goes from here is really a guess at this point. Ultimately it depends on how the virus plays out and how much of the economy might shut down, both in the US and around the world. Economic growth was starting to pick up around the world, but the virus may be enough to put recession fears back on the front burner. It is impossible to know how Covid-19 plays out, but this would not be the first virus to put a scare into equity markets.

SPANISH FLU OF 1918

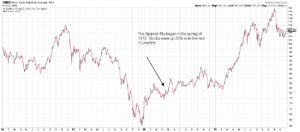
The Spanish flu was a severe pandemic from 1918-1919 that infected about 1/3 of the world’s population. About 50 million people died worldwide and 675,000 in the US. This flu had a case-fatality ratio of greater than 2% making it a category 5 on the CDC Pandemic Severity Index (the worst possible level). Obviously, communication, medicine, and technology were not then what they are now, so the timing of the virus is not that precise, and the effectiveness of treatments was nowhere near what they would be today. The virus started in the spring of 1918. Using a 4/30/1918 start date, the market advanced by 20% over the next 12-months. However, it should be noted that there was a 40% decline prior to the virus from November of 1916 until December of 1917. Also, the Spanish Flu occurred towards the end of World War I so there were lots of other factors to consider which might have had a greater impact on the market.

ASIAN FLU OF 1957

The Asian Flu was a category 2 flu pandemic that started in China at the beginning of 1956 and ran until 1958. It reached the US in June of 1957 and killed 70,000. This flu occurred in two waves, and the second wave, which began in November was more severe. Worldwide estimates of fatalities range from 1 to 4 million. From the end of June until the market low at the end of October, stocks declined by 14%. However, the Fed had tightened monetary policy in the two years prior which led to a recession, there were also worries that the US was losing the cold war to Russia after the Soviets launched Sputnik, the first satellite to orbit the earth.

HONG KONG FLU OF 1968

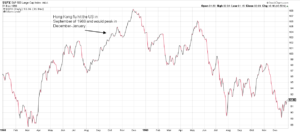
The Hong Kong flu began in July of 1968 and hit the US in September of that year. This flu was highly contagious and it spread rapidly. By December it had spread throughout the US. The virus peaked between December of 1968 and January of 1969. The flu killed one million people worldwide and 34,000 in the United States. The case-fatality ratio was below 0.5%, making it a category 2 disease on the Pandemic Severity Index.  From September through November, stocks were up by 9.6%, but the market would then slide by 17.4% from December until July. The market went sideways through the end of the year and would then full much further in 1970. However, in previous research I have done about this time period, the flu is not even mentioned, and the market decline started as the flu was peaking. That was an era of high flying stocks, an IPO craze, Nixon, the Fed got tight on money, inflation was accelerating, there were riots and crime so factors were the probable causes of the decline.

SARS VIRUS OF 2003

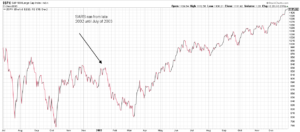
The SARS virus was limited in scope but deadly, spreading to 8,000 people and killing 800, mainly in Asia. The virus ran from late 2002 until July of 2003. From the January peak until the March low, stocks fell by 14% over a two-month period while the 10-year yielded about 3.5%.

WHERE WE GO FROM HERE

In the four examples above, three were associated with sell-offs of between 14% and 18%. Although it is not clear the flu was even the main cause of these sell-offs. As of now, stocks are off by 12.6%. If the flu plays out to become a major economic event and pushes the economy into a recession, the sell-off could get a lot worse over time. But if it turns out to be a minor blip in the backdrop of a slowly improving worldwide economy, this could represent a buying opportunity. The likely scenario is somewhere in between, but until the picture becomes clearer the uncertainty of where the market goes is much higher than normal. And this does not even factor in that the lead Democrat in the primary race is Bernie Sanders.

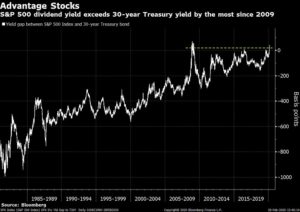
One thing for sure, the sell-off in stocks and fall in bond yields, while not erasing the high p/e ratio of US equities, has made stocks look attractive to bonds at this time. According to David Wilson from Bloomberg, as of Thursday, the dividend yield on the S&P 500 now exceeds the yield on the 30-year Treasury bond by 24 basis points, the most since March of 2009.

In a world where the 10-year treasury yields 1.13% and the 30-year yields 1.65%, here are some examples of stocks with a financial strength rating of A++ by Value Line and big dividend yields:

To be clear, we are not recommending these stocks, but pointing them out as examples of some of the opportunities now available after this week’s damage. Of course, if the virus really damages economic activity, they may not be such good deals right now and would turn into better opportunities later.

SCOREBOARD