
HIGHLIGHTS
- Stocks drop into correction territory in record time falling 11.45%.
- The biggest point drop in the history of the Dow on Thursday, falling 1,190 points.
- Interest rates plunge, the 10 and 30-year Treasury yields are at all-time lows.
- A look back at the Spanish Flu, the Asian Flu, the Hong Kong Flu, and SARS.
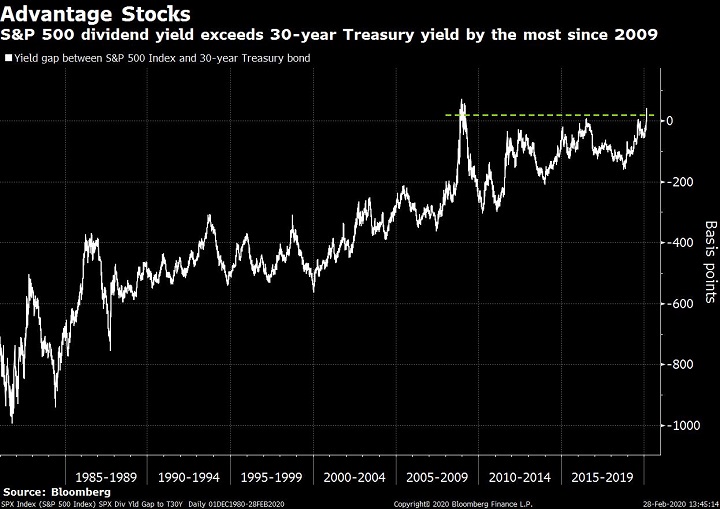
- The dividend yield on the S&P 500 exceeds the 30-year Treasury yield by the most since March of 2009.
MARKET RECAP
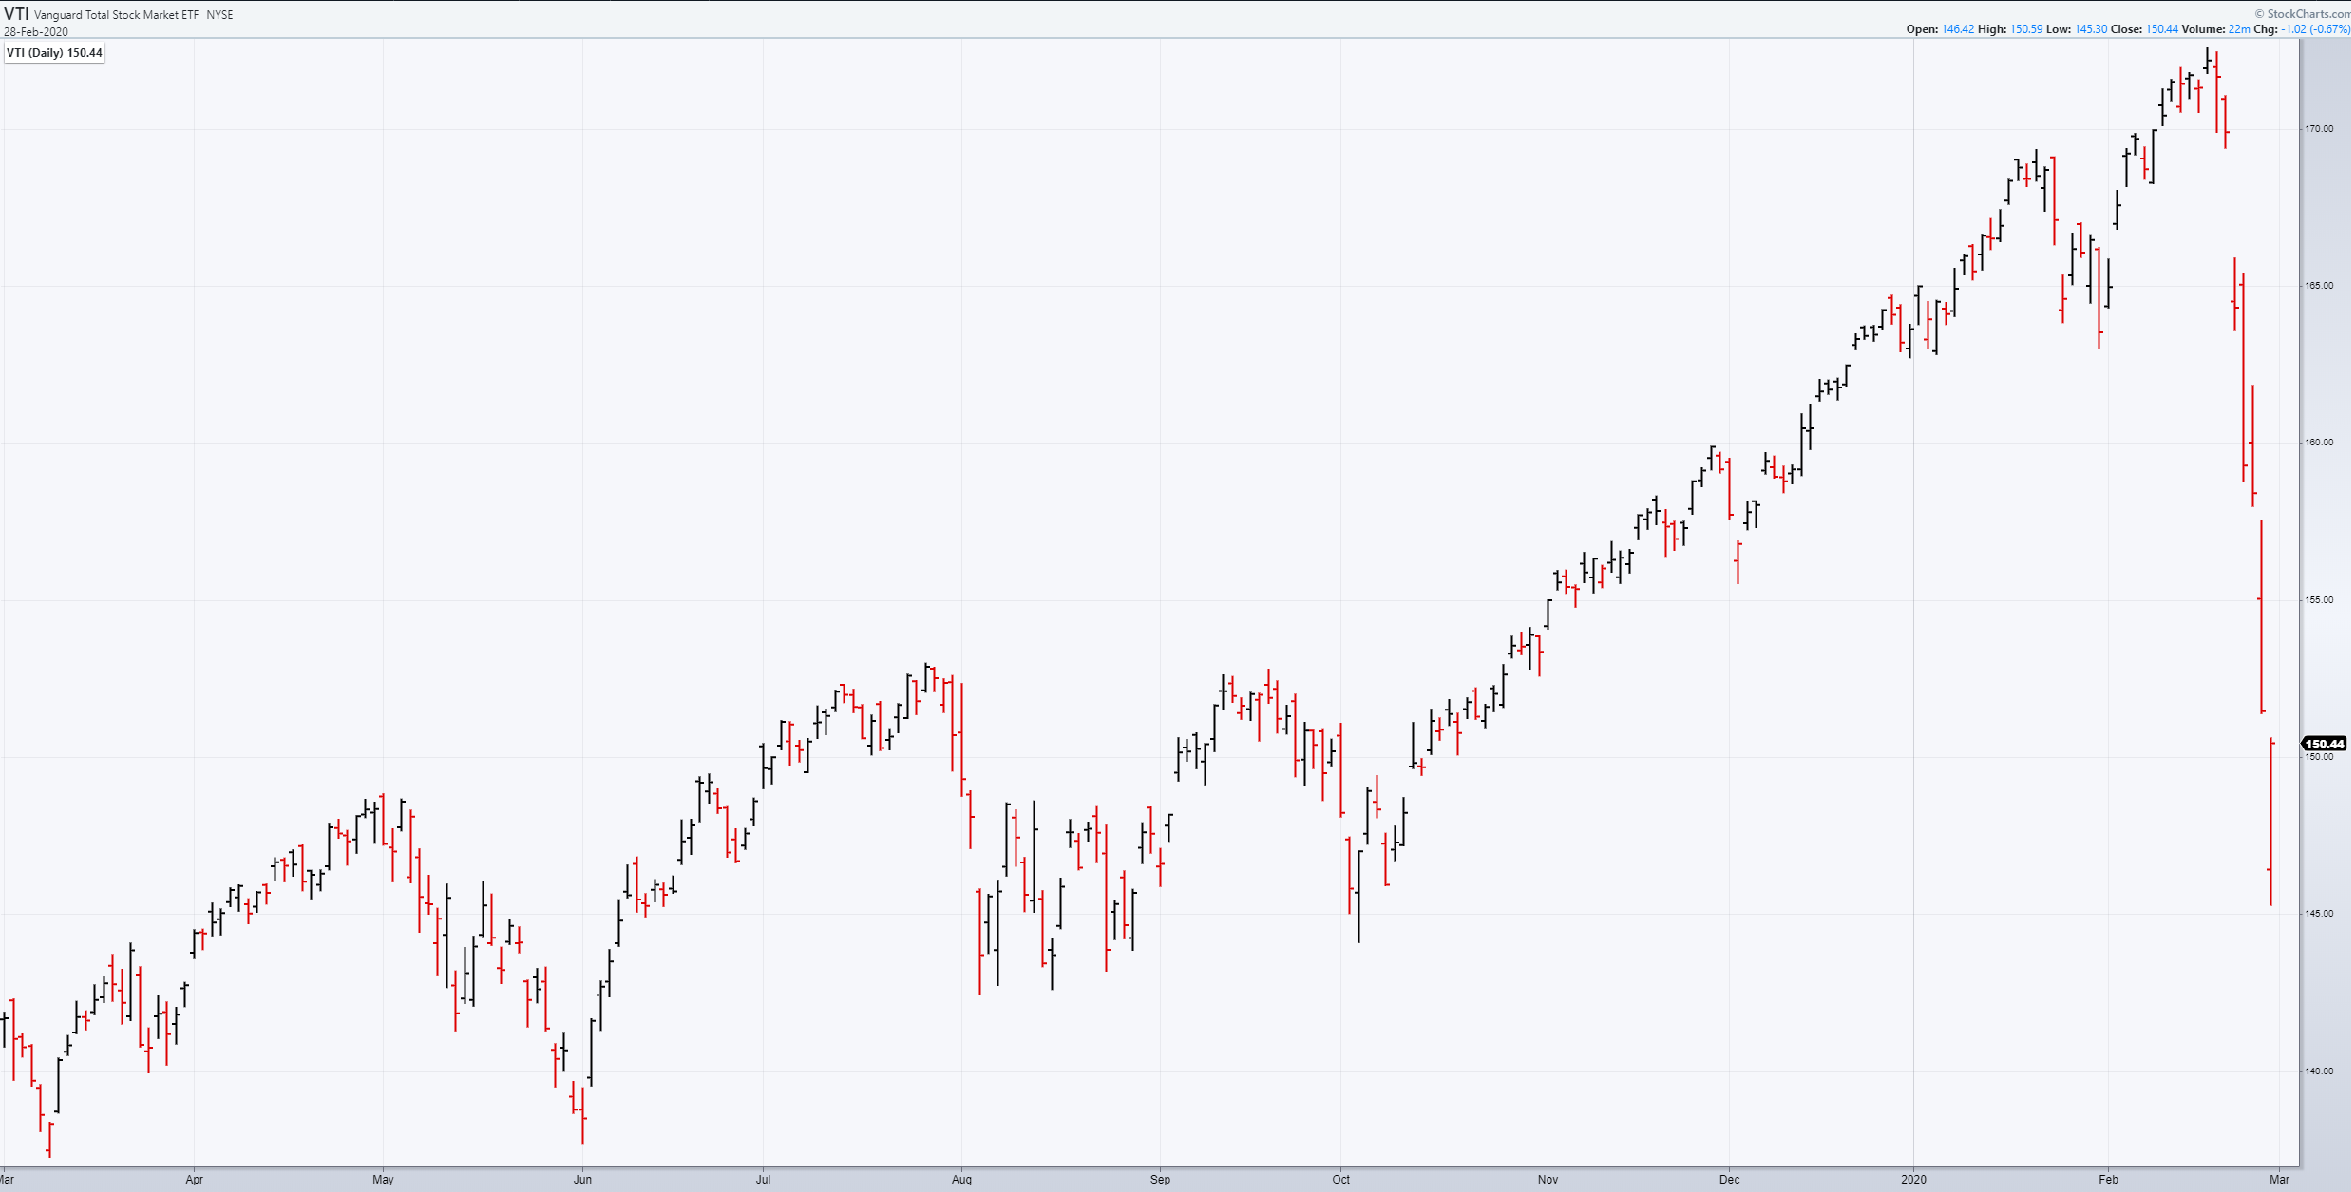
Reality finally caught up to the stock market this week as US equities fell by a stunning 11.45%. It was the fastest decline into correction territory (a 10% drop from the high) ever and the worst week since the financial crisis. Despite news going into last weekend that the growth of the coronavirus (Covid-19) was possibly getting under control in China, outbreaks in Italy, South Korea, and Iran woke investors up to the fact that maybe there is a problem here or even a big problem. Micheal Ryan, the WHO’s chief of health emergencies, outlined three possible scenarios: (1) the virus can be contained, (2) the virus develops a regular pattern of continual or seasonal transmission, or (3) it becomes a pandemic. Goldman Sachs said that earnings would be flat this year, indicating two straight years of no earnings growth.
Stocks fell 3.3% on Monday, 3.1% on Tuesday, 0.6% on Wednesday, 4.4% on Thursday, and 0.7% on Friday.
On Thursday, the Dow fell by 1,190.05 points, the biggest one-day point drop in history (not percentage drop) as panic over the Covid-19 spread, putting the market into correction territory.
Stocks weren’t the only financial instrument to fall, interest rates also plunged. The yield on the 10-year Treasury dropped to 1.16% on Friday, an all-time low and 11 basis points less than the July 2016 low. The 30-year bond fell to 1.67%, another all-time low.
Where the economy goes from here is really a guess at this point. Ultimately it depends on how the virus plays out and how much of the economy might shut down, both in the US and around the world. Economic growth was starting to pick up around the world, but the virus may be enough to put recession fears back on the front burner. It is impossible to know how Covid-19 plays out, but this would not be the first virus to put a scare into equity markets.
SPANISH FLU OF 1918
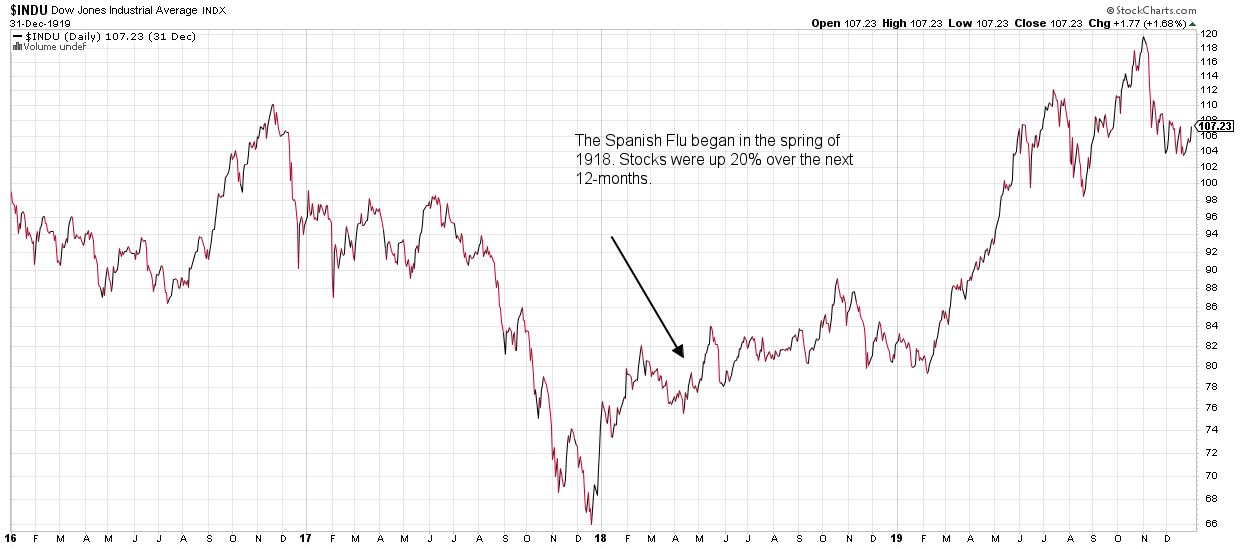
The Spanish flu was a severe pandemic from 1918-1919 that infected about 1/3 of the world’s population. About 50 million people died worldwide and 675,000 in the US. This flu had a case-fatality ratio of greater than 2% making it a category 5 on the CDC Pandemic Severity Index (the worst possible level). Obviously, communication, medicine, and technology were not then what they are now, so the timing of the virus is not that precise, and the effectiveness of treatments was nowhere near what they would be today. The virus started in the spring of 1918. Using a 4/30/1918 start date, the market advanced by 20% over the next 12-months. However, it should be noted that there was a 40% decline prior to the virus from November of 1916 until December of 1917. Also, the Spanish Flu occurred towards the end of World War I so there were lots of other factors to consider which might have had a greater impact on the market.
ASIAN FLU OF 1957
The Asian Flu was a category 2 flu pandemic that started in China at the beginning of 1956 and ran until 1958. It reached the US in June of 1957 and killed 70,000. This flu occurred in two waves, and the second wave, which began in November was more severe. Worldwide estimates of fatalities range from 1 to 4 million. From the end of June until the market low at the end of October, stocks declined by 14%. However, the Fed had tightened monetary policy in the two years prior which led to a recession, there were also worries that the US was losing the cold war to Russia after the Soviets launched Sputnik, the first satellite to orbit the earth.

HONG KONG FLU OF 1968
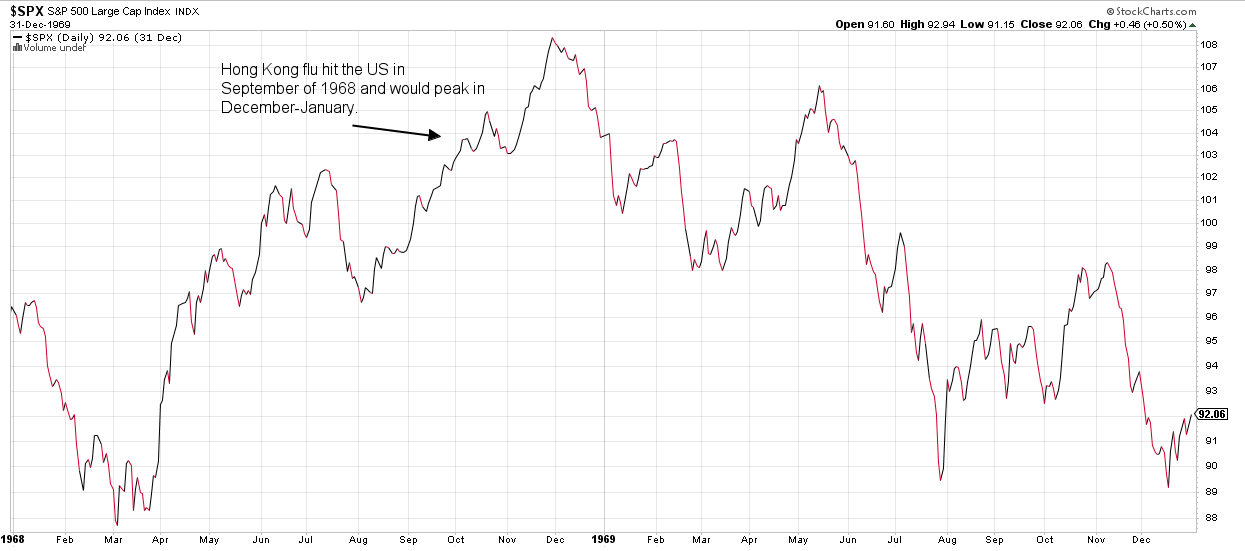
The Hong Kong flu began in July of 1968 and hit the US in September of that year. This flu was highly contagious and it spread rapidly. By December it had spread throughout the US. The virus peaked between December of 1968 and January of 1969. The flu killed one million people worldwide and 34,000 in the United States. The case-fatality ratio was below 0.5%, making it a category 2 disease on the Pandemic Severity Index. From September through November, stocks were up by 9.6%, but the market would then slide by 17.4% from December until July. The market went sideways through the end of the year and would then full much further in 1970. However, in previous research I have done about this time period, the flu is not even mentioned, and the market decline started as the flu was peaking. That was an era of high flying stocks, an IPO craze, Nixon, the Fed got tight on money, inflation was accelerating, there were riots and crime so factors were the probable causes of the decline.
SARS VIRUS OF 2003
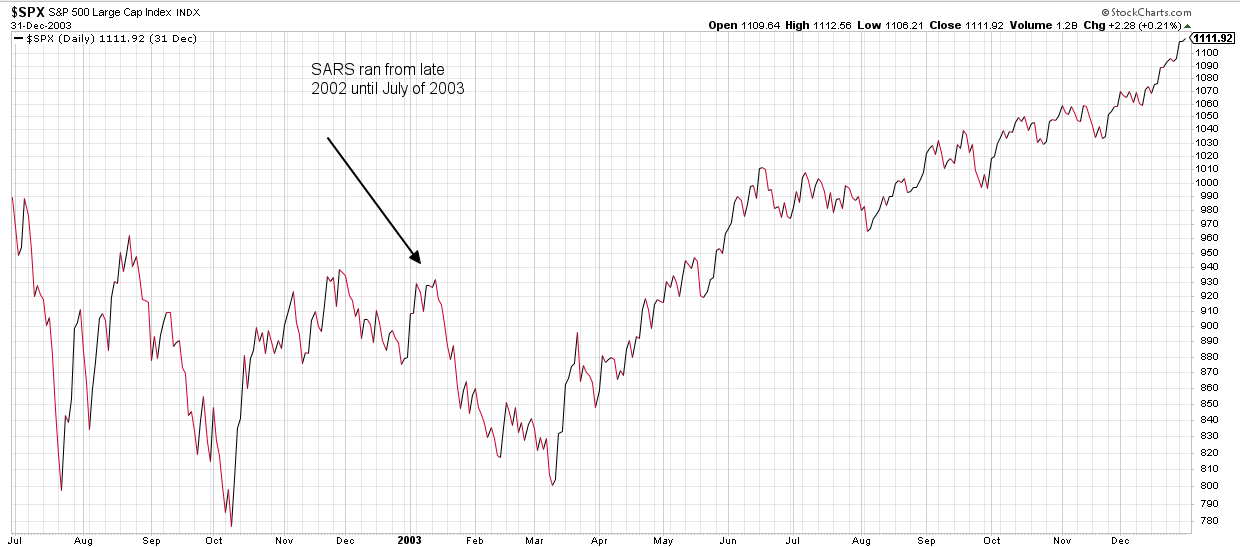
The SARS virus was limited in scope but deadly, spreading to 8,000 people and killing 800, mainly in Asia. The virus ran from late 2002 until July of 2003. From the January peak until the March low, stocks fell by 14% over a two-month period while the 10-year yielded about 3.5%.
WHERE WE GO FROM HERE
In the four examples above, three were associated with sell-offs of between 14% and 18%. Although it is not clear the flu was even the main cause of these sell-offs. As of now, stocks are off by 12.6%. If the flu plays out to become a major economic event and pushes the economy into a recession, the sell-off could get a lot worse over time. But if it turns out to be a minor blip in the backdrop of a slowly improving worldwide economy, this could represent a buying opportunity. The likely scenario is somewhere in between, but until the picture becomes clearer the uncertainty of where the market goes is much higher than normal. And this does not even factor in that the lead Democrat in the primary race is Bernie Sanders.
One thing for sure, the sell-off in stocks and fall in bond yields, while not erasing the high p/e ratio of US equities, has made stocks look attractive to bonds at this time. According to David Wilson from Bloomberg, as of Thursday, the dividend yield on the S&P 500 now exceeds the yield on the 30-year Treasury bond by 24 basis points, the most since March of 2009.
In a world where the 10-year treasury yields 1.13% and the 30-year yields 1.65%, here are some examples of stocks with a financial strength rating of A++ by Value Line and big dividend yields:
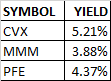
To be clear, we are not recommending these stocks, but pointing them out as examples of some of the opportunities now available after this week’s damage. Of course, if the virus really damages economic activity, they may not be such good deals right now and would turn into better opportunities later.
SCOREBOARD
