HIGHLIGHTS
- The best two-week rally since 1938.
- Trump outlines guidelines to reopen the economy.
- Economic stats get worse and worse highlighted by 5.2 million more unemployment claims.
- But the stock market is on a different page, up 31% from March 20th.
- A detailed look at past bear markets.
- History shows there is usually a retest of the lows.
MARKET RECAP
Stocks rallied by 2.71% in the US and 1.14% x-US. US equities have put in their best two-week gain since 1938. The market is now off by 16.4% from the February 19th high. Over the last year, the overall US stock market is down 1.5% and the S&P 500 is up 1.1%.
Trump said on Monday that he wants to open the country “ahead of schedule” and different groups of governors announced they would be working together to coordinate the reopening of their states. Trump initially said he is the one to make the decision on when the country reopens, citing no legal basis for his claim. Previously, when determining when the country “would close”, Trump left it up to the states, but he said that he determines when it reopens, “When somebody is the president of the United States, the authority is total,” which is counter to what we all know. Later in the week, Trump reversed himself and then said he would leave it up to the Governors, but did outline guidelines that seemed to be based on good science.
The economic news gets worse and worse. Retail sales fell by 8.7% in March, the biggest drop since 1992. The NAHB/Wells Fargo Housing Market Index dropped by 58%. The index measures builders’ perceptions of the market for single-family homes. It was by far the largest drop ever. However, their chief economist Robert Dietz struck an optimistic note, “As social distancing and other mitigation efforts show signs of easing this health crisis, we expect that housing will play its traditional role of helping to lead the economy out of a recession later in 2020.”
Unemployment claims increased by another 5.2 million and now total about 22 million. All of the new jobs since the last recession have been wiped out. The Empire State Index of Manufacturing fell to its lowest level ever. Industrial production suffered the biggest decline since 1946. The International Monetary Fund said this will be the worst economic downturn since the Great Depression.
Despite all of this, US stocks are up by 31% from the intraday low on March 20th. There are good arguments that this rally is for real and that the low is in. There has been unprecedented action by the Federal Reserve and the government putting trillions of dollars in to support the economy. The markets have already written off 2020 and are looking forward. There is some progress on therapeutics and vaccines that will eventually end the coronavirus. Interest rates are basically at zero thereby making stocks more attractive. And, history generally shows that if you have a long enough time horizon investors will be rewarded for owning stocks at this level.
On the other hand, it would be very unusual for the equity markets to get away without a retest of the low, or something close to a retest. Below we take a look at the price action in bear markets since 1929.
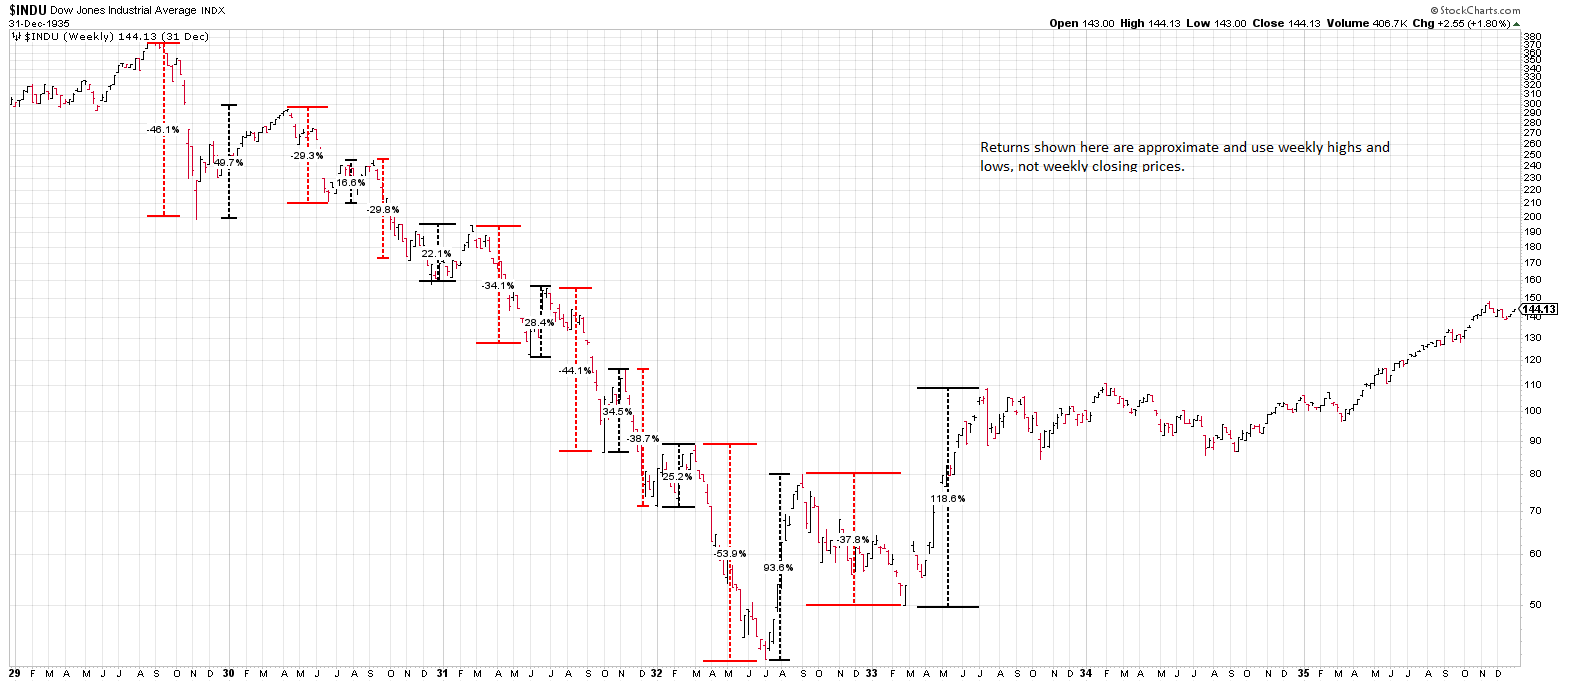
Last week we showed how in 1929, a 46% drop followed by a 50% rally, was just the set up for further declines. We show that chart again here:
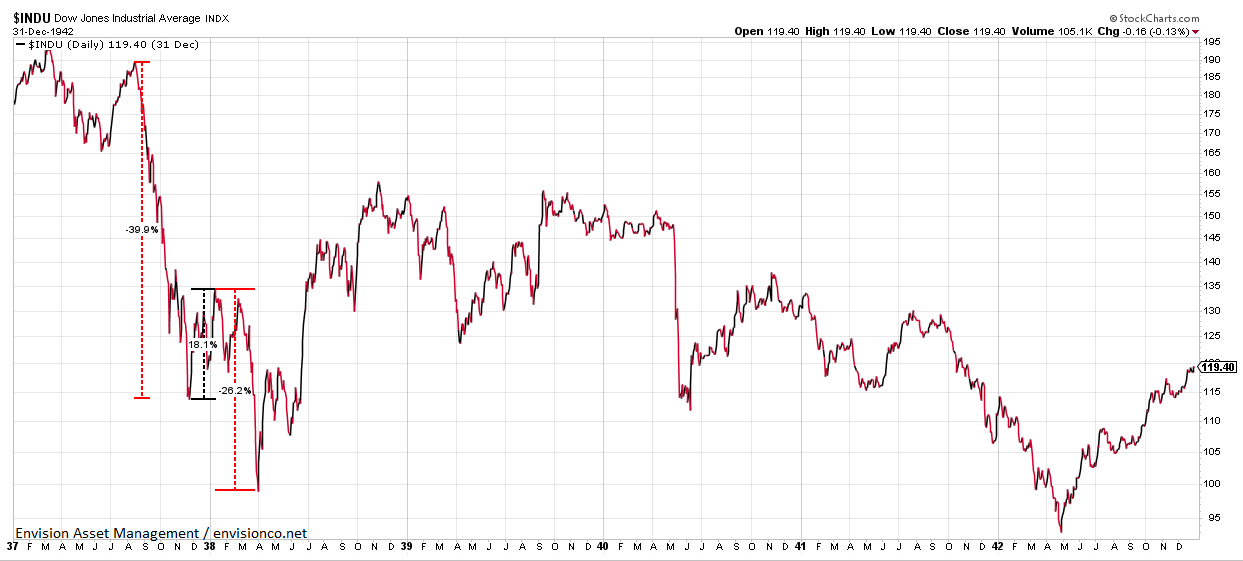
Here is 1937. Stocks fell by 40% from August through November, then rallied by 18%, and then fell another 26%. Overall, it was a 46% decline.
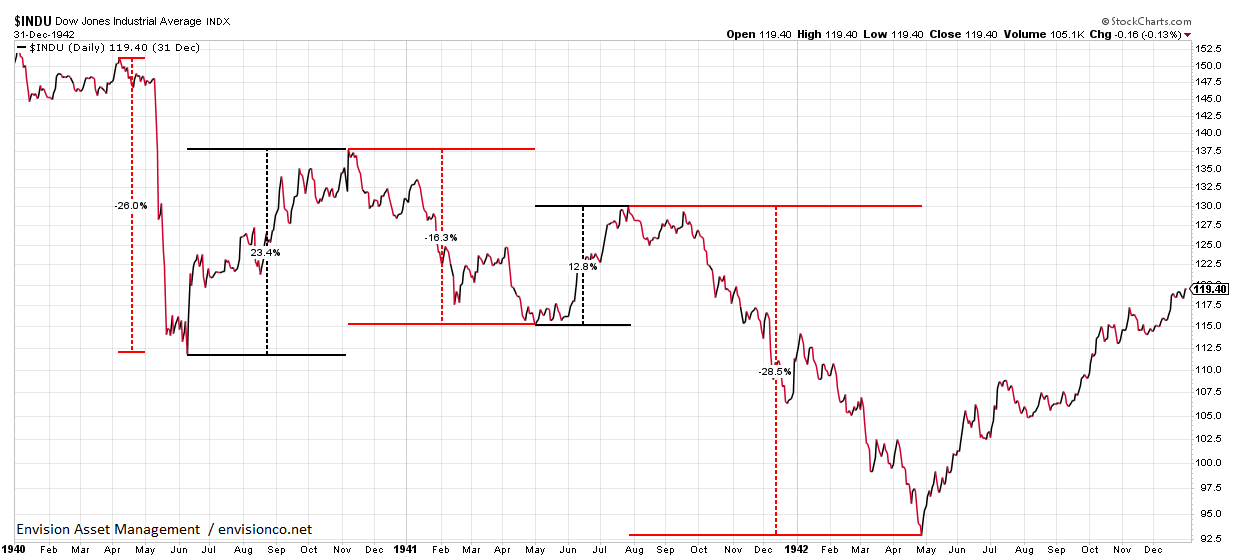
In 1940 when Hitler invaded France, stocks fell by 26%, rallied by 23%, then more or less went sideways for 9-months, down 16% and then up 12%, before falling another 28%. The overall decline was about 28%.
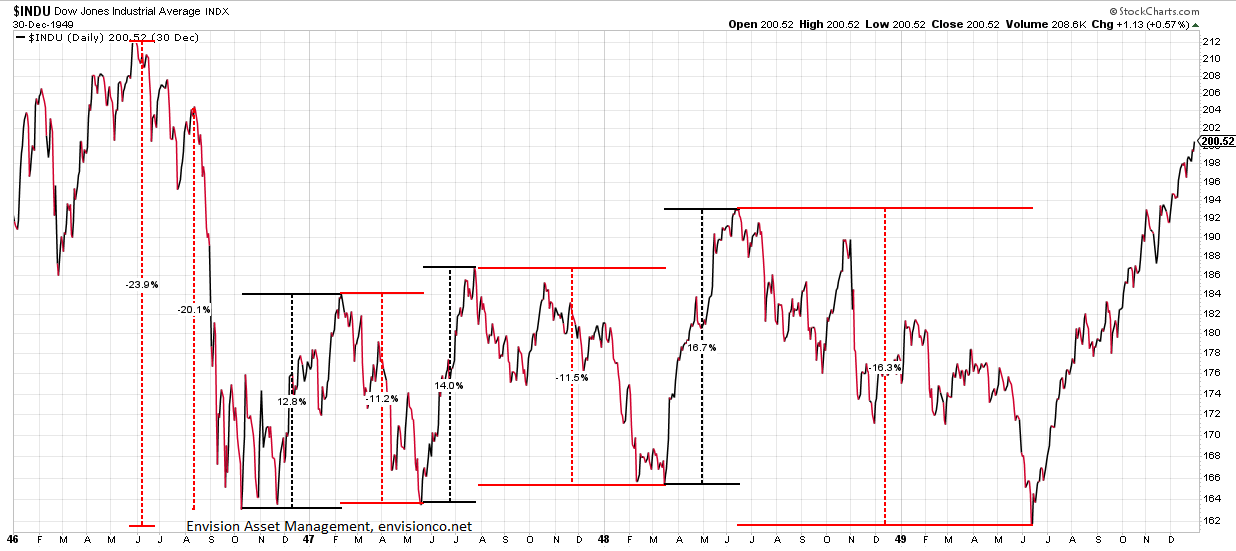
From May of 1942 until May of 1946, stocks increased by 129%. WWII ended in September of 1945, and by August of 1946, the postwar surge in demand fell off, the market dropped by 24% but it was highlighted by a 20% drop from August 12 to October 9th. The market then rallied by 12.8% and would fall again to test the lows, not once, but twice, over the next year. Then in the spring of 1948, a 17% rally was followed by a 16% drop that just took out the 1946 low. That set the stage for a rally into the 1950s.
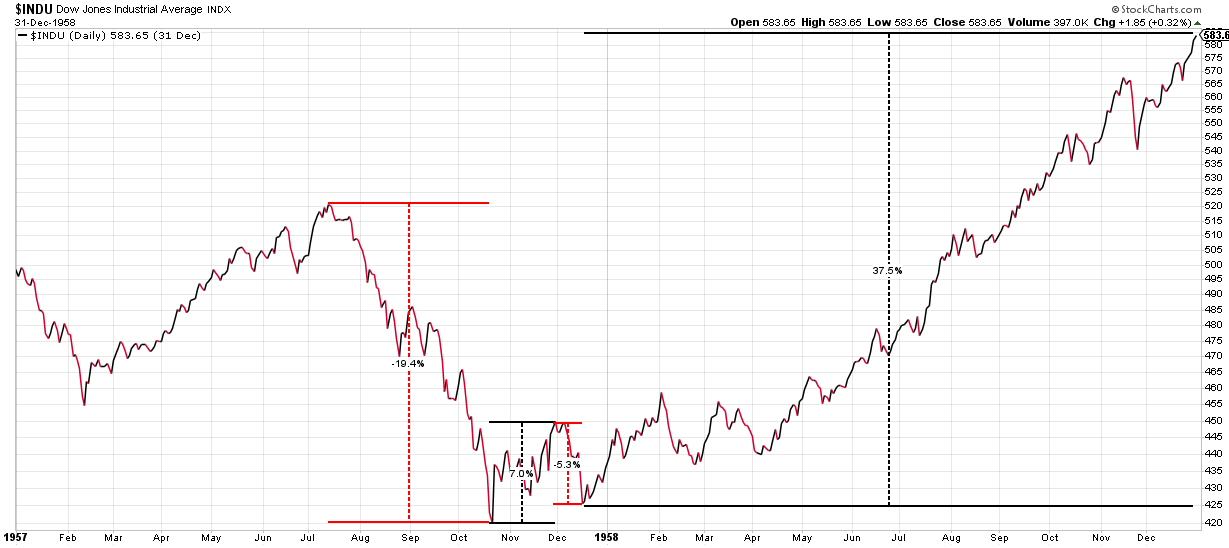
The Asian Flu of 1957, led to a 19% decline. The flu killed 70,000 people in the US across two waves, one started in June of 1957 and a second wave that was more severe started in November. After the market hit bottom, it continued to rally without a retest.
The selloff starting in March of 1962 and lasting until June of 1962 resulted in a 26% sell-off. This was also known as the “Flash Crash.” Business activity began to slow late in ’61, and the market sell-off accelerated when President Kennedy threatened anti-trust action and went after the steel industry. After the fall, stocks rallied by 15%, fell by 10% and then began an advance that lasted until 1966.
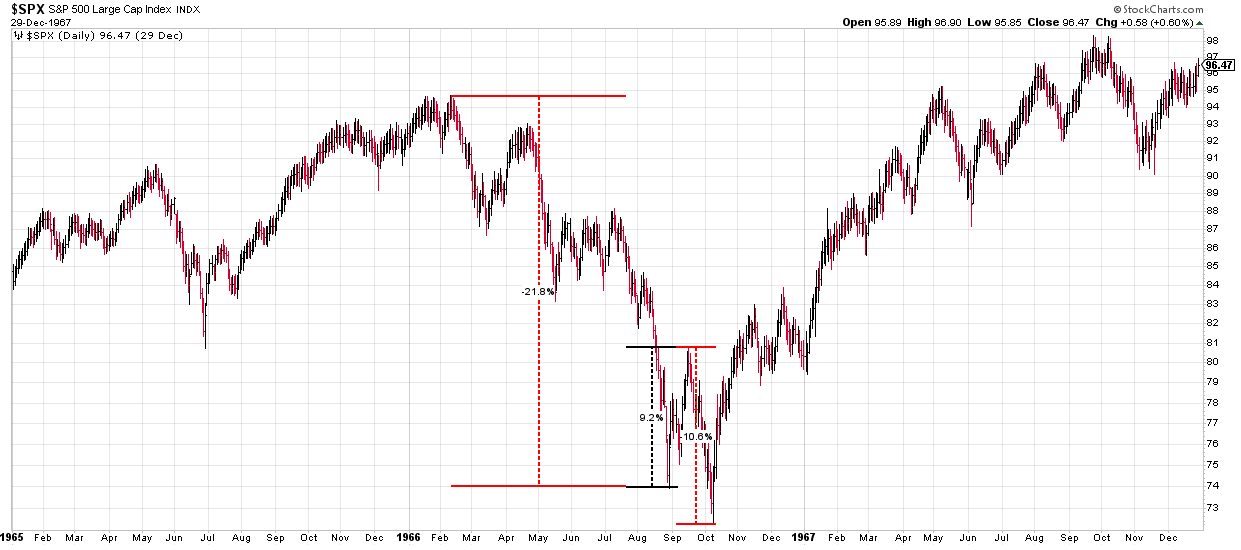
Early in 1966, stocks began to sell-off, in a series of small waves. Eventually, stocks dropped by 22%, rallied by 9%, and then would fall by just over 10% for a total 24% decline from the top. During this period, inflation was beginning to emerge, there was sharply higher government spending, Vietnam, and a tight Federal Reserve that led to a credit crunch.
In October of 1969, stocks would fall by 31% without a rally of any significance. When the market hit bottom in late May of 1970, stocks would begin a rally. Inflation was beginning to pick up.

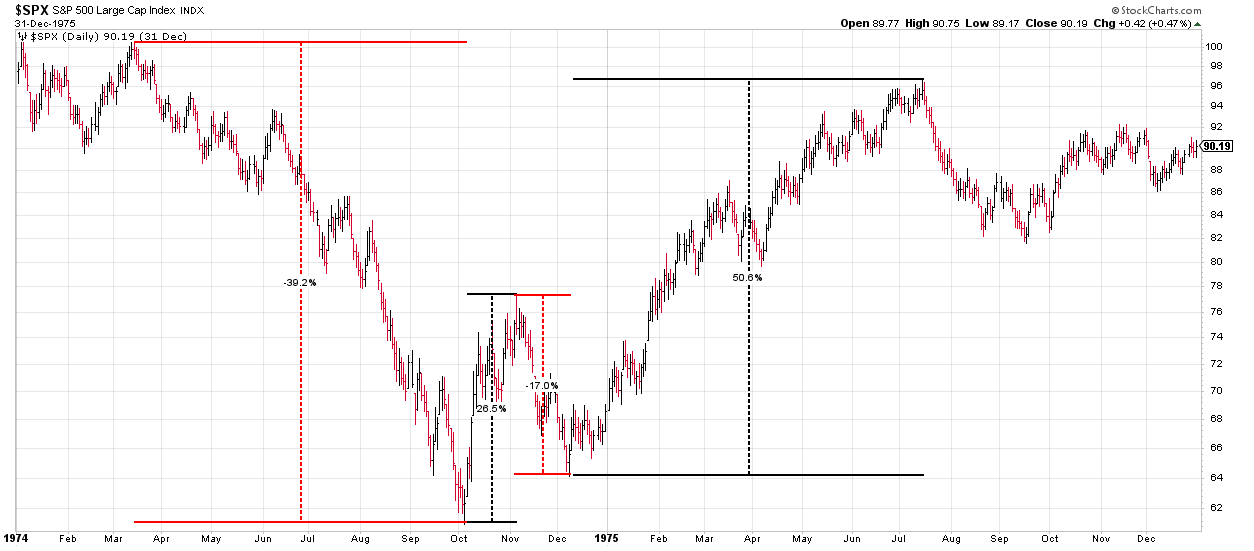
From March of 1974 to October, the S&P 500 fell by 39%. Stocks then rallied by 26%, and then a 17% market decline. This was punctuated by the oil crisis and stagflation.
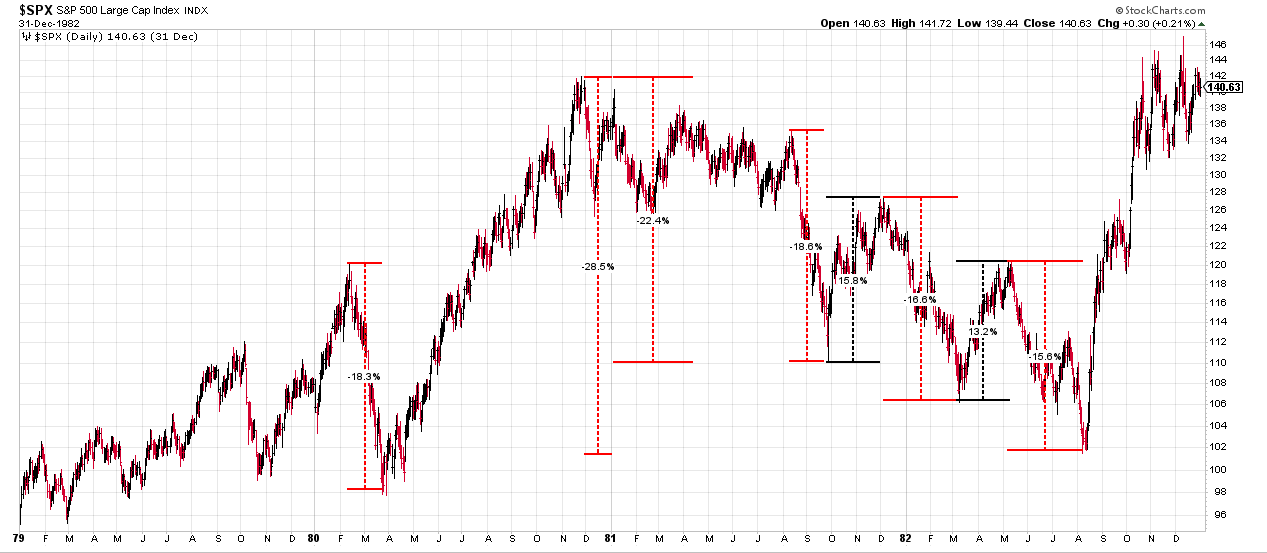
There was an 18% decline from February through March of 1980, the market rallied from there until November. This period was impacted by the spillover effects of inflation from the 1970s, there was another energy crisis in 1979 due to the Iranian revolution and tight monetary policy. After the interim rally, stocks would fall by 29% until August of 1982. Initially, stocks traded up and down in a range before an 18% drop than a 16% rally, a 17% drop, a 13% rally, and then a 16% decline.
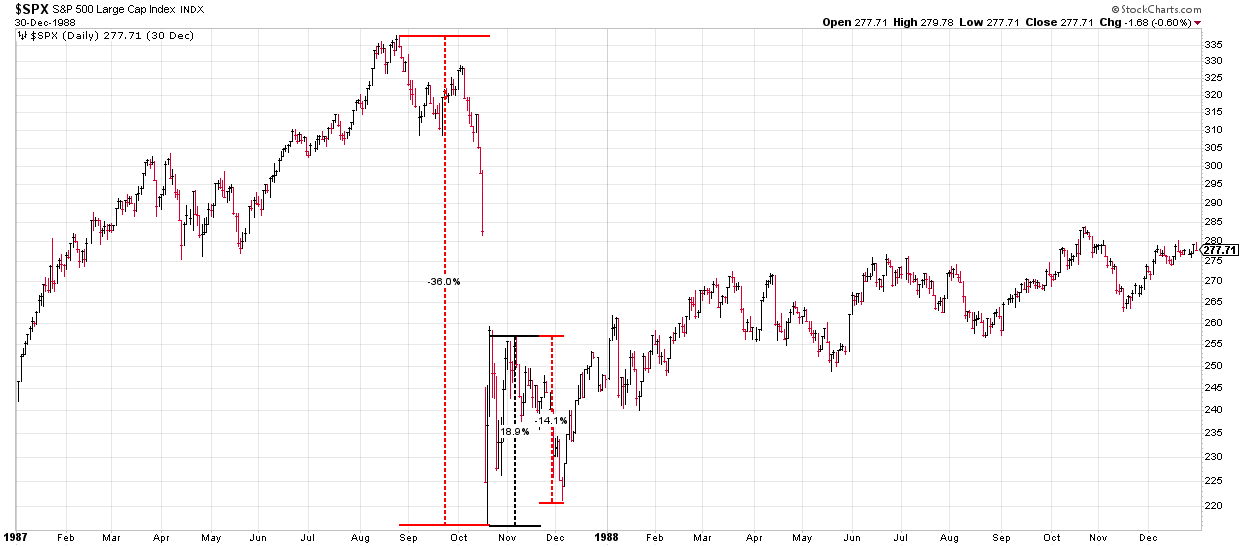
The market crash of 1987 created a 36% fall, followed by a 19% rally, a 14% decline, and then the rally.
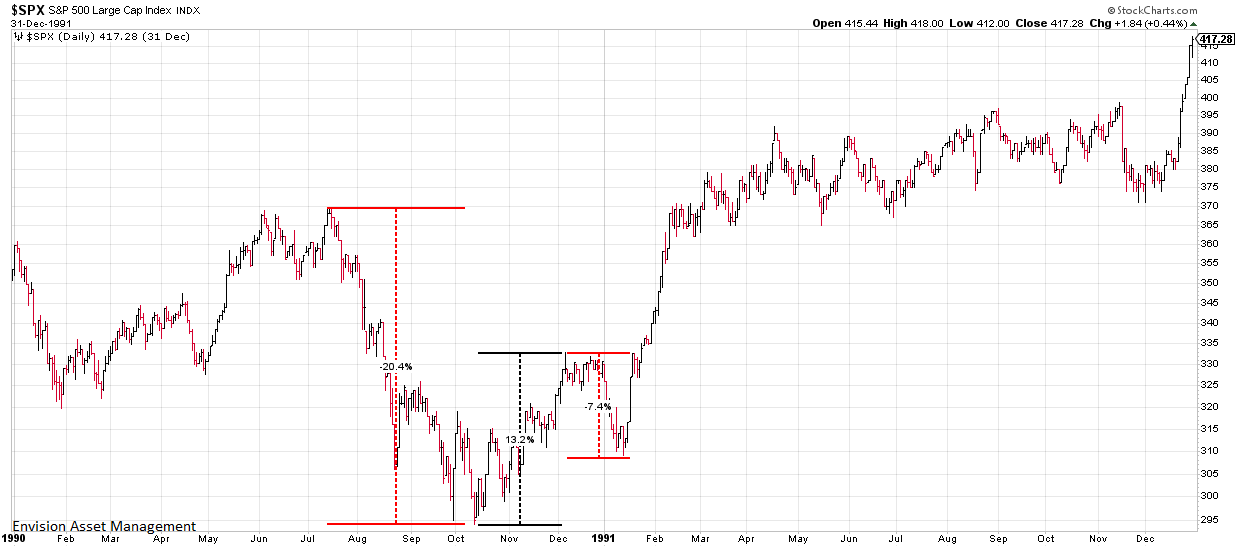
There was a 20% sell-off from July of 1990 until October, followed by a 13% rally and then a 7% decline. The Fed had raised interest rates in previous years, and an oil price shock due to the Iraqi invasion of Kuwait.
In 1998 stocks dropped by 22% from July until October. In between, the initial decline was 21%, the up 14%, and then down another 14%.

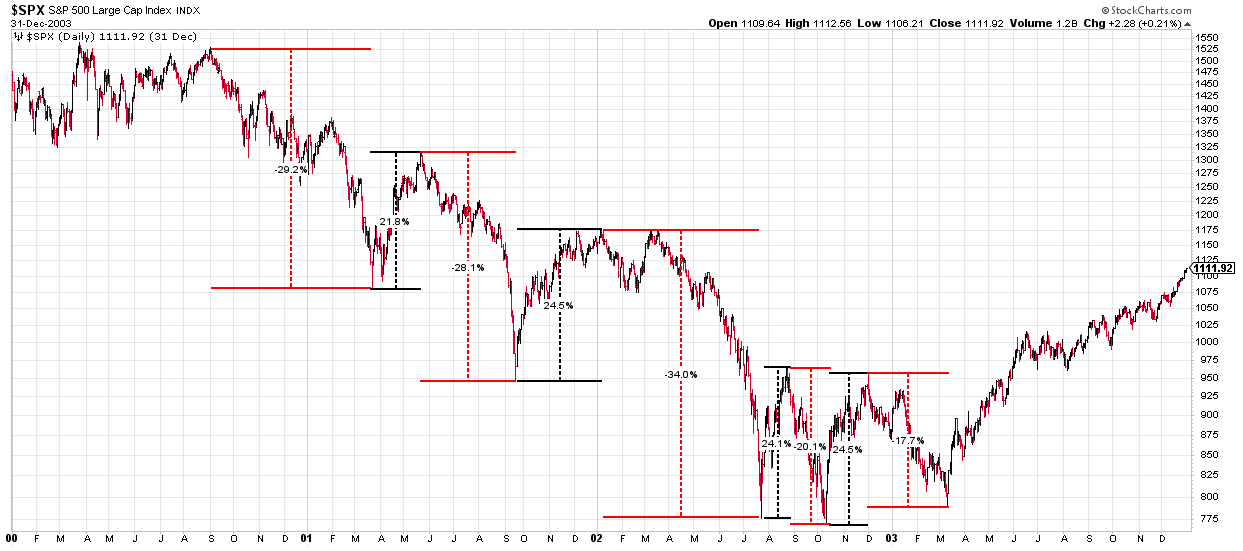
The 2000 crash led to a series of declines, rallies, and then further declines that ran through 2003.
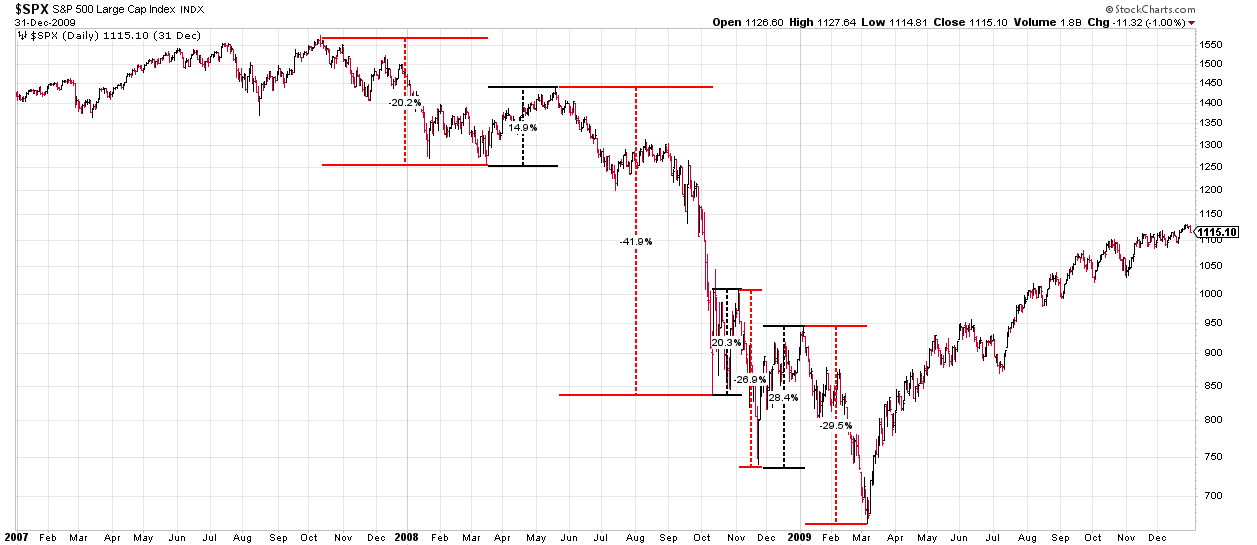
Like in 2000, the Great Recession of 2007-2009 also had a series of rallies and declines.
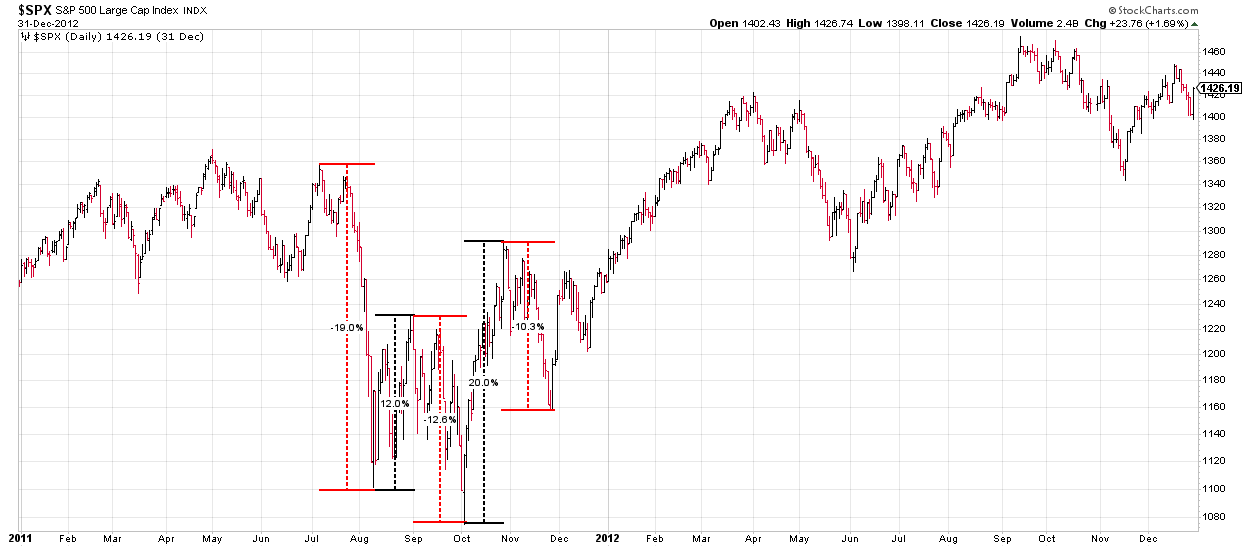
In 2011, stocks fell by 19% followed by a 12% rally, then a 12.6% decline to a new low, then up 20% and down 10% before a sustained rally.
Finally, in 2018, there was a 20% decline in the last quarter of the year. Stocks rallied from there, and never retested the low.

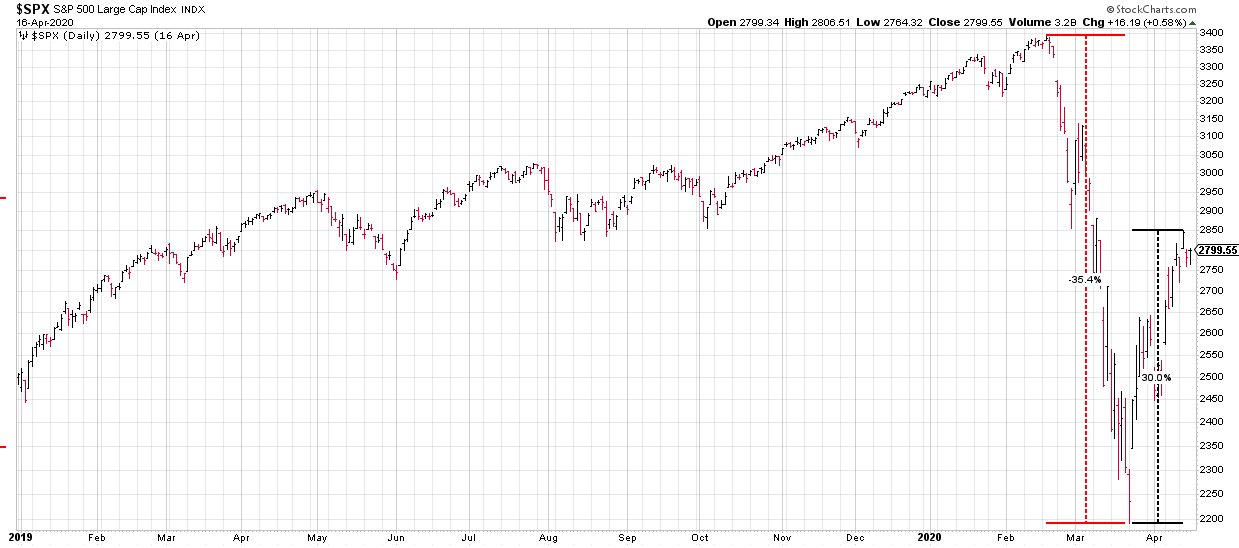
Which leads us to where we are today, a 35% decline followed by a 30% rally. Net net, the market is down about 17%.
Of the 17 market declines we have shown above, the initial low was tested 12 times and that low was broken 11 times. Of the six times where the initial low was not tested, there was a sell-off of greater than 10% after the initial rally four times. Of the remaining two declines, in 1990, there was a 13% rally and then a 7% sell-off. The only time there was not a subsequent sell-off after the initial rally was 2018.

And then, if you look at the time periods, when there was a major economic downturn, 1929, 1937, and 2007, stocks had a substantial sell-off after the initial decline.
There are a lot of differences between now and the 1930s, mainly the aggressive government intervention and that medicine could put an end to this at some point in the next year or so, and we outlined some of the bullish case up above, but given history, there is a good chance the market we will test the lows (maybe break them) or come close to it.
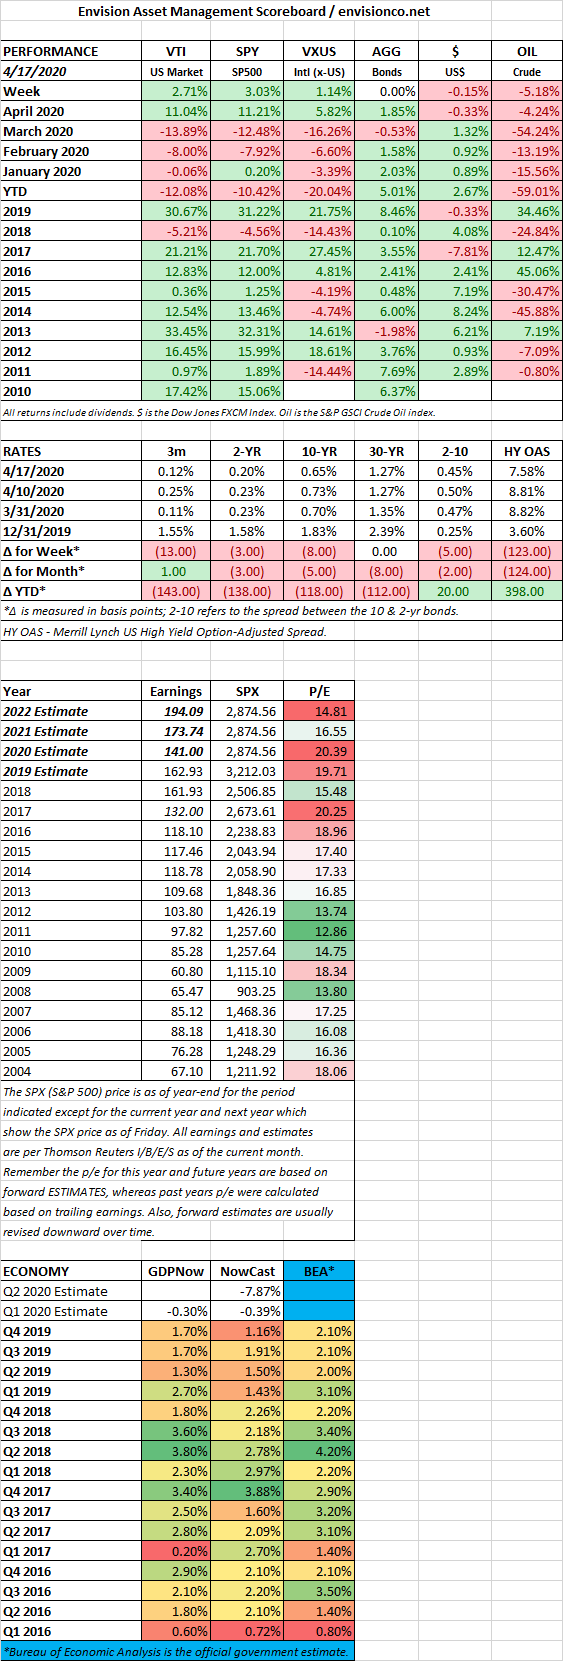
SCOREBOARD