PERFORMANCE
US equity markets continued to fall as Trump rallied in the polls. A Clinton victory was priced into the market but Trump is now threatening. Markets view a Trump victory as a major threat to the status quo. There are a lot of questions on what would ultimately happen with trade, taxes and other policies. Clinton is the known quantity and that is what investors like.
The market has fallen for nine days in row, the first such stretch since December of 1980. However, the drop has been relatively contained. The fall is just 3.1%. The SP500 is now 4.8% off its August 15 high. By contrast, in 1980, the nine-day losing streak dropped that market 9.4%. If the market drops on Monday, that would be 10 in a row, that last happened in 1975. The all-time losing streak is 12, dating back to 1966.
Fivethirtyeight.com has the chances of a Clinton win at 65%. Should Trump pull the upset, the conventional wisdom is a market sell-off in the 5-10% range. Investors and most economists are frightened by a potential trade war. But conventional market wisdom is often wrong and sentiment is negative going into the election. A Democratic sweep for the House and the Senate, would also probably lead to a sell off. A Clinton victory with the Republicans holding the House and the Senate, or at least the House, seems to be what the market wants and that could set up a relief rally. Another scenario that would be negative would be no clear winner emerging Tuesday night.
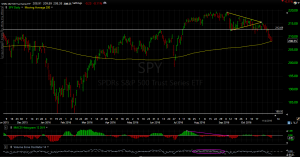
We have written about the poor technical condition of the market the last few weeks. The market did break a support level this past week and is now resting on its 200-day average. If it can’t hold there, the next line in the sand is the 203 and then the 198 area. The FBI announced on Sunday that they won’t seek charges against Clinton after reviewing the newly discovered emails, that will likely rally the market.
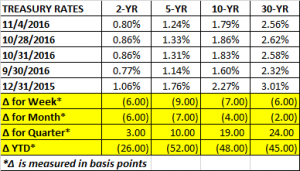
Treasury rates fell across the curve. The dollar declined and crude was off by almost 9%.
EARNINGS
Earnings have been solid so far this quarter. According to Factset, 71% of SP500 companies have reported earnings above their mean estimate. The blended earnings growth rate for the index is +2.7%, likely marking the end of the five-quarter losing streak.
FED RATE HIKE
The employment reports continue to point toward a December rate hike. Assuming that there is not a big negative reaction to the election, December will likely be the first rate increase in one year. Non-farm payroll employment increased by 161k, and prior months were revised upwards by 44k. The six-month annualized increase in private-sector average hourly earnings came in at 3.1%, showing that wage pressures are building and the Fed will exceed its 2% inflation target. The unemployment rate fell to 4.9%, although that was helped by a decline in the workforce.
GDP
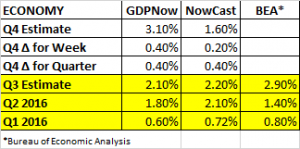
The Atlanta Fed’s GDP Model GDPNow put in their final Q3 estimate at 2.1% growth. The model opened up their Q4 estimate at 2.7% and it was then raised to 3.1% to close the week. Higher forecasts for consumer spending, equipment investing and exports helped raise the estimate. The NY Fed’s Nowcast currently forecasts Q4 growth at 1.6%.
GLOBAL ECONOMY
The October PMI reports show that the economic outlook around the world is improving. Many countries are making new highs and growth trends appear to be broadening. The US was up 1.9 points to 53.4. The Eurozone increase by 0.9 points to 53.5.
VLMAP
Here is an argument on why equity returns will be low over the next few years. Value Line, an equity research firm that covers 1,700 stocks, publishes the median estimate of appreciation over the next three to five years. This is called the Value Line Median Appreciation Potential (VLMAP). It currently stands at 40% which represents an 8.8% annualized return. That number sounds pretty good. But historical research has shown that the VLMAP number tends to be on the optimistic side. The 40% expected appreciation potential is in the lowest decile of readings dating back to the 1960s. In contrast, the expected appreciation was 185% in March of 2009, that turned out to be a good signal to go long. But is the system foolproof? Of course, the answer is no. The readings were also at 40% four years, since then, the market returned 6.4% annualized. As with other valuation models, the level of interest rates is a huge factor that can and has altered historical tendencies.
THE CUBS INDICATOR
And finally, if you are looking for a reason to go long, here is an indicator that comes along every 100 years or so. The last time the Cubs won the World Series prior to this year, in 1908, the DJIA rallied 8% in the following month!


