HIGHLIGHTS
- Support holds as equities manage a 2% advance.
- Markets are still stretched looking at a quarterly chart.
- Tesla takes a hit in both the equity and fixed income markets.
- The yield curve flattens as interest rates decline.
- A comparison between the post-election equity markets after Kennedy won in 1960 and today.
- Economic news was good this week.
MARKET RECAP
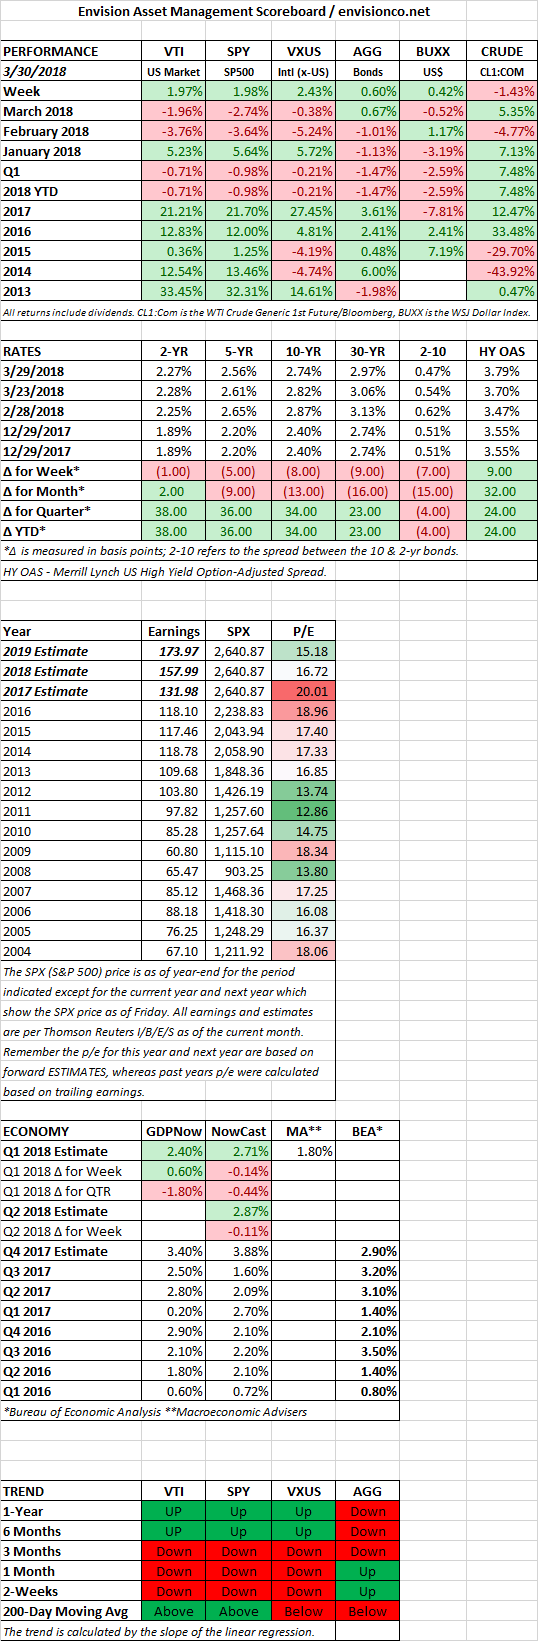
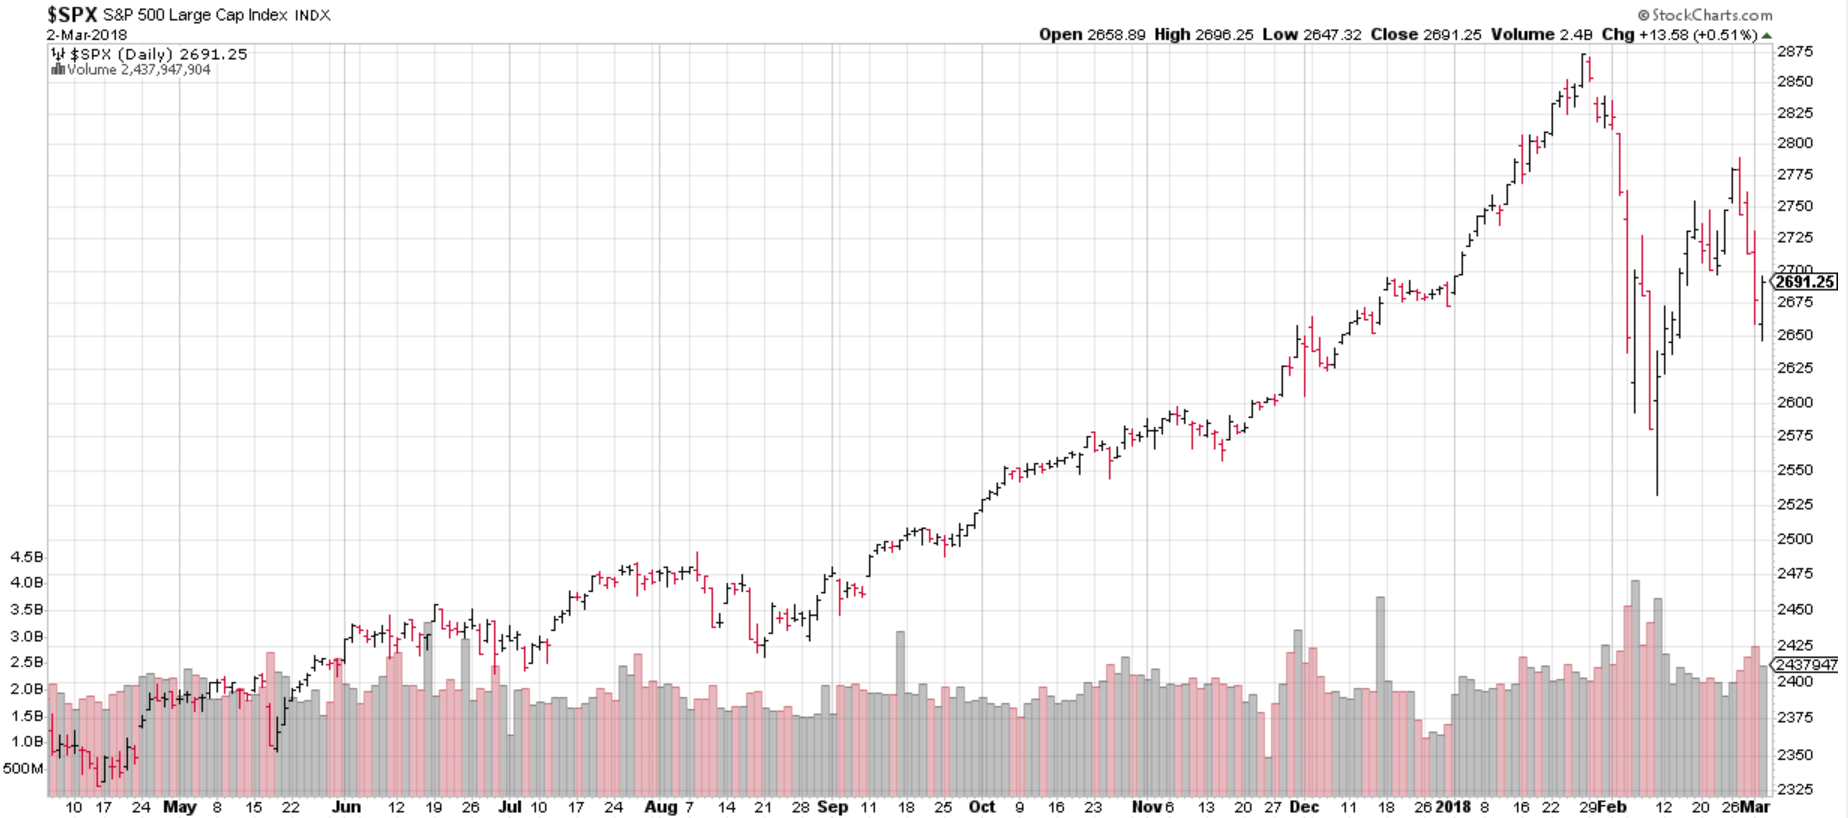
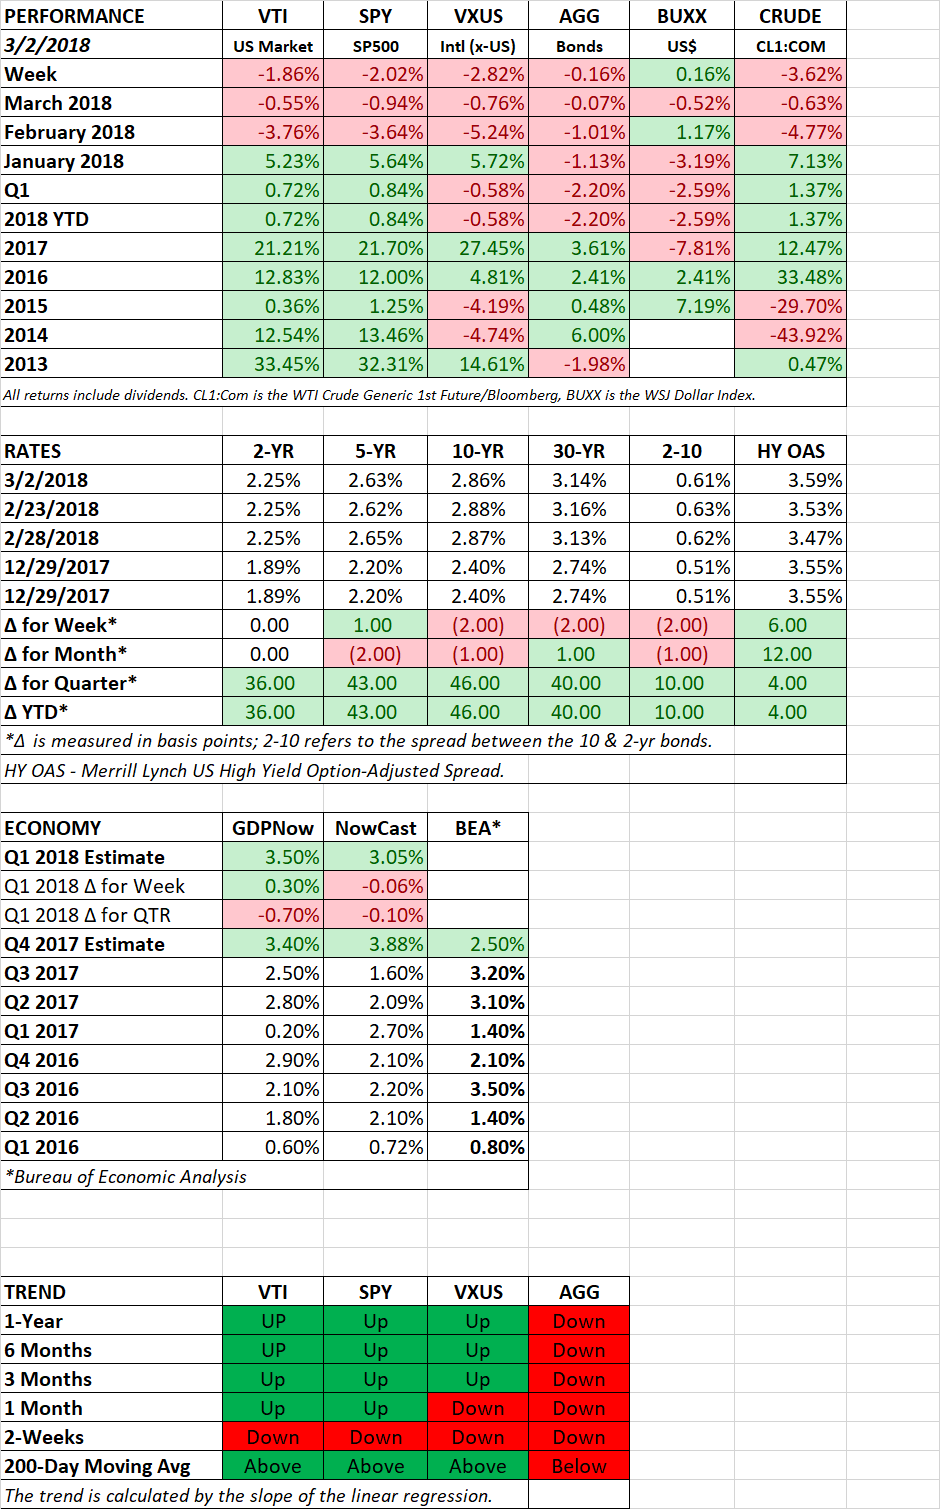
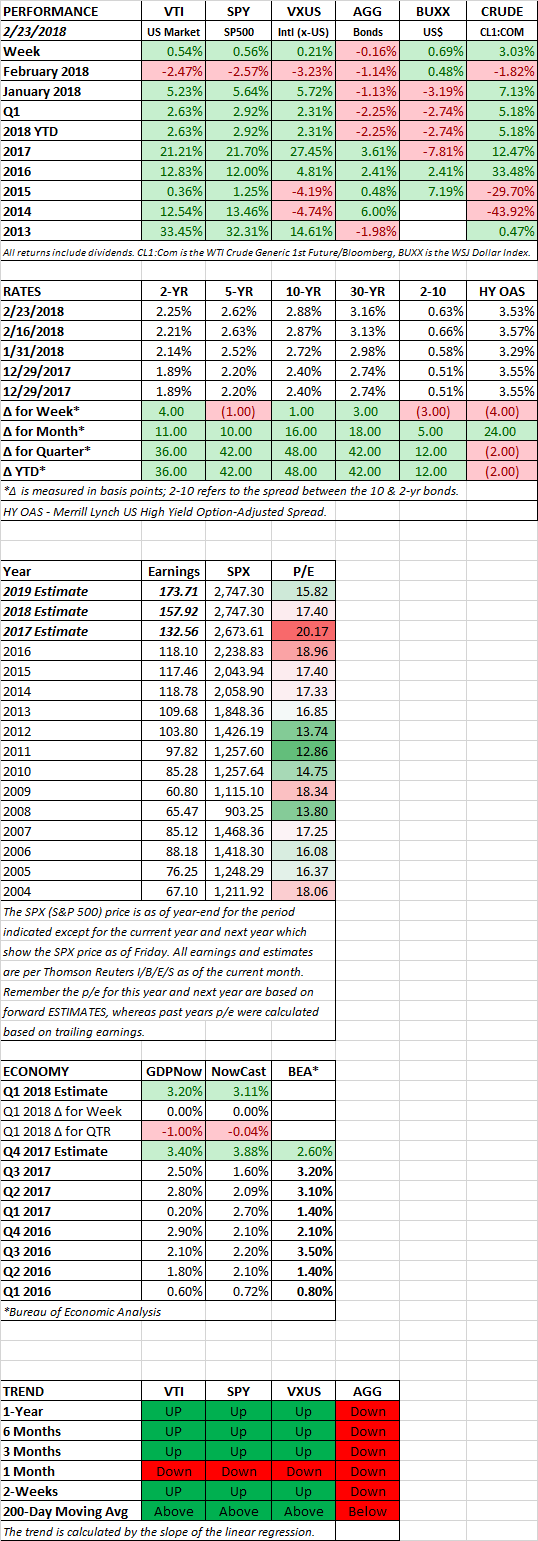
Equities bounced off the 200-day moving average and increased by about 2% in the US and 2.43% outside the US. For the month, US stocks were down by 1.96% and international stocks fell by 0.38%. Year-to-date, US and international equities were down by 0.71% and 0.21% respectively. It was the first losing quarter since Q2 of 2015.
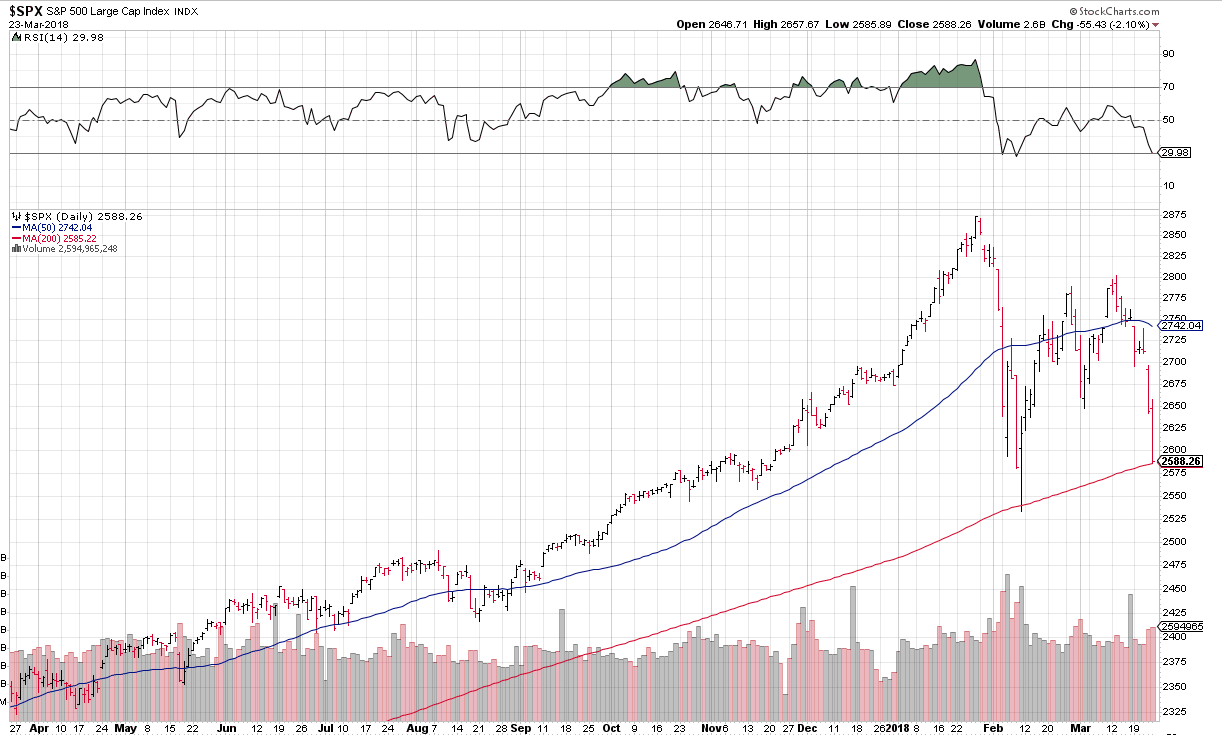
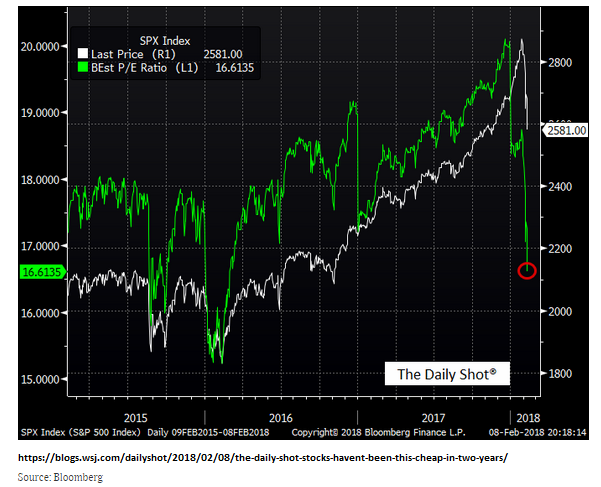
Even with the loss, looking at a quarterly chart (see below) from a technical perspective, the market still looks overbought. The relative strength index (RSI) on the top of the graphic, shows a current reading of 80.91. A measurement over 70 is considered overbought, which could mean a pause or a fall for stocks. Or it could mean nothing at all, as evidenced by the market’s performance in the 90s, when it continued to advance despite being labeled as overbought for a good portion of the decade.

Tesla, a high flyer for most of the past few years, closed the week at $266.13 and is now down 31.87% from its September high of $385. Tesla bonds have been falling in value as higher interest rates and negative cash flow are starting to spook investors. Tesla will most likely have to tap the equity or bond markets at a future point if cash continues to burn up. Facebook, which is off by 17.25% from its January high, managed a small gain for the week.
Bonds were up for the week and the month. The aggregate increased by .60% for the week. Bond yields fell across the curve, but the decline was greatest on the long end. The spread between the 2 and the 10-year treasury declined to 47 basis points, that is the lowest difference of the year and has brought back fears of a flattening yield curve. Most recessions are preceded by a flat or negative spread.
TRUMP V KENNEDY
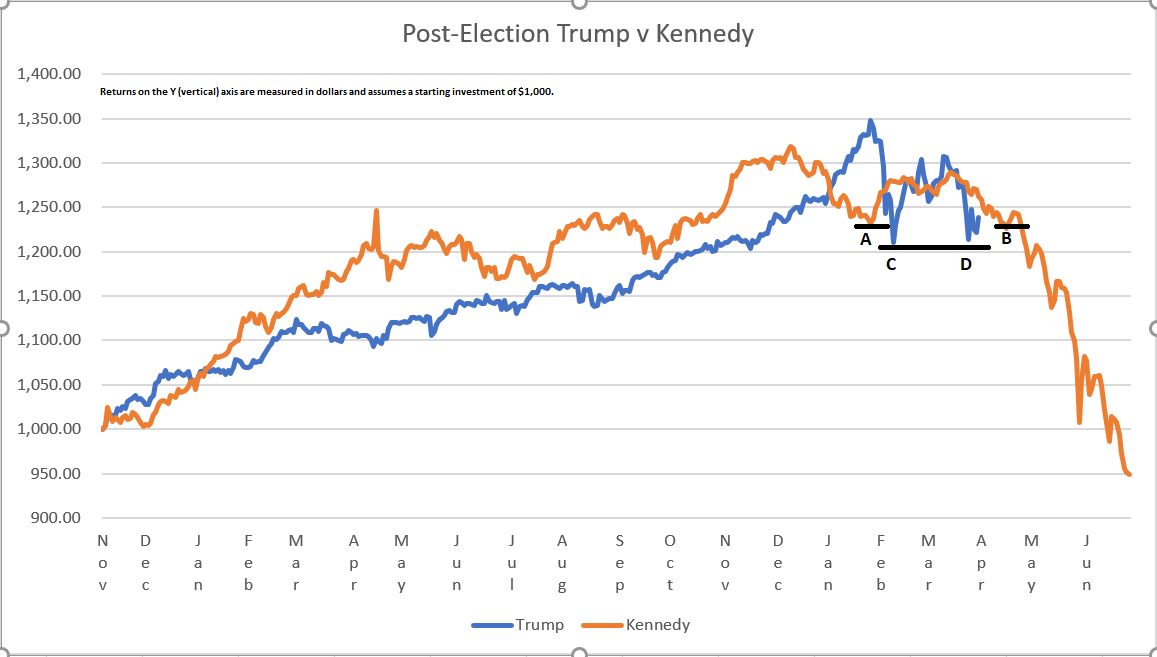
Comparisons have been made between the market run-up post-election in this cycle and a similar advance after Kennedy won in 1960. In both cases, the market flew higher after the election. And in each case, the economy was growing with no near-term signs of a recession. Valuations were similar, with p/e ratios in the 22+ range.

From the day before each election, until the end of the third quarter, the Kennedy market rallied by 26.20% as measured by the S&P 500. That compares to the current Trump rally of 26.41%. A mere difference of 21 basis points. It is what happened next in 1962 that is of interest.
Last week, the current US market bounced off a double bottom (see C & D below). That may or may not hold. In 1962, a similar double bottom (see A & B below) was broken and the market fell hard through June by 22.95%. From the December 1962 high, the decline was 28%. The good news was that the market then went on for a huge rally and had matched the December 1962 high by September of 1963 and would have a strong advance from there. A testament to why a long-term view is often the better approach.
We are not saying that we will get a repeat of 1962 here in 2018, but the comparison is striking. And it is always good to look back at history to see what has happened before.
ECONOMIC NEWS
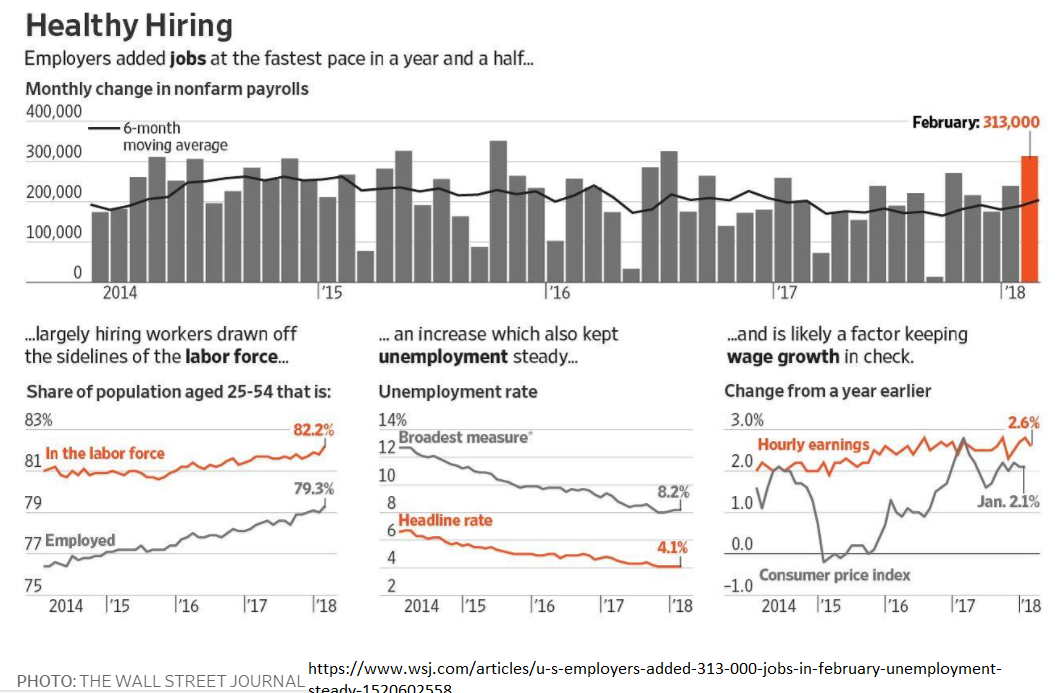
For the most part, the economic news was positive. The estimate for Q4 2017 growth was raised to 2.90% from 2.50% by the Bureau of Economic Analysis. Initial jobless claims were 215,000. That is the lowest number in 45-years. And estimates for Q1 growth were raised by the Atlanta Fed to 2.40% from 1.80%. The NY Fed Nowcast model has growth at 2.71%.
SCOREBOARD