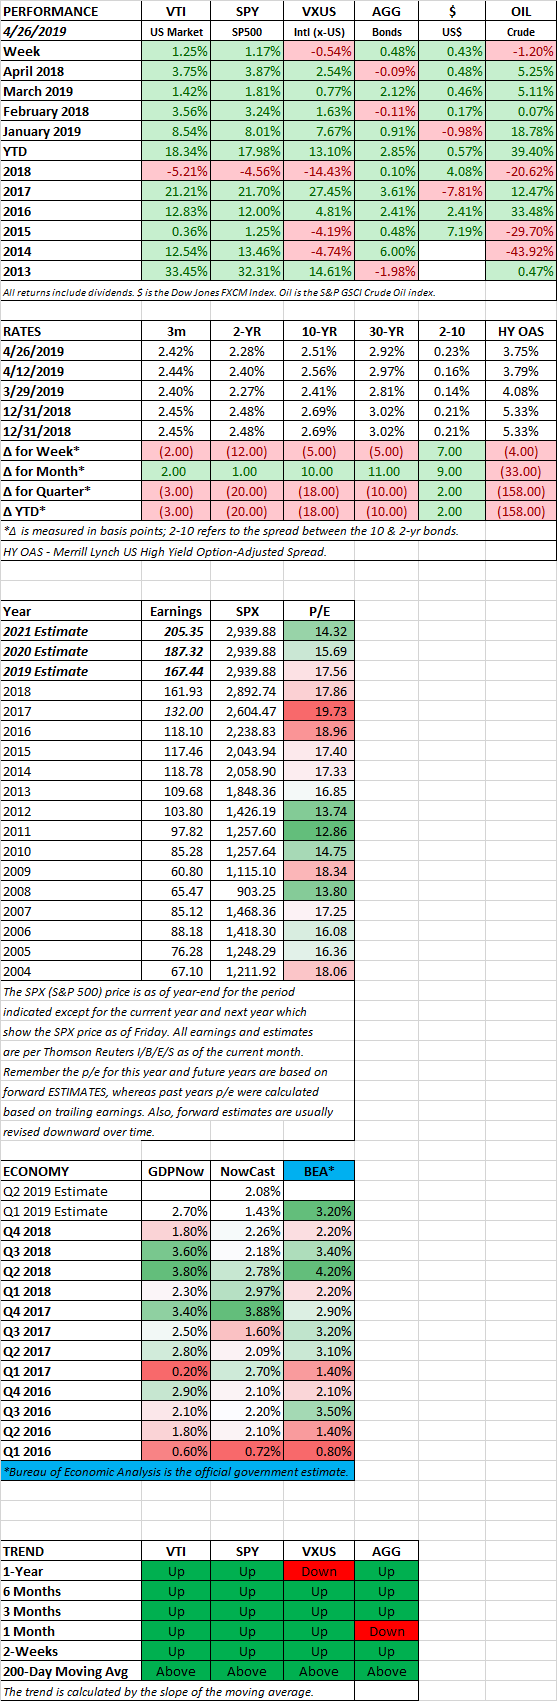
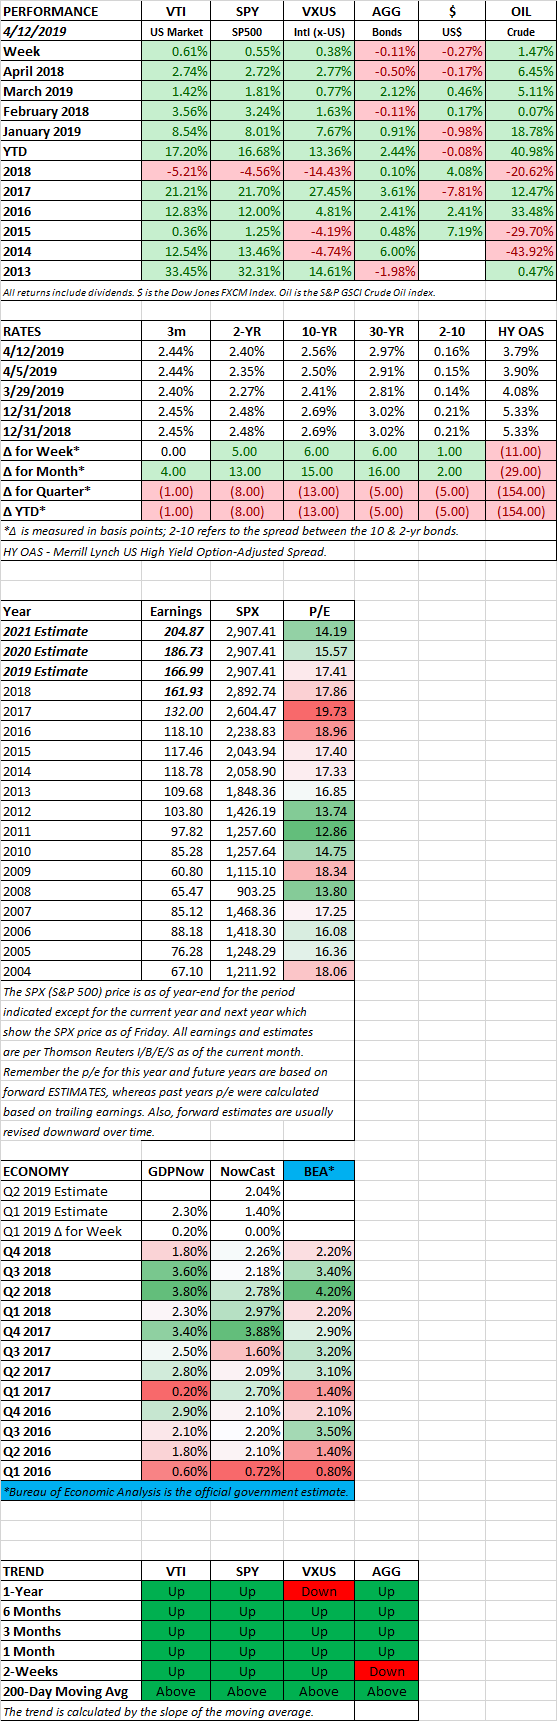
MARKET RECAP
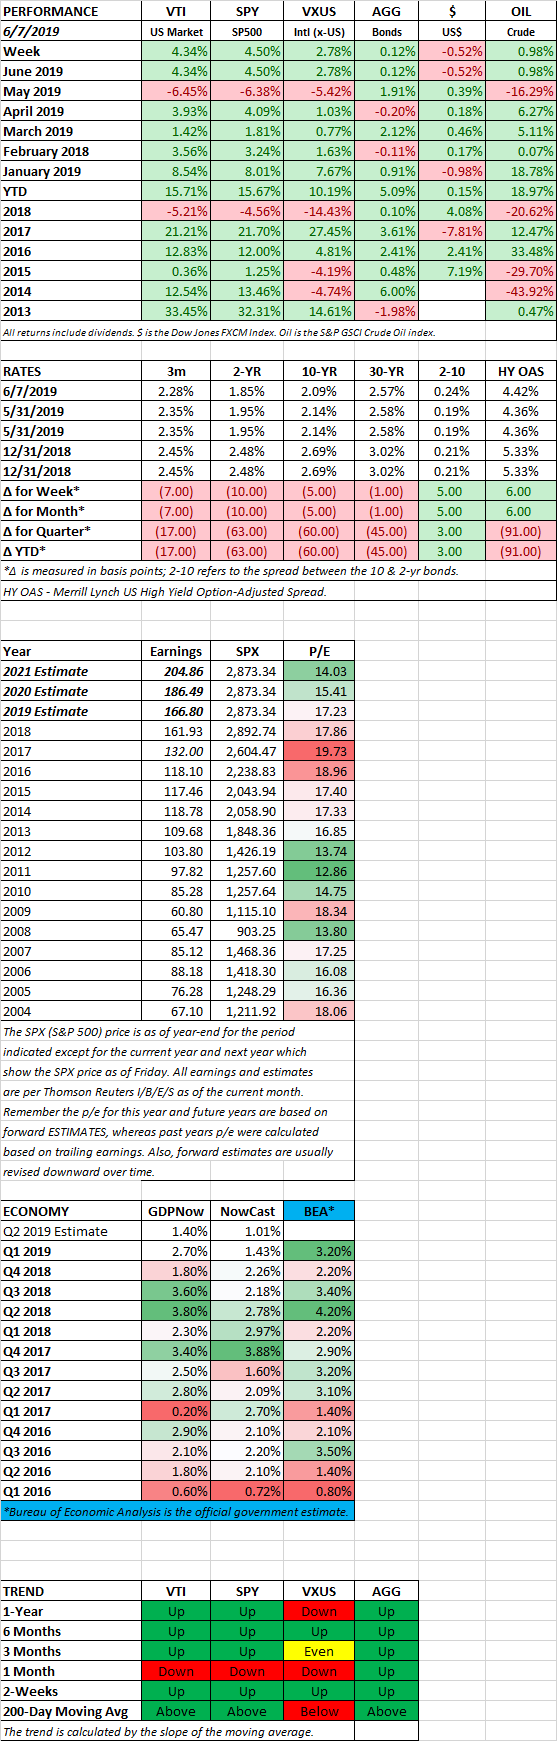
Stocks around the world went into a strong rally during the week. US stocks had their best day in five months on Tuesday after Federal Reserve officials discussed possibly lowering interest rates. The Dow advanced by 512 points or 2.1%. The S&P 500 matched the 2.1% increase and the NASDAQ surged by 2.6%. St. Louis President James Bullard said that a lowering of rates “may be warranted.” Fed Chair Powell said, “We are closely monitoring the implications of these developments for the U.S. economic outlook and, as always, we will act as appropriate to sustain the expansion.” Things got better from there as the market moved up each day. For the week, the US stocks were up by 4.34% and international stocks by 2.78%. Bonds also increased by 0.12%.
TARIFFS
Late on Friday the US and Mexico reached a deal on immigration to avoid Trump’s threat of new tariffs.
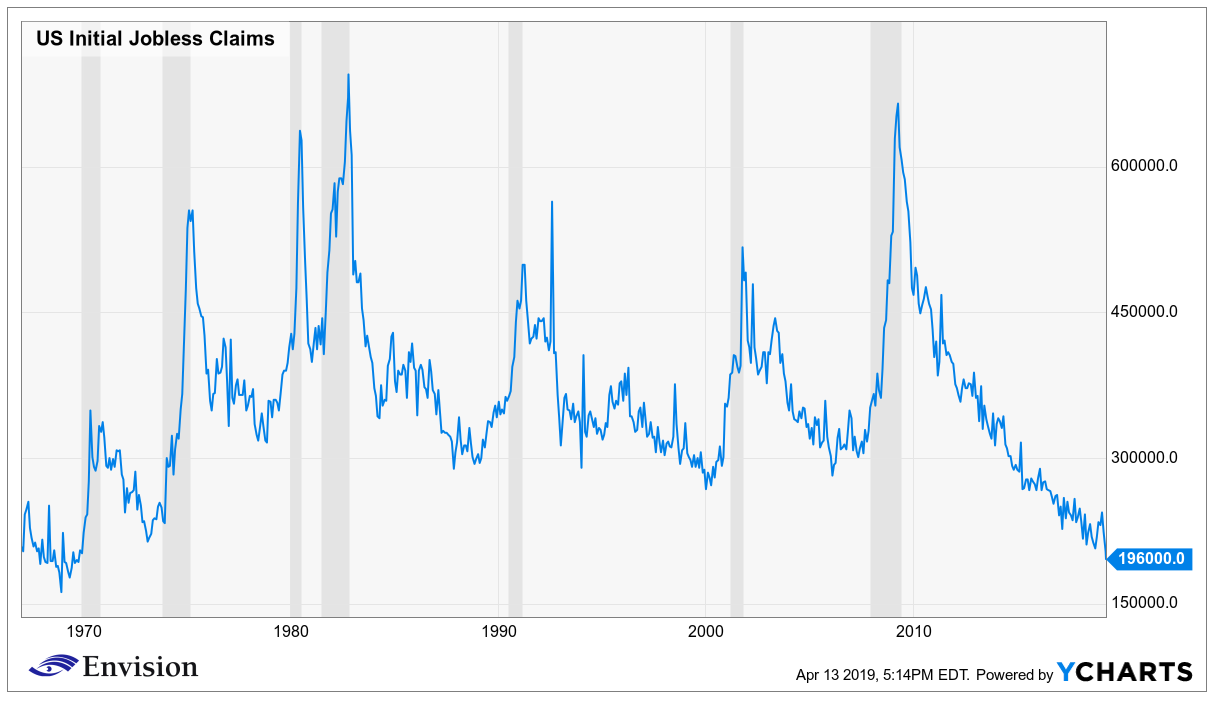
PAYROLLS
Nonfarm payrolls were up by 75,000, falling way short of the estimate of 175,000. The much lower than expected number helped raise expectations that the Fed would be more to apt to cut interest rates in the near future, thereby helping to move stocks higher. However, other gauges of the labor market are still strong, including initial claims for unemployment, a historically low unemployment rate (3.6%), higher average hourly earnings (+3.1%), and a steady average workweek (34.4 hours)
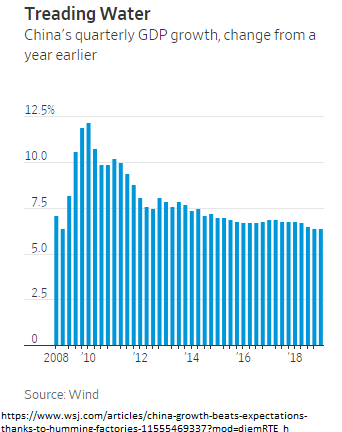
GLOBAL GROWTH
The World Bank lowered its growth forecast to 2.6% from 2.9% in January. The estimate for growth in trade fell to 2.6% from 3.6%. “There’s been a tumble in business confidence, a deepening slowdown in global trade, and sluggish investment in emerging and developing economies,” said World Bank President David Malpass. The lower forecasts are directly related to trade conflicts.
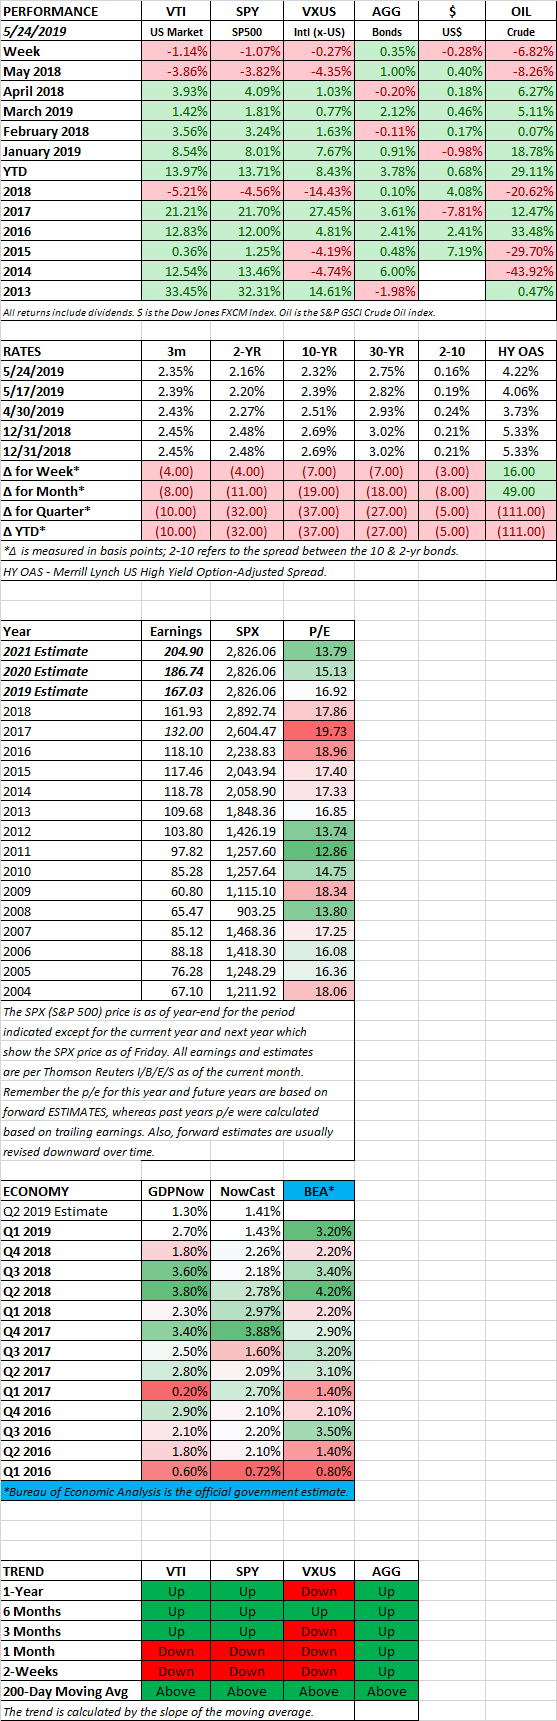
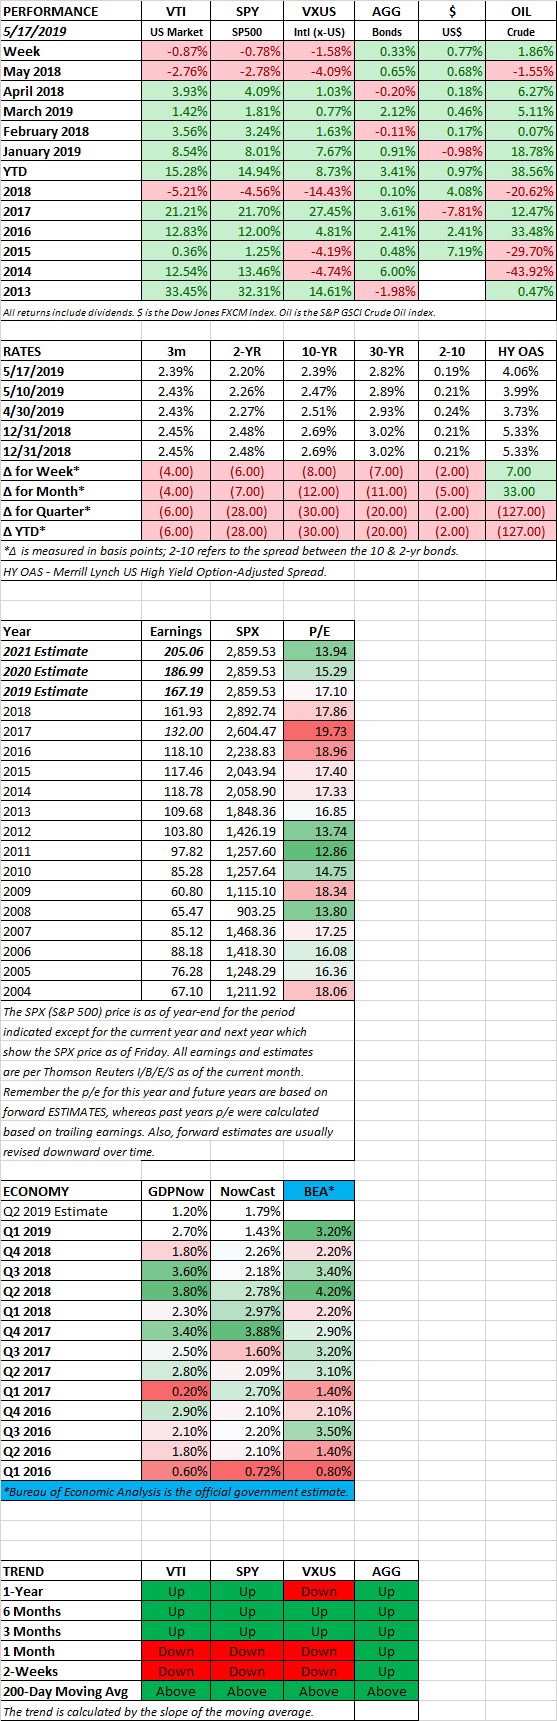
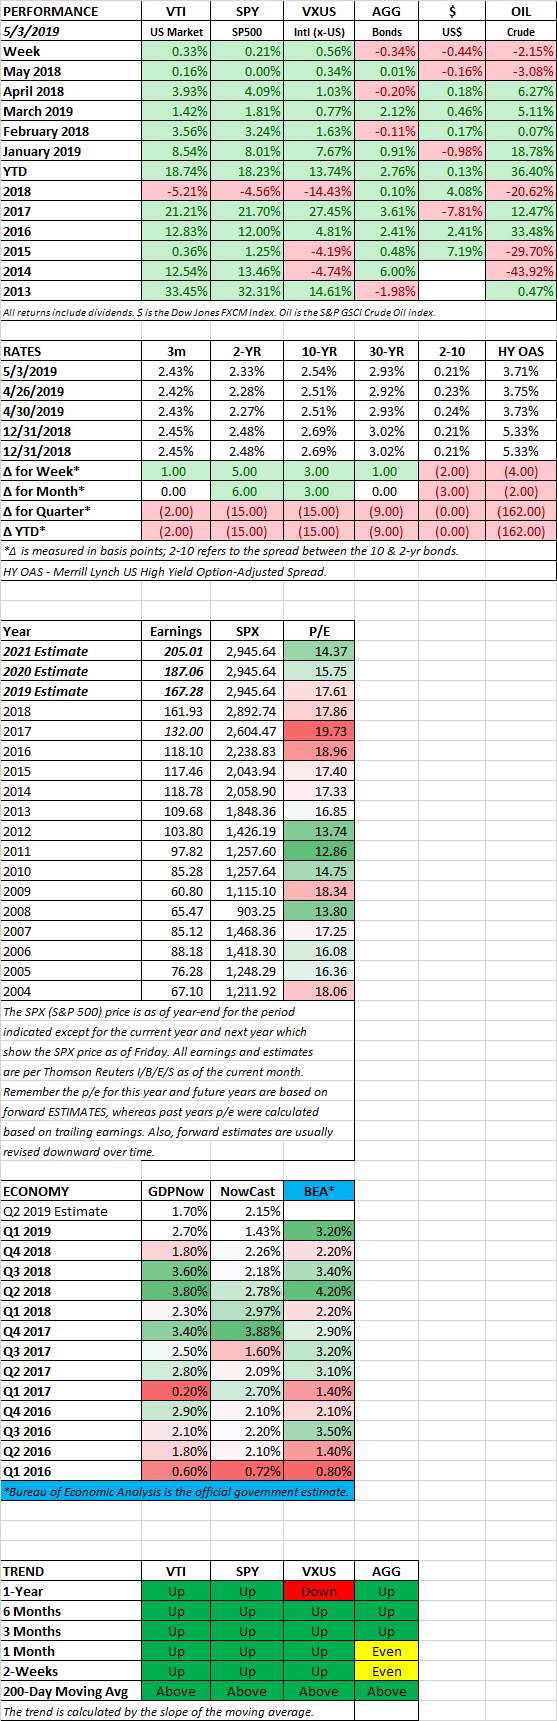
SCOREBOARD