HIGHLIGHTS
- US stocks were up 1.7% and the NASDAQ Composite hits a record. International equities advance by 0.53%.
- The world’s major central banks to meet this week.
- Declining currency values and debt problems are hurting emerging markets.
- Congress considering trying to take some power away from Trump regarding tariffs.
- Household wealth hits a record.
- The strong US job market has more openings than job seekers.
MARKET RECAP
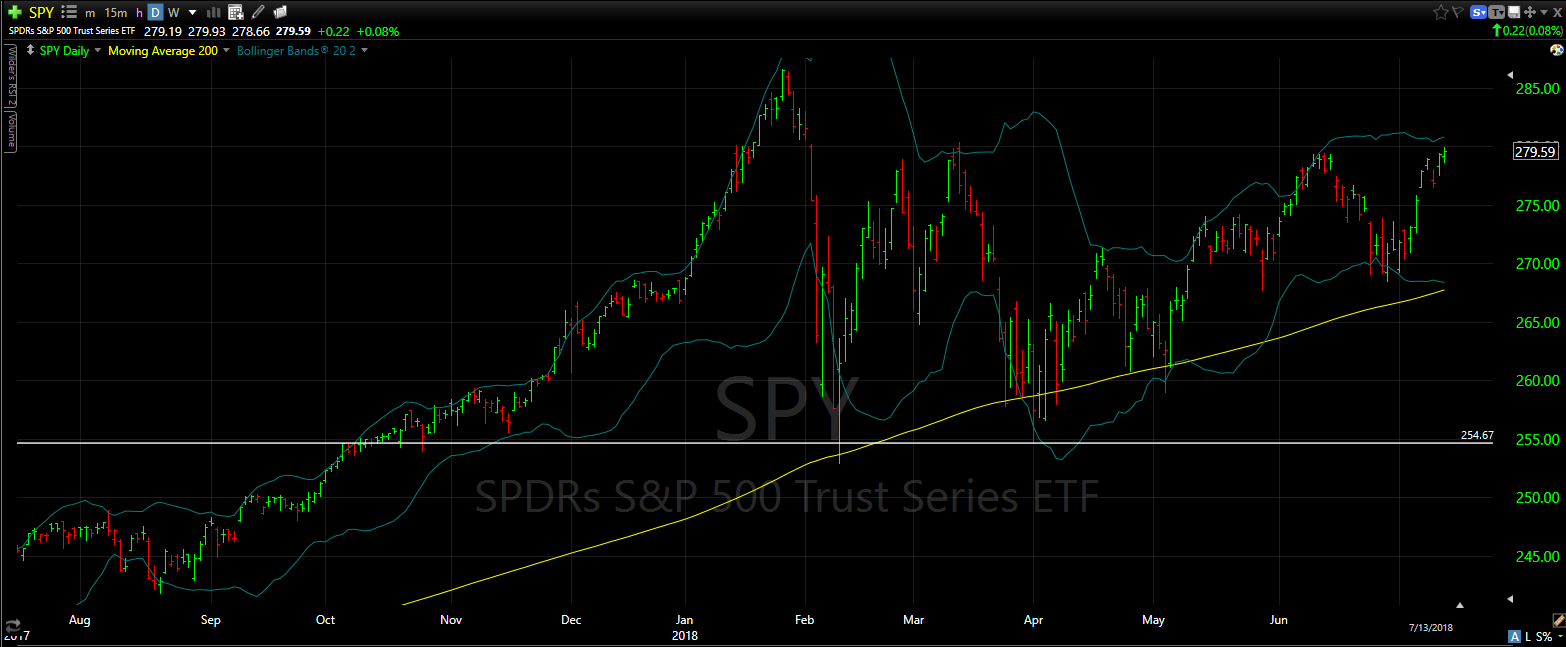
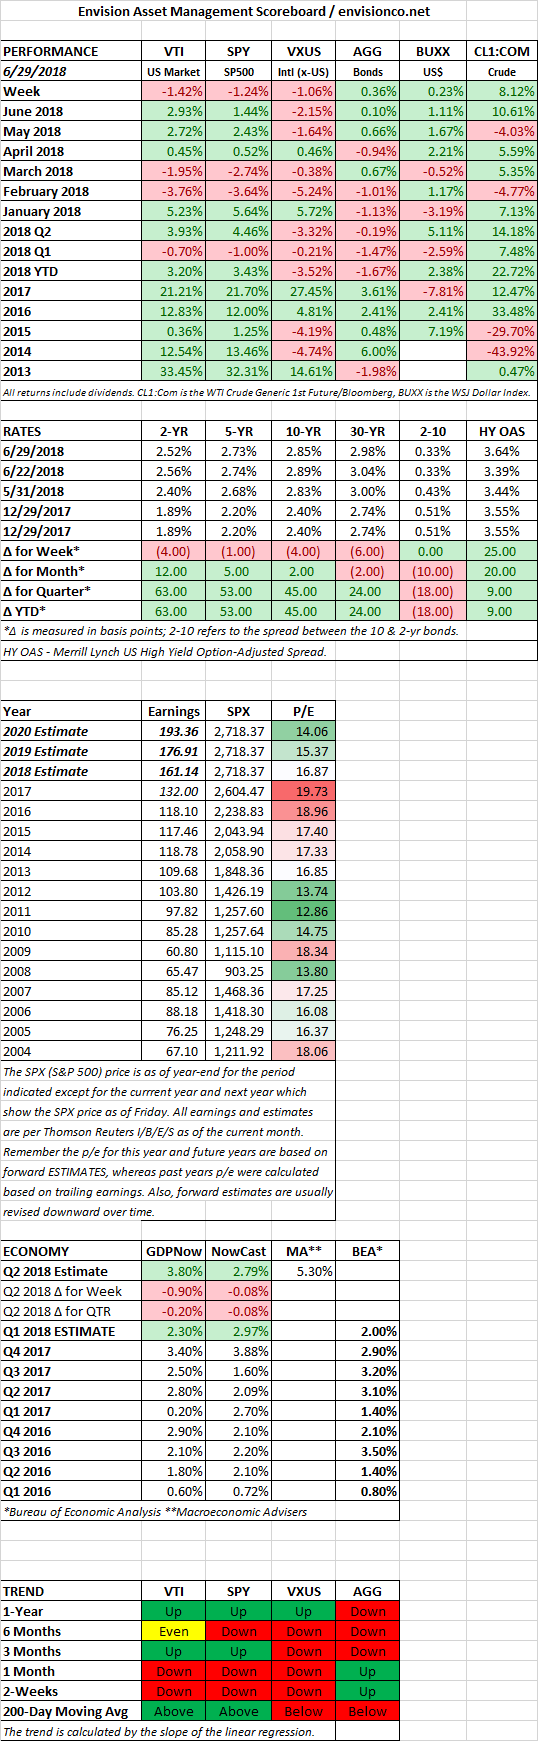
US stocks advanced by about 1.7% and international equities managed a gain of 0.53%. The tech-heavy NASDAQ Composite index hit a new record, now up 23% over the last year. The US has been outperforming international markets of late on a strong economy, threats of a trade war, European populism, and falling currencies in emerging markets.
Interest rates were up slightly and bonds fell by 0.31%. The dollar declined by 0.44% and oil was off by 0.11%.
FED/ECB/BOJ
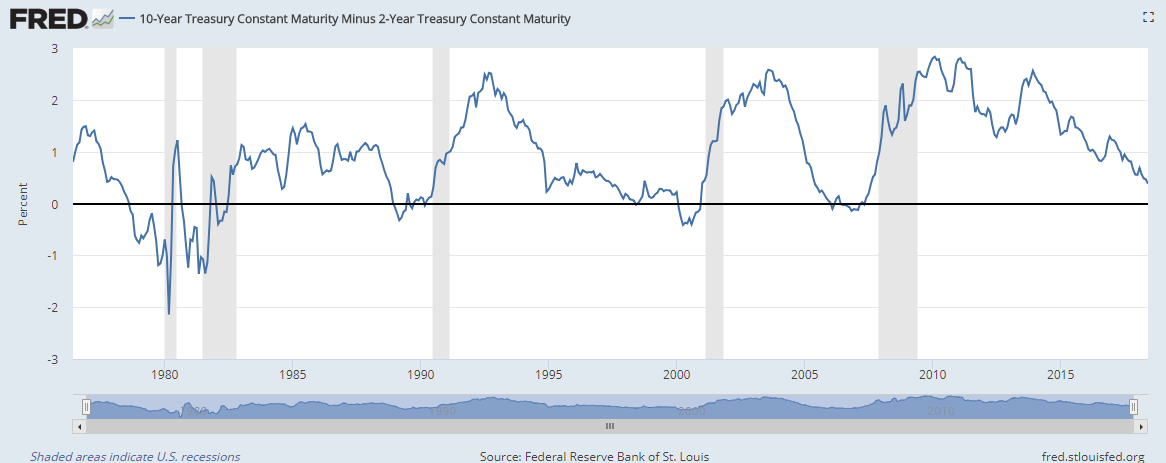
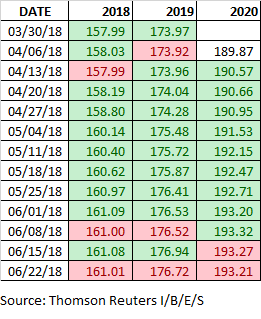
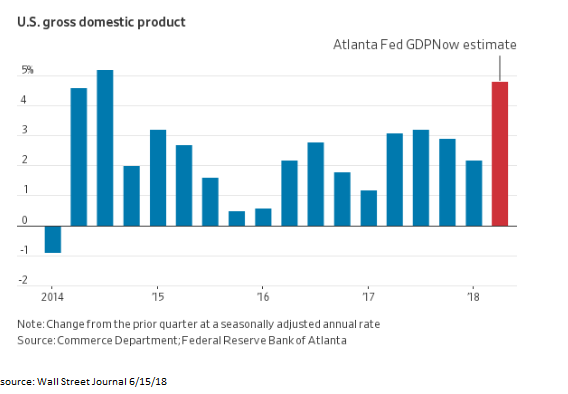
The Fed meets this to discuss interest rates. The odds favor another 0.25% hike. Investors will be more focused on the outlook for further hikes down the line. There is a current deviation between what the Fed has been forecasting for rates in 2019 and 2020 and what the market thinks will happen. The Fed is forecasting higher, the markets are expecting lower.
The European Central Bank (ECB) meets on Thursday. The ECB has continued injecting funds into the bond market, while the Fed has been withdrawing funds. If the ECB announces that they will begin to pull back on their bond purchases, markets might suffer.
The Bank of Japan meets on Friday but is expected to continue their quantitative easing.
EMERGING MARKETS
Emerging equity markets were about even this week, but are still down about 11.5% from their January peak. The sell-off might be creating bargains in some value-oriented emerging market equity funds, they are now selling at a forward p/e of around 10.
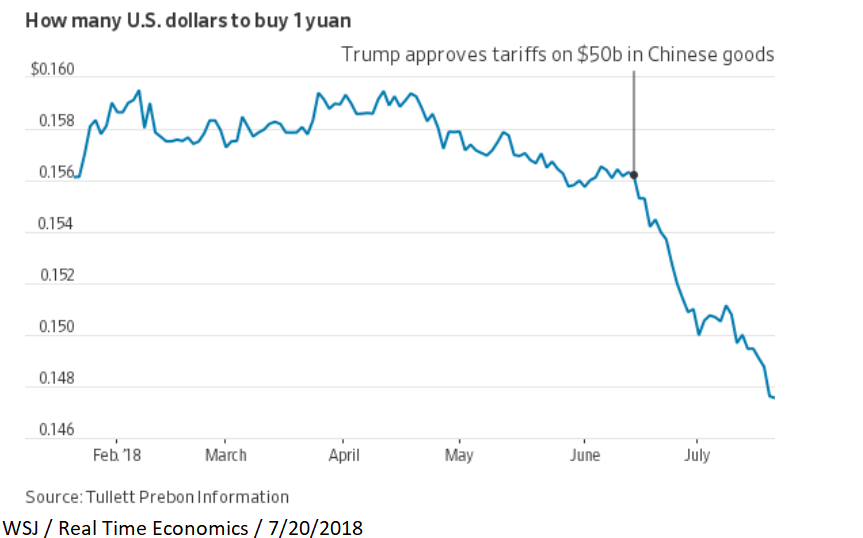
Some of the fear in emerging markets is the spillover effect of the Fed’s balance sheet unwind. The balance sheet continues to shrink, down about $19 billion over the last four weeks, helping to put upward pressure on interest rates, which hurts countries that have debt denominated in dollars. Higher US interest rates also can impact emerging market currencies. This week, Argentina secured a $50 billion credit line from the IMF, the largest ever. The Argentine Peso sank to new lows on the news. Turkey is also having problems keeping their currency afloat. Inflation is running at 12%. This week, Moodys downgraded all of the Turkey banks due to higher costs of funding.
Other emerging market countries such as Brazil and South Africa are also having problems.
Congress Considering Ramping Down Trump’s Trade Power
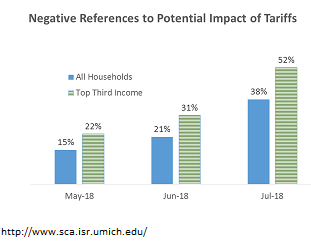
There is starting to be some talk in Congress about what they can do to tamper down Trump’s tariffs. Senators Corker and Toomey are proposing legislation to limit the President’s ability to use the 1962 Trade Expansion Act to impose tariffs based on national security concerns. Senator John Cornyn, Republican Senator from Texas said, “I would hate to see this great, booming economy, as a result of the policies of this administration, be squandered by a trade war.”
One early consequence of Trump’s tariffs is lumber. Last November the administration imposed tariffs of about 20% on Canadian lumber. Due to huge demand, lumber imports from Canada are actually up, but the prices are up way in excess of the tariff, about 45%. Somewhere in that 45% is a big tariff, and new homeowners, not Canadian producers, are paying for it.
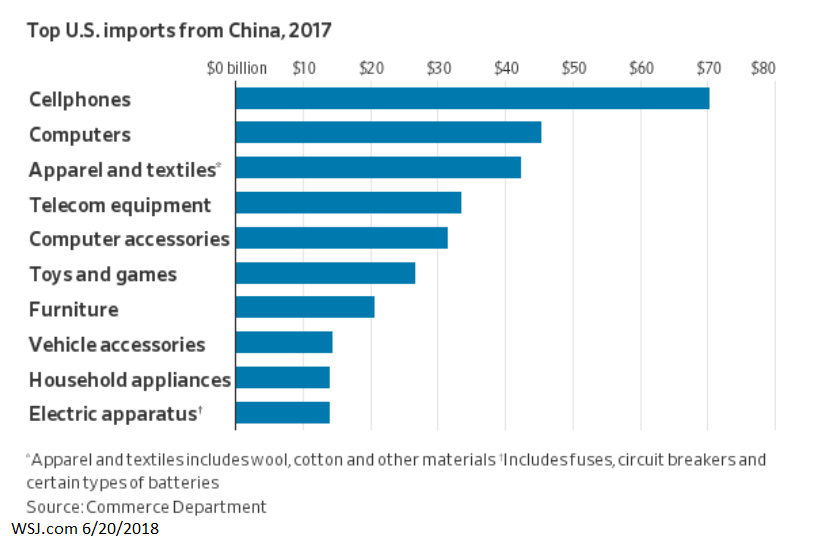
Another problem is that tariffs often miss their target. The tariffs encourage companies to figure out a way to avoid the hit. Chinese companies have shifted importing goods into the US from their factories in countries that are not being impacted by the “trade war”, such as Malaysia and Serbia.
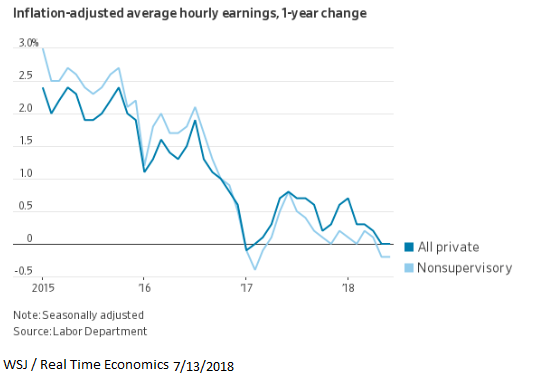
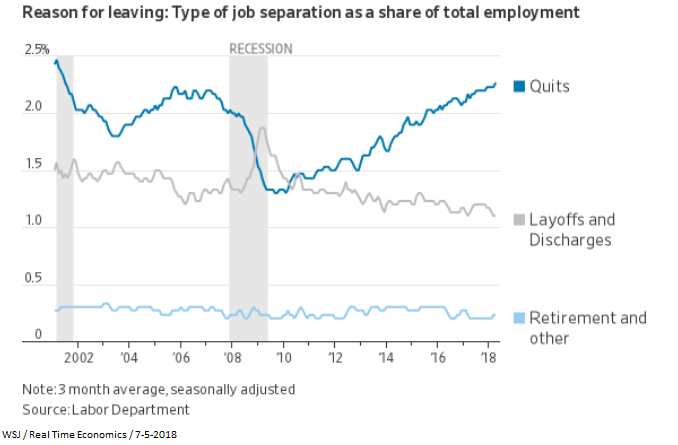
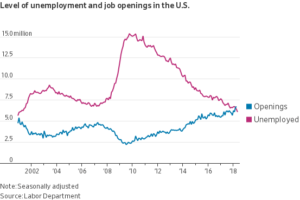
Job Openings are Greater than Job Seekers
There are more jobs available in the US right now than people seeking work. Employers are going to have to loosen hiring standards, increase wages or automate (get by with fewer workers). Either way, in the short run wage inflation, is likely to go up putting pressure on the Fed to keep pace.
HOUSEHOLD WEALTH HITS NEW RECORD
Americans’ are now worth more than $100 trillion for the first time, up 1% from the previous quarter. The milestone was set early this year helped by rising home prices. A volatile first quarter in the equity markets slowed the rate of increase.
COPPER PRICES CLOSE TO FOUR-YEAR HIGH
Copper prices are approaching a four-year high on a combination of threats to production and global growth. Labor talks between BHP Billiton and miners in Chile could slow or halt production at the world’s largest copper mine. And India has ordered a mine to be closed in that country. Economic growth around the world and more specifically in China, have also pushed up prices. The World Bank is looking for 3.1% growth this year around the globe and recent reports show solid activity in China, which consumes about half of the world’s copper.
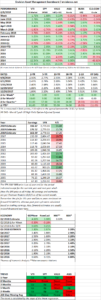
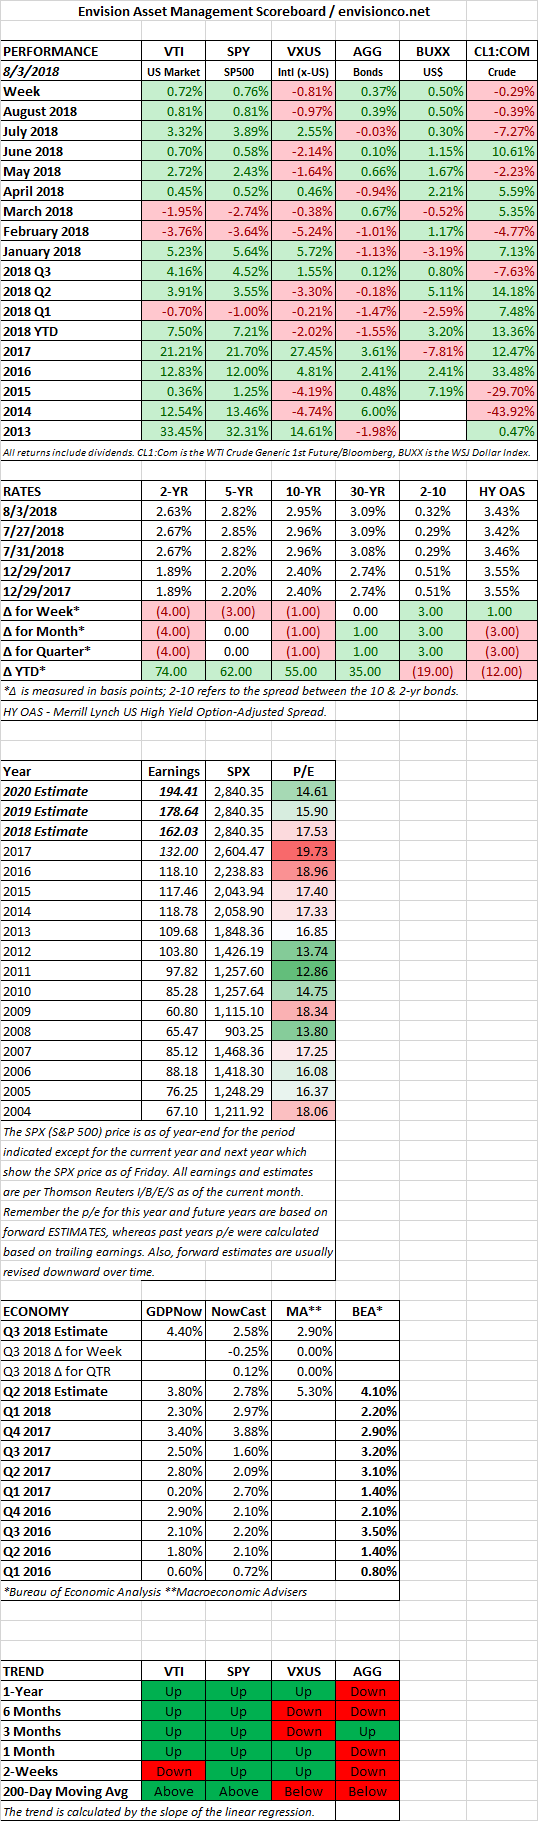
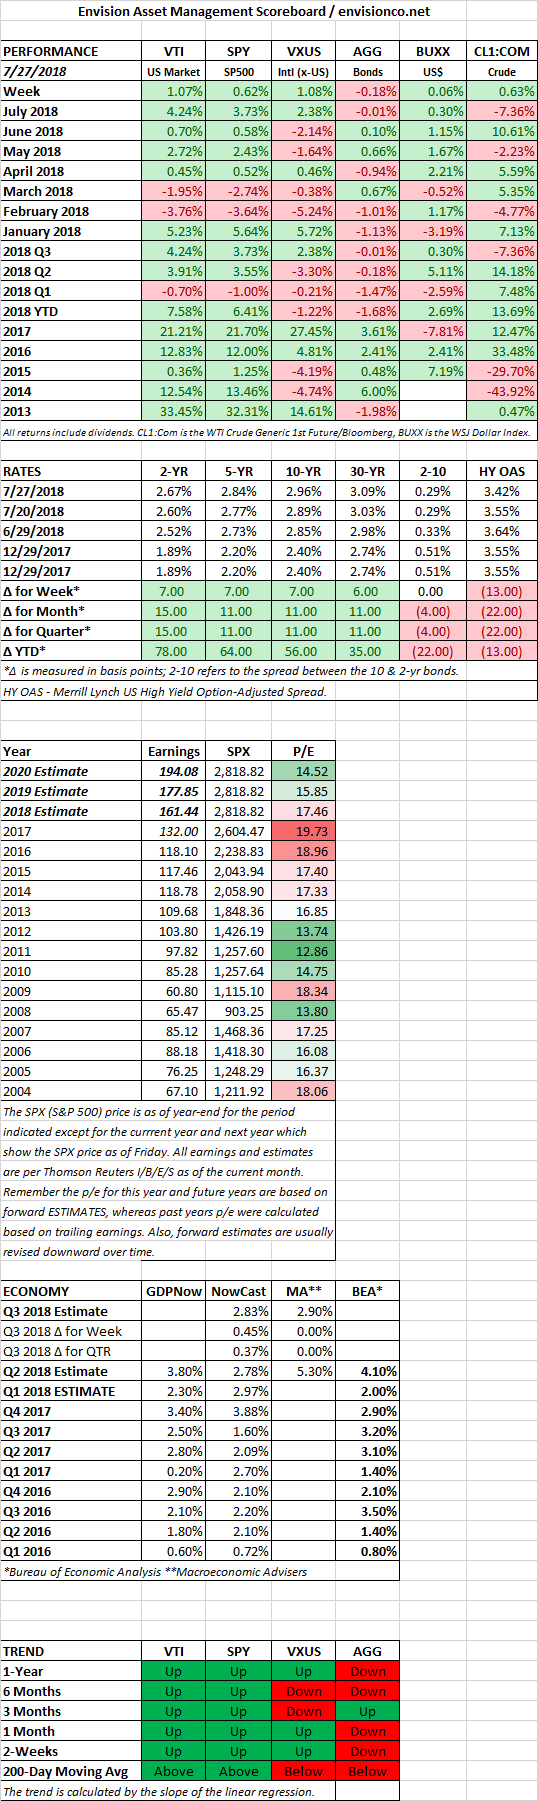
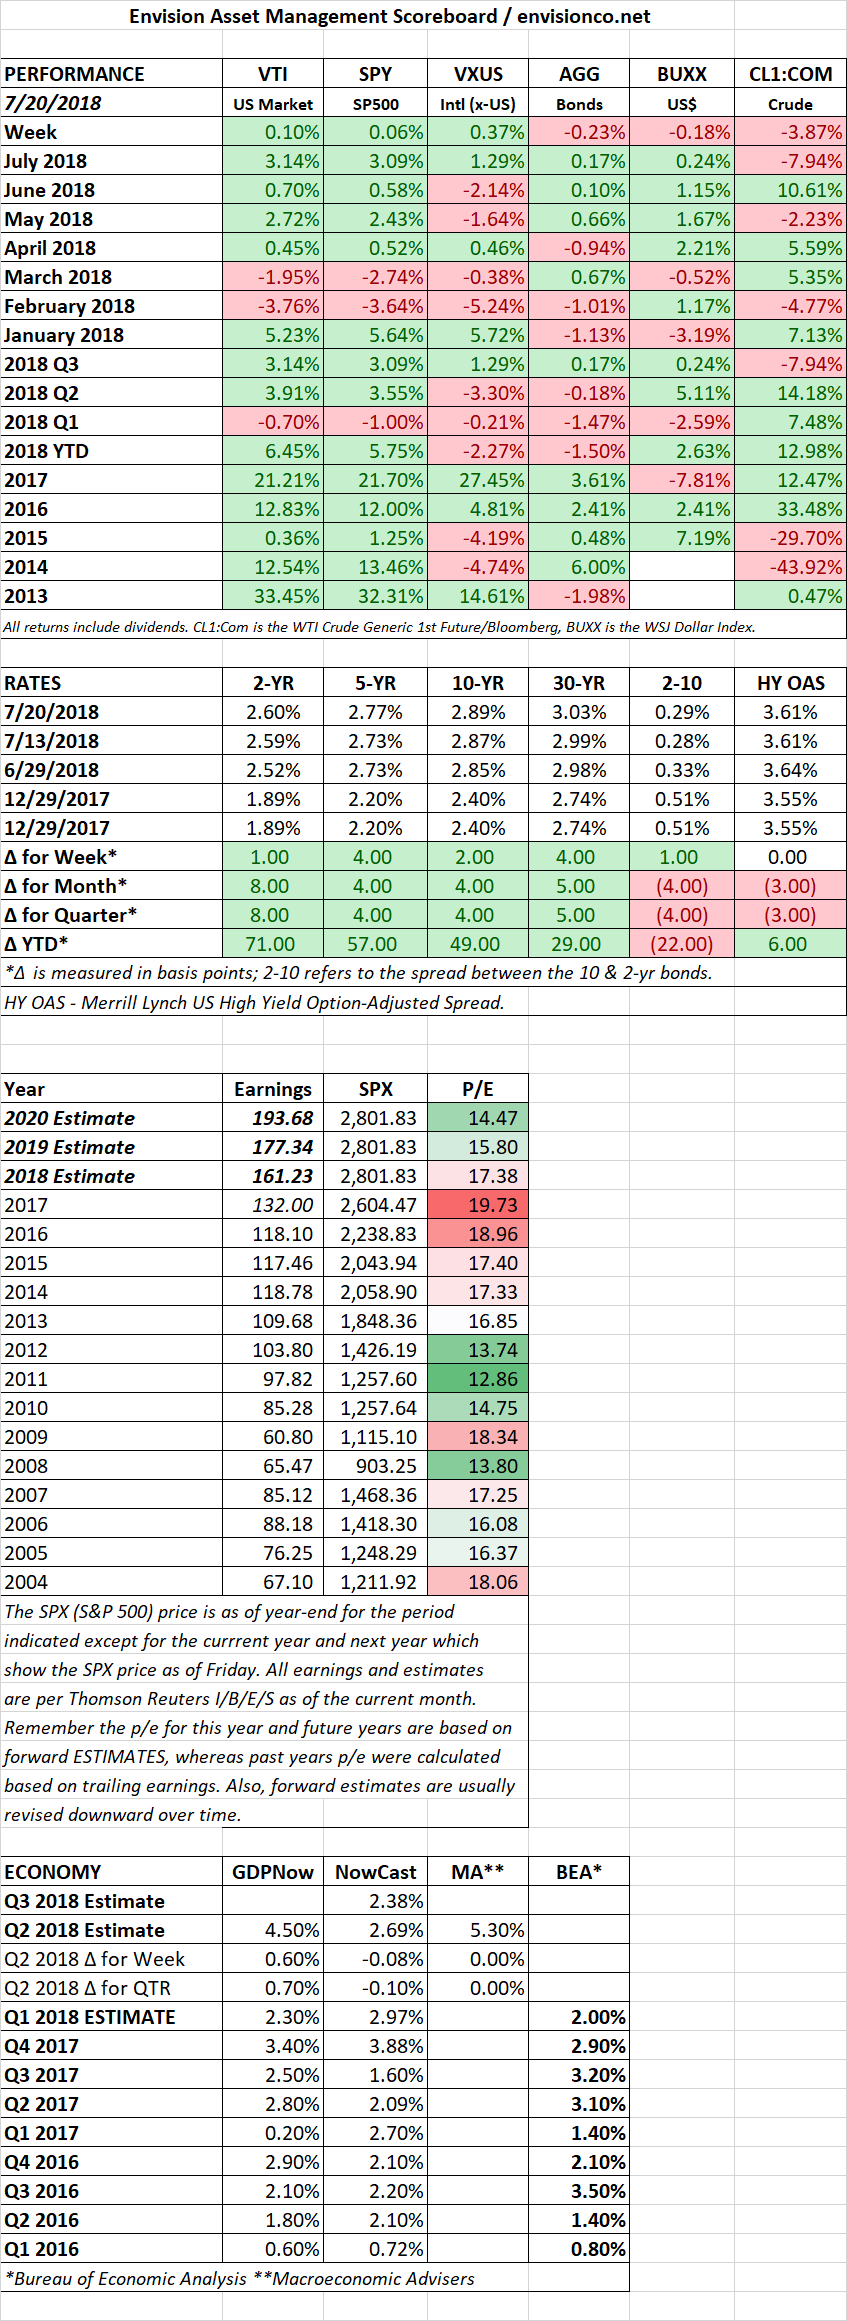
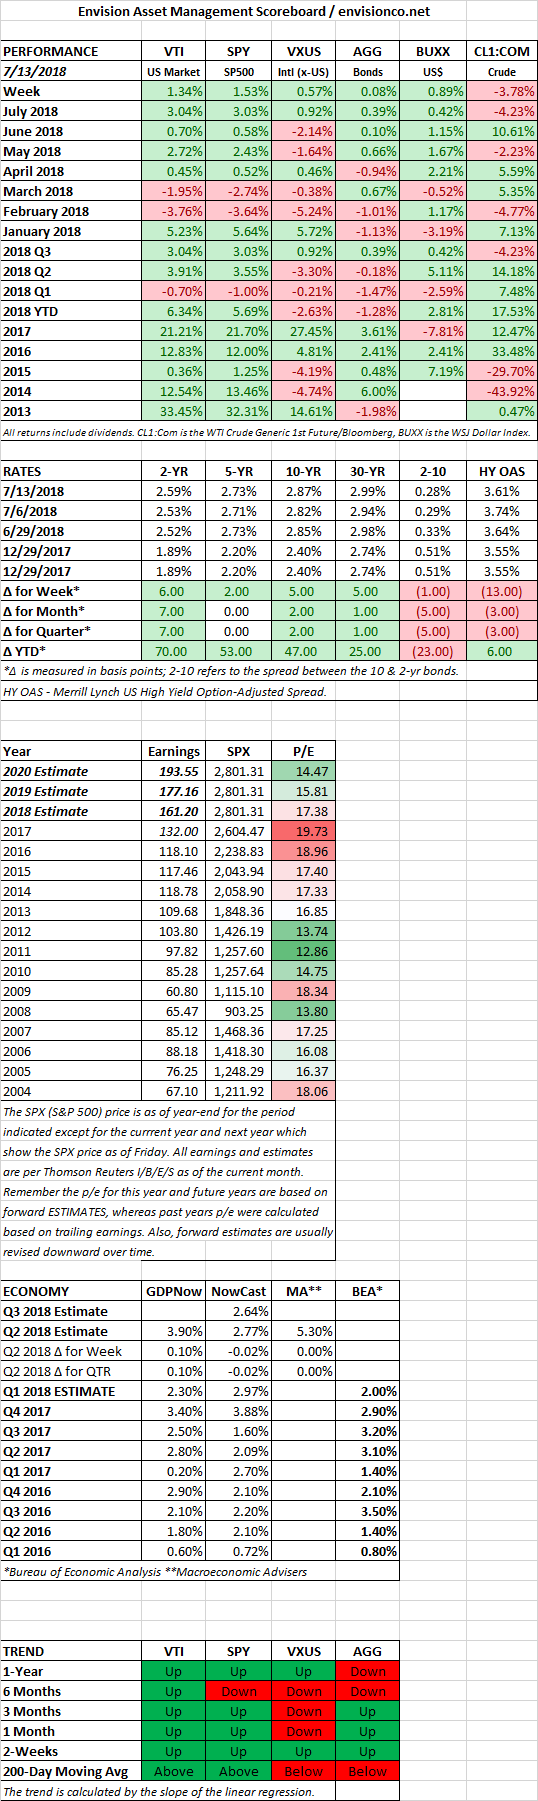
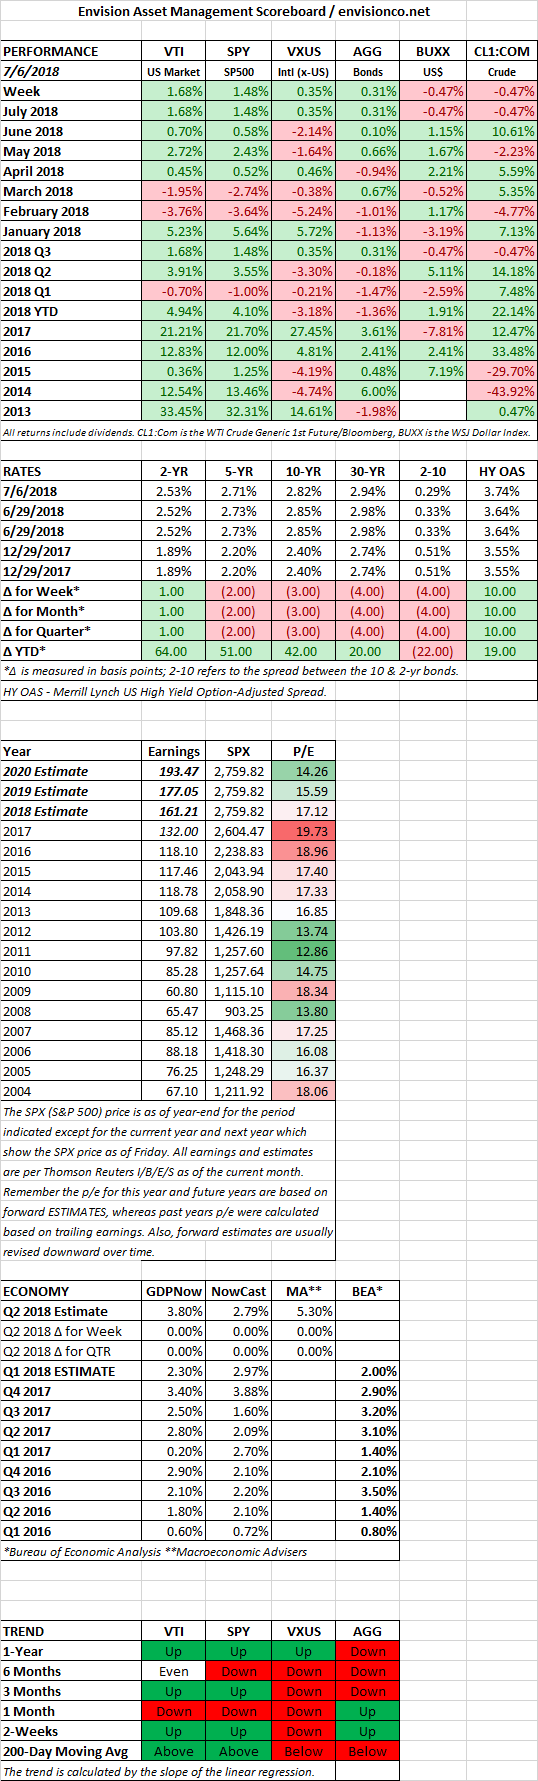
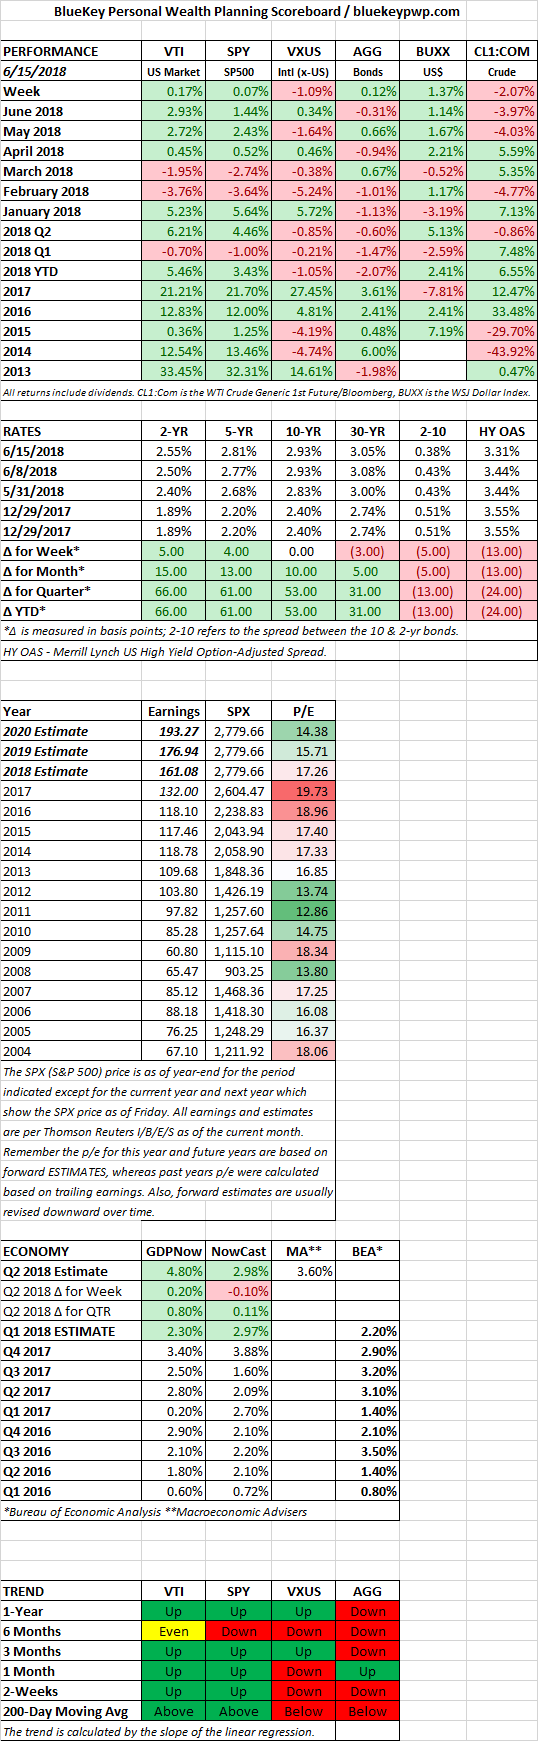
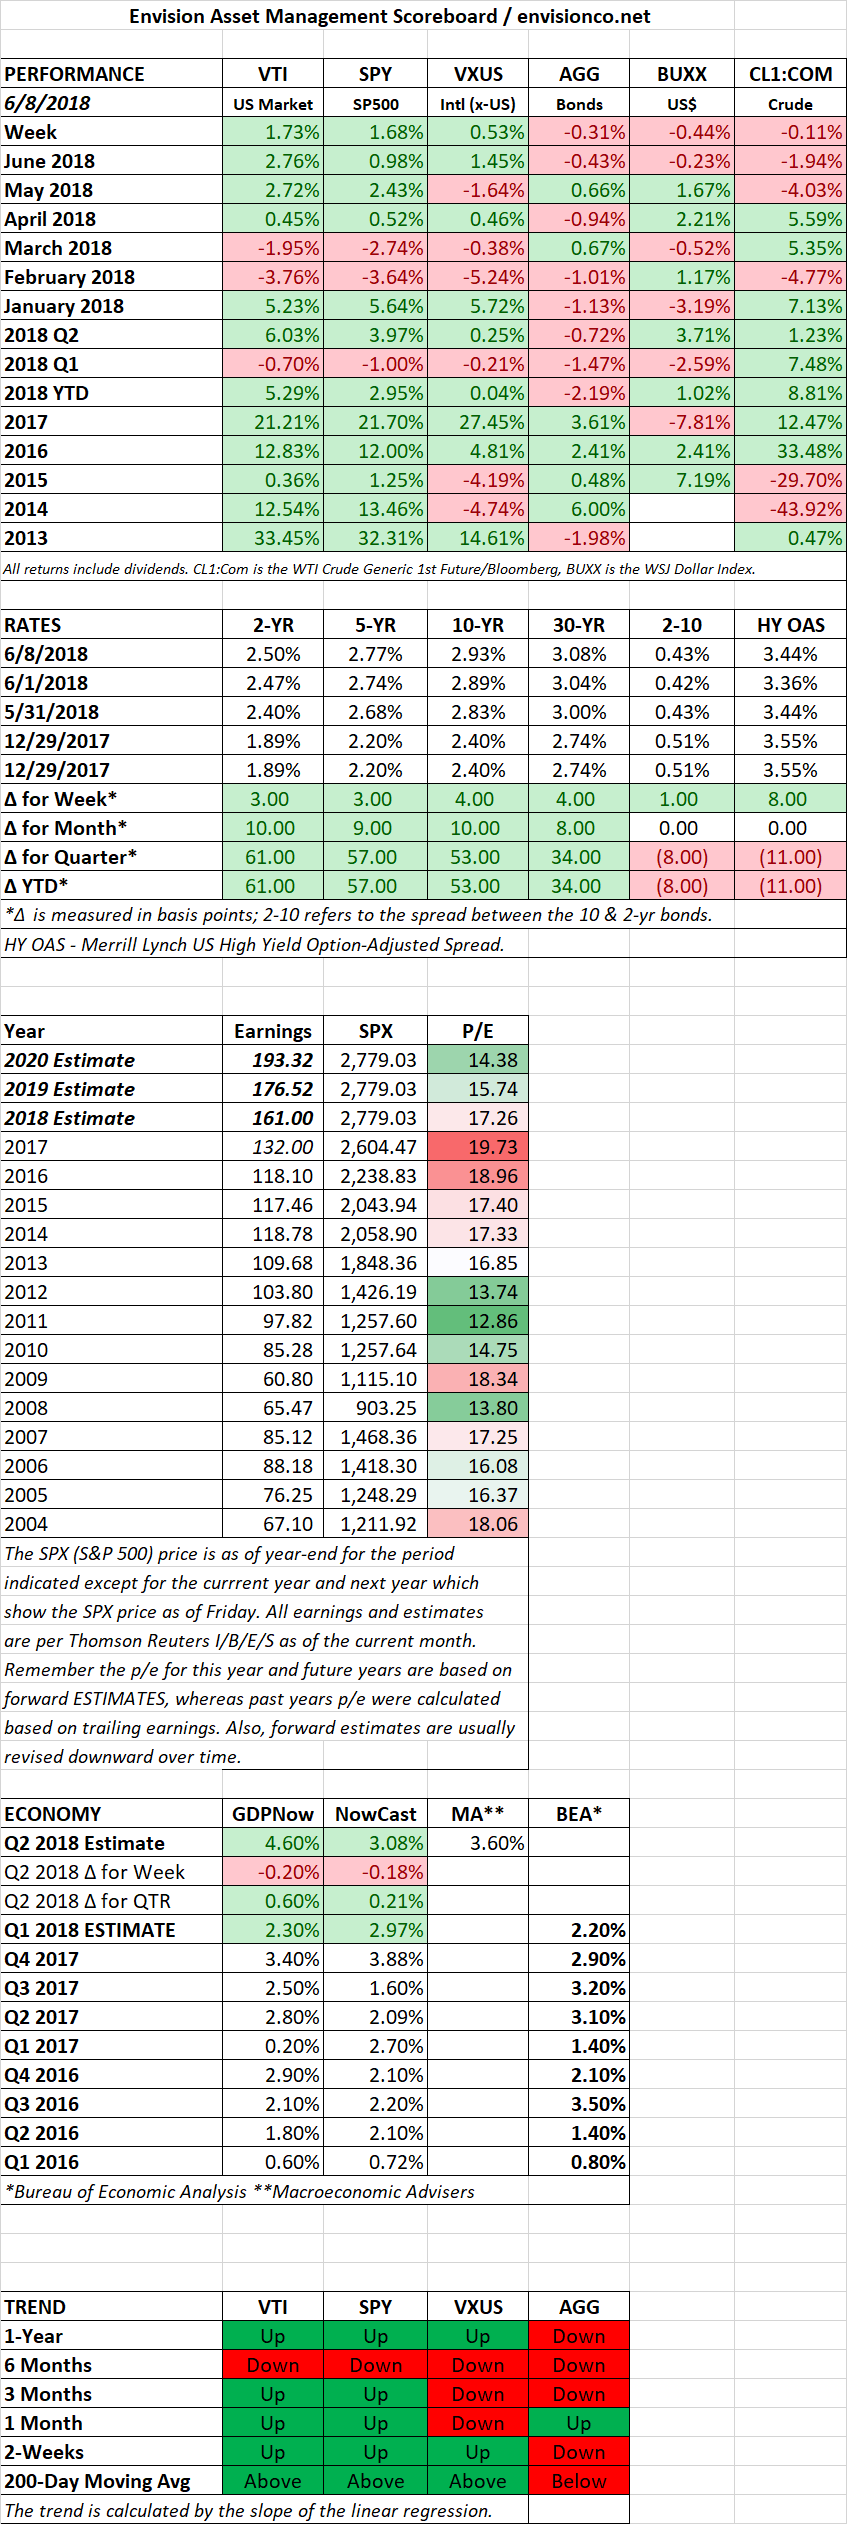
SCOREBOARD