Week Ending 3/6/2020

HIGHLIGHTS

  • Stocks finish flat for the week but explosive volatility in between.
  • Economic numbers, highlighted by a strong jobs report, indicate the economy was accelerating economy before the impact of the virus.
  • Interest rates continue to plunge.
  • The yield on the S&P 500 now exceeds the 10-year yield by the most since 2008.
  • Joe Biden is now the favorite to capture the nomination for the Democrats.
  • The coronavirus continues to spread but while absolute numbers are small the economic impact will be big.

MARKET RECAP

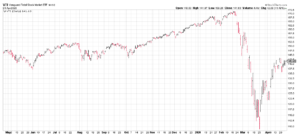
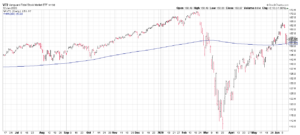
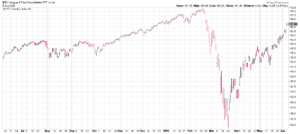
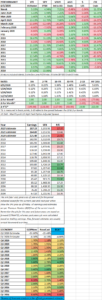
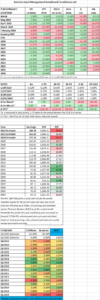
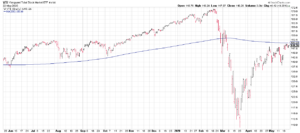
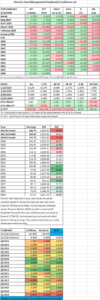
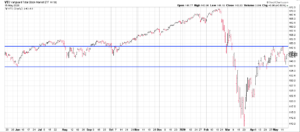
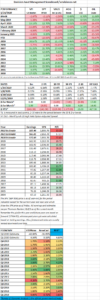
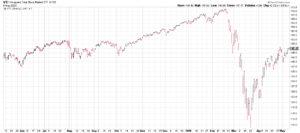
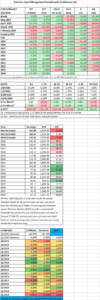
US stocks advanced for the week by the thinnest of margins, +0.1%, but it didn’t feel that way as stocks were way up or down every day. International stocks fell by 1.19%. Here is how it broke down day by day in the US:

The momentum from the late market rally from the prior Friday continued on Monday with the 4.14% advance. But that was reversed on Tuesday as the market fell late as the Fed was holding its news conference announcing a 1/2 percent interest rate cut. News of Joe Biden’s Super Tuesday performance helped the market rally by 4% on Wednesday. Then coronavirus fears dropped the market on Thursday. Friday was more of the same but stocks rallied 2.36% off of their lows late in the day to close down by 1.86%. Add it all up and stocks were pretty much flat for the week.

The wild ups and downs reflect the fact that no one knows how bad the virus will be and what will be the ultimate impact on the economy. Economic numbers that were reported this week were good, and show a US economy that is improving. The Atlanta Fed’s GDPNow model raised the Q1 estimate of growth to 3.1% from 2.7%. It was a blockbuster jobs report as nonfarm payrolls increased by 273,000 (the estimate was 175,000) and the unemployment rate dropped to 2.5%. December and January’s numbers were revised up by 243,000. But most of the survey was done before the coronavirus accelerated in the last couple of weeks. No one expects anything close to that for the next few months.

INTEREST RATES FALL HARD

The Fed on Tuesday cut interest rates by one-half point to a range of between 1% and 1.25%. It was the first time since 2008 that the Fed cut rates in between scheduled policy meetings. The market immediately sold-off on the news, probably realizing a rate cut would have minimal impact on the supply-side shock to the economy. Meanwhile, interest rates plunged. The 3-month treasury bill now yields 0.45%, which is down from 1.27% last week and 1.55% at the end of last year. The two and ten-year yield fell by about 37 and 39 basis points for the week. The 10-year yields an all-time low of 0.74% and the 30-year is at 1.66%. High-yield bonds are now at 5.05%, up from 4.62% last week. The falling interest rates indicate fixed income investors expect some bad times ahead.

ADVANTAGE TO STOCKS BASED ON YIELD

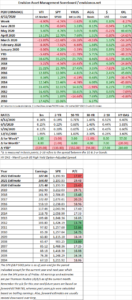
The differential between the yield on the S&P 500 and the 10-year treasury are now at the highest levels since 2008. That doesn’t mean the bottom is in but stocks are attractive based on this valuation measure.

BIDEN IS THE ODDS ON FAVORITE

Biden’s surprise surge on Tuesday has vaulted him to be the front-runner for the Democrats according to fivethirtyeight.com. Along with the Tuesday performance, all of the remaining candidates have dropped out, giving Biden has an 89% chance of winning the Democratic nomination.

VIRUS

The coronavirus continues to spread but while absolute numbers are still small. the economic impact will be big. According to Johns Hopkins, there have been 107,000 confirmed cases as of Sunday morning and about 3,600 people have died. In the US, there are 440 cases over 32 states. The fear factor and efforts to minimize the spread of the virus are beginning to have a real economic impact. Cases in the US will probably skyrocket over the coming days just because testing will be going up dramatically.

SCOREBOARD

Week Ending 2/28/2020

HIGHLIGHTS

  • Stocks drop into correction territory in record time falling 11.45%.
  • The biggest point drop in the history of the Dow on Thursday, falling 1,190 points.
  • Interest rates plunge, the 10 and 30-year Treasury yields are at all-time lows.
  • A look back at the Spanish Flu, the Asian Flu, the Hong Kong Flu, and SARS.
  • The dividend yield on the S&P 500 exceeds the 30-year Treasury yield by the most since March of 2009.

MARKET RECAP

Reality finally caught up to the stock market this week as US equities fell by a stunning 11.45%. It was the fastest decline into correction territory (a 10% drop from the high) ever and the worst week since the financial crisis. Despite news going into last weekend that the growth of the coronavirus (Covid-19) was possibly getting under control in China, outbreaks in Italy, South Korea, and Iran woke investors up to the fact that maybe there is a problem here or even a big problem. Micheal Ryan, the WHO’s chief of health emergencies, outlined three possible scenarios: (1) the virus can be contained, (2) the virus develops a regular pattern of continual or seasonal transmission, or (3) it becomes a pandemic. Goldman Sachs said that earnings would be flat this year, indicating two straight years of no earnings growth.

Stocks fell 3.3% on Monday, 3.1% on Tuesday, 0.6% on Wednesday, 4.4% on Thursday, and 0.7% on Friday.

On Thursday, the Dow fell by 1,190.05 points, the biggest one-day point drop in history (not percentage drop) as panic over the Covid-19 spread, putting the market into correction territory.

Stocks weren’t the only financial instrument to fall, interest rates also plunged. The yield on the 10-year Treasury dropped to 1.16% on Friday, an all-time low and 11 basis points less than the July 2016 low. The 30-year bond fell to 1.67%, another all-time low.

Where the economy goes from here is really a guess at this point. Ultimately it depends on how the virus plays out and how much of the economy might shut down, both in the US and around the world. Economic growth was starting to pick up around the world, but the virus may be enough to put recession fears back on the front burner. It is impossible to know how Covid-19 plays out, but this would not be the first virus to put a scare into equity markets.

SPANISH FLU OF 1918

The Spanish flu was a severe pandemic from 1918-1919 that infected about 1/3 of the world’s population. About 50 million people died worldwide and 675,000 in the US. This flu had a case-fatality ratio of greater than 2% making it a category 5 on the CDC Pandemic Severity Index (the worst possible level). Obviously, communication, medicine, and technology were not then what they are now, so the timing of the virus is not that precise, and the effectiveness of treatments was nowhere near what they would be today. The virus started in the spring of 1918. Using a 4/30/1918 start date, the market advanced by 20% over the next 12-months. However, it should be noted that there was a 40% decline prior to the virus from November of 1916 until December of 1917. Also, the Spanish Flu occurred towards the end of World War I so there were lots of other factors to consider which might have had a greater impact on the market.

ASIAN FLU OF 1957

The Asian Flu was a category 2 flu pandemic that started in China at the beginning of 1956 and ran until 1958. It reached the US in June of 1957 and killed 70,000. This flu occurred in two waves, and the second wave, which began in November was more severe. Worldwide estimates of fatalities range from 1 to 4 million. From the end of June until the market low at the end of October, stocks declined by 14%. However, the Fed had tightened monetary policy in the two years prior which led to a recession, there were also worries that the US was losing the cold war to Russia after the Soviets launched Sputnik, the first satellite to orbit the earth.

HONG KONG FLU OF 1968

The Hong Kong flu began in July of 1968 and hit the US in September of that year. This flu was highly contagious and it spread rapidly. By December it had spread throughout the US. The virus peaked between December of 1968 and January of 1969. The flu killed one million people worldwide and 34,000 in the United States. The case-fatality ratio was below 0.5%, making it a category 2 disease on the Pandemic Severity Index.  From September through November, stocks were up by 9.6%, but the market would then slide by 17.4% from December until July. The market went sideways through the end of the year and would then full much further in 1970. However, in previous research I have done about this time period, the flu is not even mentioned, and the market decline started as the flu was peaking. That was an era of high flying stocks, an IPO craze, Nixon, the Fed got tight on money, inflation was accelerating, there were riots and crime so factors were the probable causes of the decline.

SARS VIRUS OF 2003

The SARS virus was limited in scope but deadly, spreading to 8,000 people and killing 800, mainly in Asia. The virus ran from late 2002 until July of 2003. From the January peak until the March low, stocks fell by 14% over a two-month period while the 10-year yielded about 3.5%.

WHERE WE GO FROM HERE

In the four examples above, three were associated with sell-offs of between 14% and 18%. Although it is not clear the flu was even the main cause of these sell-offs. As of now, stocks are off by 12.6%. If the flu plays out to become a major economic event and pushes the economy into a recession, the sell-off could get a lot worse over time. But if it turns out to be a minor blip in the backdrop of a slowly improving worldwide economy, this could represent a buying opportunity. The likely scenario is somewhere in between, but until the picture becomes clearer the uncertainty of where the market goes is much higher than normal. And this does not even factor in that the lead Democrat in the primary race is Bernie Sanders.

One thing for sure, the sell-off in stocks and fall in bond yields, while not erasing the high p/e ratio of US equities, has made stocks look attractive to bonds at this time. According to David Wilson from Bloomberg, as of Thursday, the dividend yield on the S&P 500 now exceeds the yield on the 30-year Treasury bond by 24 basis points, the most since March of 2009.

In a world where the 10-year treasury yields 1.13% and the 30-year yields 1.65%, here are some examples of stocks with a financial strength rating of A++ by Value Line and big dividend yields:

To be clear, we are not recommending these stocks, but pointing them out as examples of some of the opportunities now available after this week’s damage. Of course, if the virus really damages economic activity, they may not be such good deals right now and would turn into better opportunities later.

SCOREBOARD

Week Ending 2/21/2020

HIGHLIGHTS

  • Stocks fall for the week.
  • Treasury yields continue to fall, 30-year is at an all-time low.
  • Good economic news.
  • Gold is racing higher.
  • Apple warns due to coronavirus.
  • Japan faces risk of recession.
  • Bernie marches on.

MARKET RECAP

Stocks fell for the week by 1.05% in the US and 1.48% x-US. Bonds rallied by 0.53% as treasury yields continue to fall. The 30-year Treasury yield closed the week at 1.90%, an all-time low. The 10-year yield closed at 1.46%, the lowest level since 2016. The 3-month, at 1.56%, yields more than the 10-year indicating an inverted yield curve, a signal for a possible recession.

ECONOMIC NEWS

But economic news was for the most part positive. Housing starts and building permits were strong, beating expectations by more than 100,000. Regional Fed reports from New York and Philadelphia were also strong. The Atlanta Fed’s GDPNow model increased estimated Q1 growth from 2.40% to 2.60% and the NY Fed’s Nowcast was increased from 1.39% to 2.01%.

GOLD

But gold is racing higher and is now at its highest point since February of 2013. Indicating worries about economic growth and exploding deficits around the world.

APPLE/CORONAVIRUS

Apple announced on Monday that it won’t hit its projected revenue targets for the current quarter due to the impact of the coronavirus. Apple did not quantify the impact of the virus, saying it was too early. But Apple will be the first of many to announce lower earnings and sales as a result of the virus. There is hope that the spread of the virus is starting to slow, the trend is now lower on both a linear and exponential basis, indicating, that if reports are accurate, the virus might be getting under control.

JAPAN

Japan faces the risk of a recession. The country took an initial hit in the last quarter as the economy contracted at a 6.3% annualized rate due to a 10% rise in the national sales tax on October 1. Now, the coronavirus is hurting tourism and manufacturing.

BERNIE

Bernie Sanders won the Nevada caucuses cementing his lead for the Democratic nomination. A poor performance by Mike Bloomberg at the debates this week dropped hopes of a moderate nominee. For now, and it is early, it looks like a Sanders-Trump matchup. The market is counting on a Trump victory but nobody knows what will happen. But Trump is cheering Bernie on (and trying to stir up some trouble), writing on Twitter, “Looks like Crazy Bernie is doing well in the Great State of Nevada…Congratulations Bernie, & don’t let them take it away from you!”

SCOREBOARD

Week Ending 2/14/2020

MARKET RECAP

Stocks finished higher,  +1.77%, and +0.82% outside the US. It was another record close for US stocks. This, despite the fact that the coronavirus continues to shut down a portion of the Chinese economy, Bernie Sanders is the current Democratic frontrunner, and equity valuations are on the high side. There seems to be a huge disconnect. Or maybe it makes sense, bonds yield almost nothing, the 30-year yield has been dropping and is now at 2.04%, not far from the all-time low of 1.94% from last August, central banks remain supportive, and many think the coronavirus is a one-quarter phenomenon. A big risk is if inflation remerges, which would change the calculus on all of the above.

BUDGET

Trump set out his long-term plan for the budget, aiming to cut budget deficits by half as a percentage of the economy by 2024 and then by another half by 2029. The budget does not forecast any recession during that time period and of course, is light on the details of the proposed spending cuts.

SCOREBOARD

Week Ending 2/7/2020

HIGHLIGHTS

  • Stocks are up by 3.2% in the US and 2.1% x-US.
  • Another strong jobs report.
  • Macy’s to lay off 2,000.
  • Tesla’s stock continues burning higher.
  • Solid ISM report.
  • The trade deficit falls slightly.
  • A disaster for the Iowa caucuses.

MARKET RECAP

Stocks had a big week advancing by 3.2% in the US and by 2.1% around the world. Bonds fell by 0.38%. Stocks were all but oblivious to the fact that a good portion of China has been paralyzed by the coronavirus. Markets were probably helped when China pumped billions of dollars into their economy to help offset the economic impact of the virus. Tesla’s stock has been on a parabolic rampage (see below).

JOBS

The job market continues to be the strong point in the US economy. The US added 225,000 jobs last month, the unemployment rate ticked up to 3.6% from 3.5% due to an influx of new workers, and wages climbed by 3.1% compared to last year. Some of the job gains were attributed to mild weather in January. The three-month average of 211,000 is now trending above the 12-month average of 175,000.

But while jobs across the entire US economy are strong, brick and mortar retailers continue to be hammered, especially department stores. Macy’s announced that it will close 15 stores over the next three years and eliminate about 2,000 jobs.

TESLA

In a move reminiscent of bitcoin or some of the internet highflyers from 1999/2000, TSLA was up by 447% from its June 3rd intraday low to its intraday high on Tuesday (2/4/2020). The stock closed the week down 22.7% from that point. The Company, which has been a favorite of the bears, has turned around investor sentiment from possible bankruptcy, too, according to famed investor Ron Baron, a possible $1 trillion in revenues within 10-years. Currently, Tesla has a free cash flow yield of 0.8%, and at its current market cap, Tesla is selling for $367,000 for each car delivered in 2019, while GM is valued at $6,400 per car, and BMW is at $17,000 per car.

ISM

The Institute for Supply Management’s manufacturing index came in at 50.90, back in expansionary territory for the first time since July and up from 47.8 in December. The survey was mostly conducted before the coronavirus outbreak. “The outbreak of the novel coronavirus in China is likely to significantly disrupt activity in 1Q20. The inevitable disruptions to China, as well as potential spillovers to the rest of the world, should become visible starting with the February report,” according to J.P. Morgan economists Joseph Lupton and Olya Borichevska.

TRADE DEFICIT

The US trade deficit fell for the first time since 2013 to $617 billion from $628 billion last year. Exports fell for the first time since 2016, but imports fell even more, obviously due to tariffs. China dropped to third place as the biggest US trade partner, behind Canada and Mexico. A smaller deficit is likely a sign of weaker demand and slower worldwide growth.

IOWA

The primary season officially got underway with the Iowa caucuses on Monday. Unfortunately, it pretty much turned into a disaster due to software problems. Results still are not complete yet, but so far Pete Buttigieg and Bernie Sanders are about tied with each getting about 26% of the delegates.

SCOREBOARD

Week Ending 1/31/2020

HIGHLIGHTS

  • US stocks drop by 2.2% and international stocks were off by 3.38%.
  • Bonds advanced by 0.76%.
  • Fears of the coronavirus set stocks back.
  • Q4 growth was 2.1%, 2.3% for the year.

MARKET RECAP

US equities fell by 2.2% on the week on fears of the spread of, and economic impact from, the coronavirus. Since the virus broke out on January 17th, stocks are off by 3.11%. The timing is about in line with the market peak in January of 2018, stocks were on a daily climb similar to what we have seen this year, almost every day until January 26, when trade war talk triggered a quick 10% drop. Time will tell whether we get a similar follow-through this time around.

International stocks took a bigger hit, down by 3.38%. Investors fled into treasuries, advancing bonds by 0.76%. The 3-month/10-year yield curve inverted, as the yield on the 10-year Treasury bond dropped by 19 basis points to 1.51%.

CORONAVIRUS

There are now six cases of coronavirus confirmed in the US, and about 10,000 around the world, and there have been 200 fatalities. The economic impact is being felt in China. Hong Kong suspended high-speed rail to China, and reduced airline flights. The Shanghai Disneyland has closed and Starbucks has temporarily closed about 1/2 of their stores. Airlines have canceled many flights to and from. Millions of Chinese are in lockdown. Chinese stocks are down by about 11% since the outbreak. Sectors that have been hit by the virus (in terms of equity prices) are airlines, tourism, and oil and gas.

Believe it or not, the name though has created some confusion, as some actually think the virus and the Corona beer are connected. Search engines have been flooded with inquiries about the “beer virus” or the “corona beer virus”.

Q4 GROWTH

The Bureau of Economic Analysis reported that Q4 GDP grew by 2.1%, in line with Q3. For the year, GDP was up by 2.3%. Personal consumption, which comprises 2/3 of economic activity, rose by 1.8%, the slowest rate in three quarters.

EARNINGS

At the halfway mark of earnings season, 2/3 of S&P 500 companies that have reported have beat their estimates. Solid reports from market leaders Apple, Tesla, and Amazon have helped. Earnings for the quarter are now expected to be down 0.3% from last year, versus the original -1% estimate. The 2020 estimate looks for a 9% gain. Of course, that will come down with time.

BREXIT

It has been 1,316 days since British voters decided to leave the EU, and here it is. The UK has now officially left the European Union. There is now an 11-month transition period where the two parties will try to reach some sort of deal.

SCOREBOARD

Week Ending 1/17/2020

MARKET RECAP

US stocks were up by 2% and international stocks advanced by 1.40%, bonds were mostly flat. The US and China signed the phase-one trade deal. China will spend $200 billion to help close the trade imbalance, China will avoid currency manipulation and will do more to minimize theft of American technology. The agreement does not address the Chinese state-backed hacking of US companies and government institutions, it does not address state subsidies of Chinese companies. The US says those issues will be addressed in subsequent agreements.

The US will maintain tariffs on the majority of imports from China until further reforms are agreed to. Ultimately, “this deal will work if China wants it to work,” according to US Trade Representative Robert Lighthizer.

In the meantime, the deal lowers trade tensions and hopefully will lead to further successful negotiations between the two countries.

SCOREBOARD

Week Ending 1/10/2020

HIGHLIGHT

  • Stocks advance as the Iranian conflict fades.
  • Valuation measures are tilting towards the expensive side.
  • A decent jobs report.

MARKET RECAP

Iran retaliated for the killing of Iranian general Qassem Soleimani by firing several missiles that resulted in no deaths, and some minor property damage. The market viewed that as a plus, as it appeared that Iran was “standing down”, in the President’s words, and there would be no further escalation, at least for now. That bit of good news was enough ammunition to move the markets up by 0.7% for the week.

We have written in recent weeks that valuation measures have been getting expensive. That was brought up several times this week in the media and is discussed in today’s Barron’s. The chart below from Charles Schwab shows that by most measures, stocks are expensive.

However, there are a couple of measures in the bulls’ corner. The Rule of 20 states that if the sum of the p/e ratio and inflation is equal to 20, stocks are fairly valued. Less than 20 is undervalued and greater than 20 is overvalued. With a forward p/e of about 19 and inflation at about 2%, the market would be about at fair value. When looking at the earnings yield (earnings/price) of 5.29%, less the yield on the 10-year treasury of 1.83%, the difference of 3.46 indicates an undervalued market.

So of the six valuation measures shown, three are very expensive, one is expensive, one is fairly valued and one is inexpensive. We lean to the expensive side. But given the technical strength of the market both in the US and overseas, the rally can certainly continue.

JOBS

The Bureau of Labor Statistics reports that 145,000 jobs were created in December, less than the projection of 160,000. The two previous months were revised down by 14,000.  While less than consensus and less than last month, employment increases of around 150,000 or so indicate solid growth. The disappointing number was wage growth, which was up by only 1%. That was the lowest number since Q4 of 2017 and among the weakest in the last five years. However, net-net, this is still a decent report.

SCOREBOARD

Week Ending 1/3/2020

HIGHLIGHTS

  • Stocks close out 2019 with a 30.67% gain in the US and 21.75% outside the US.
  • A small fall for the week after news that a US drone takes out an Iranian general.
  • US and China to sign the phase-one trade deal on January 15.
  • The ISM manufacturing index falls for the fifth month in a row.
  • The Fed’s increase in assets since late August has coincided with a 13% market advance.
  • Shiller warns about the CAPE ratio.

MARKET RECAP

Stocks closed out 2019 with a 30.67% gain in the US and 21.75% outside the US. Bonds were up 8.46%. It was an amazing year.

For the week overall, stocks lost a little bit of ground, down 0.09% in the US and 0.50% x-US. The market got off to a good start on Thursday, the first trading day of the year, setting a new high and up 0.83%. But on Friday stocks closed down by 0.64%, on news that a US drone killed a top Iranian general, Qassem Soleimani. It was reported that Soleimani was planning further attacks on US forces.

In other news, the US and China are set to sign the phase-one trade deal on January 15th and to begin talks on phase-two shortly thereafter. The ISM manufacturing index fell to 47.2 in December from 48.1 in November. It was the fifth consecutive decline.

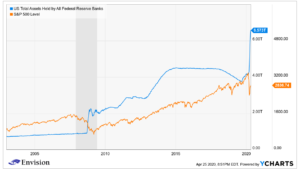
The Fed has increased its assets by $410 billion since late August. That is about when the market went on its run to close out the year, the S&P500 was up by 12.75% during that period.

There seems to be a lot of complacency in the market, there is almost no fear. The CNN Fear & Greed Index was up to 97 out of a possible 100 on Thursday but closed at 93 on Friday, still in the Extreme Greed category, but valuations, at least by one measure, are very high.

Robert Shiller, Nobel Prize winner and developer of the Cyclically Adjusted Price Earnings (CAPE) ratio wrote in the New York Times on Thursday, that the CAPE ratio currently stands at 31, just short of the recent high in January of 2018. Only two times in history has the ratio been higher, 1929, just before an 85% crash, and in 1999, before a 50% drop. Shiller attributes today’s high values to a “trust your gut” kind of mentality, versus an evaluation based on science and math. Shiller writes, “We have a stock market today that is less sensible and orderly than usual, because of the disconnect between dreams and expertise.”

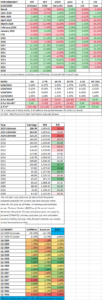
SCOREBOARD