
Weekly/Monthly/Quarterly Recap
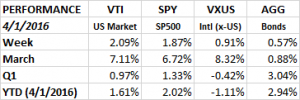
The week ended on a high note as the market continued to resist the chance to turn negative. The SP500 (SPY) opened down on Friday 0.57% but then went straight up for the rest of the day closing up 0.69% on the day and at the high for the year at 206.92. For the week, all the broad ETFs were up, the overall US market (VTI), +2.09%, the SP500 (SPY), +1.87%, international x-US (VXUS), +0.91% and the aggregate bond index (AGG), +0.57% (all of our calculations include dividends).
March ended on Thursday and what a month it was. The market put the finishing touches on a monumental comeback as the US market climbed 7.11%, the SP500 was up 6.72%, international x-US +8.32% and the bonds were up 0.88%.
If you were an investor that only looked at your quarterly statement, you would find that the US markets had a moderate increase as the overall US market was up 0.97% and the SP500 was up 1.33% for the three-month period. International markets (x-US) dropped 0.42%. You probably would assume it was a calm, steady, increase. You would be wrong! The market took investors on a wild ride but ended up in about the same place as where it started. It was almost straight down and then straight up. The market got off to its worst start ever for the first two weeks of the year. From December 31 through the closing low on February 11, the SPY was down 10.31% and had hit a 22-month low. From that point it rallied 12.97% through the quarter ending close on Thursday, overall up 1.33% for the quarter.
The quick summary for the quarter was that the market fell on fears of a possible US recession but then as economic reports began to make clear that the threat of a near-term recession was minimal the stage was set for the recovery rally.
Fixed income outpaced equities. The AGG advanced each month and combined for a 3.03% gain for the quarter. Treasury bonds were up 8.15%. US fixed income is being helped by more quantitative easing in Europe and by negative interest rates in Japan which have pushed overseas rates lower increasing demand for US treasuries.
Gold was the top performing asset class, up 16.5% for the quarter. Commodities turned positive this quarter, up 3.78%. Emerging markets were up 2.73%. The dollar was down by 4.15%.
MANUFACTURING
The Institute of Supply Management (ISM) showed an increase in manufacturing activity for March. This was the first increase in six months. The index came in a 51.8, up from 49.5 in February. A number above 50 indicates growth. Since declining to slow manufacturing activity earlier in the year led to the fears of a recession, a higher number is a big positive.
PAYROLL
Nonfarm payroll in March increased by 215,000 jobs. For the quarter, the average gain was 209,000. That was up by 19,000 jobs compared to the average during the first three months of 2015. Year over year average hourly earnings were up 2.3%. The unemployment rate ticked up to 5.0% from 4.9%, as more people entered the labor force. Initial claims for unemployment rose to 276,000, the highest number in eight weeks but still a relatively low number.
VOLATILITY
As a follow up to our note last week on the volatility ETFs, we wrote that the huge increase in bets on funds like UVXY and TVIX might signal that the market might not act in a way these traders want. That turned out to be correct as the UVXY fell 22% and TVIX fell 19.6% on the week.