
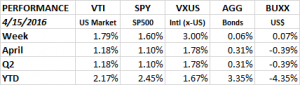
The market bounced off its lows from last week and the overall US market (VTI) moved ahead by 1.79%, the SP500 (SPY) +1.60% and overseas x-US (VXUS) +3.00%. The bond index and was roughly flat at +0.06%.
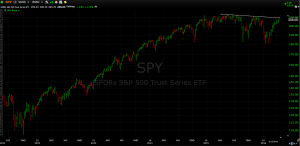
The equity markets continue showing strong resilience. The market has closed at or near the low at least 8 times since February 11th but there has not been any follow through. The SPY is now close to testing and possibly breaking through the downtrend line set from the highs last May.
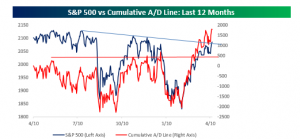
A good internal signal is that the cumulative advance/decline line is showing even more strength than the market.
OIL
The market might be tested on Monday. Over the weekend OPEC held a meeting to decide on a production freeze but they could not reach an agreement. Remember on February 11 it was talk of a possible production freeze that set the low for oil which helped sparked the market rally.
CHINA
The market was helped by news from China. Q1 GDP came in at +6.7%. Recent PMI numbers have also shown a positive pattern. The general feeling is that the economic storm in China has settled down at least for now.
US ECONOMY
It was a mixed week for US economic data. Retail sales fell 0.3%, industrial production fell 0.6% and the NFIP small business optimism report declined. Most of the retail sales weakness was due to autos. X-autos retail sales were up 0.2%. On the plus side, we got another very strong initial unemployment claims report, new claims totaled 253,000. This is the lowest level since 1973. Another positive was the Philly Fed report which increased for the third straight month. This has been the largest three month increase since October of 2009.
SUMMARY
The market continues to show strength, but has risen almost 14% since February 11, it is overdue for a pullback. Economic reports continue mixed, growth remains slow to flat.