HIGHLIGHTS
- Stocks are hit hard, fall over 4% on the week.
- Second 5% or more drop this year.
- Higher interest rates get some of the blame.
- So do trade tensions.
- The IMF drops global growth forecasts.
- Estimates of futures earnings growth have stalled.
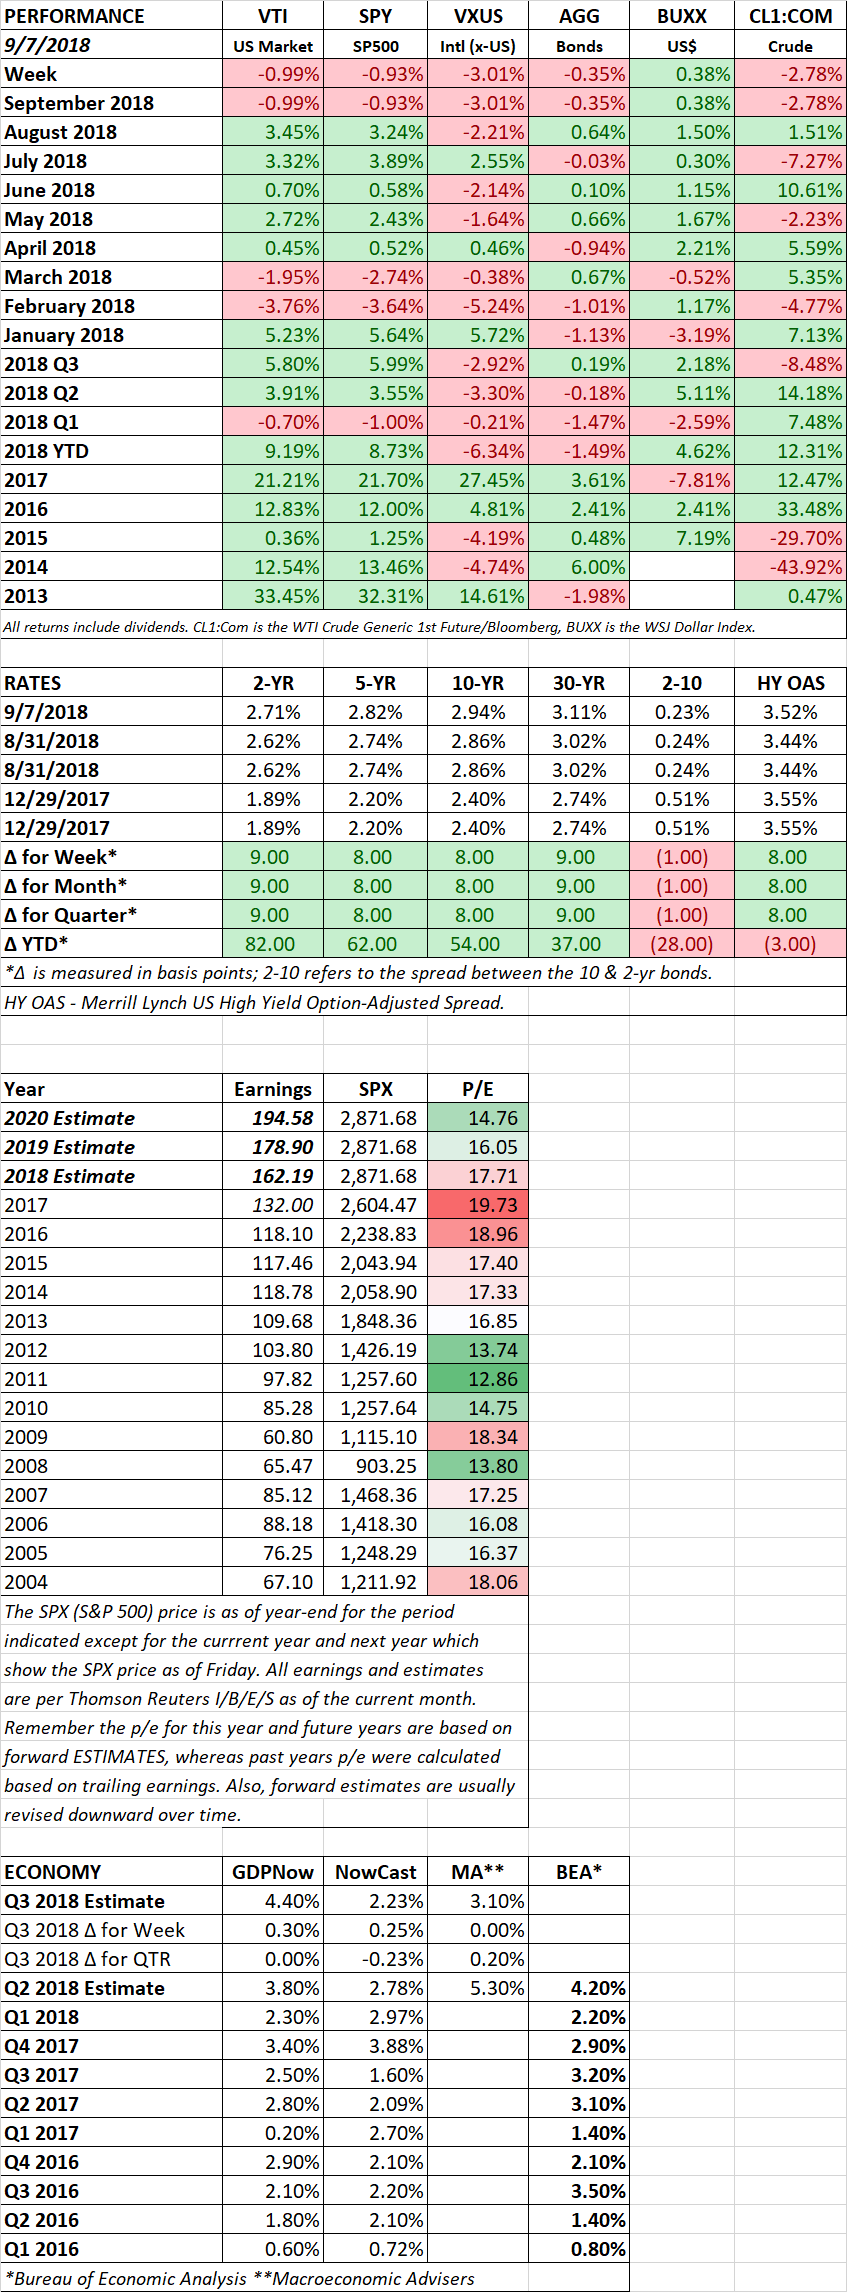
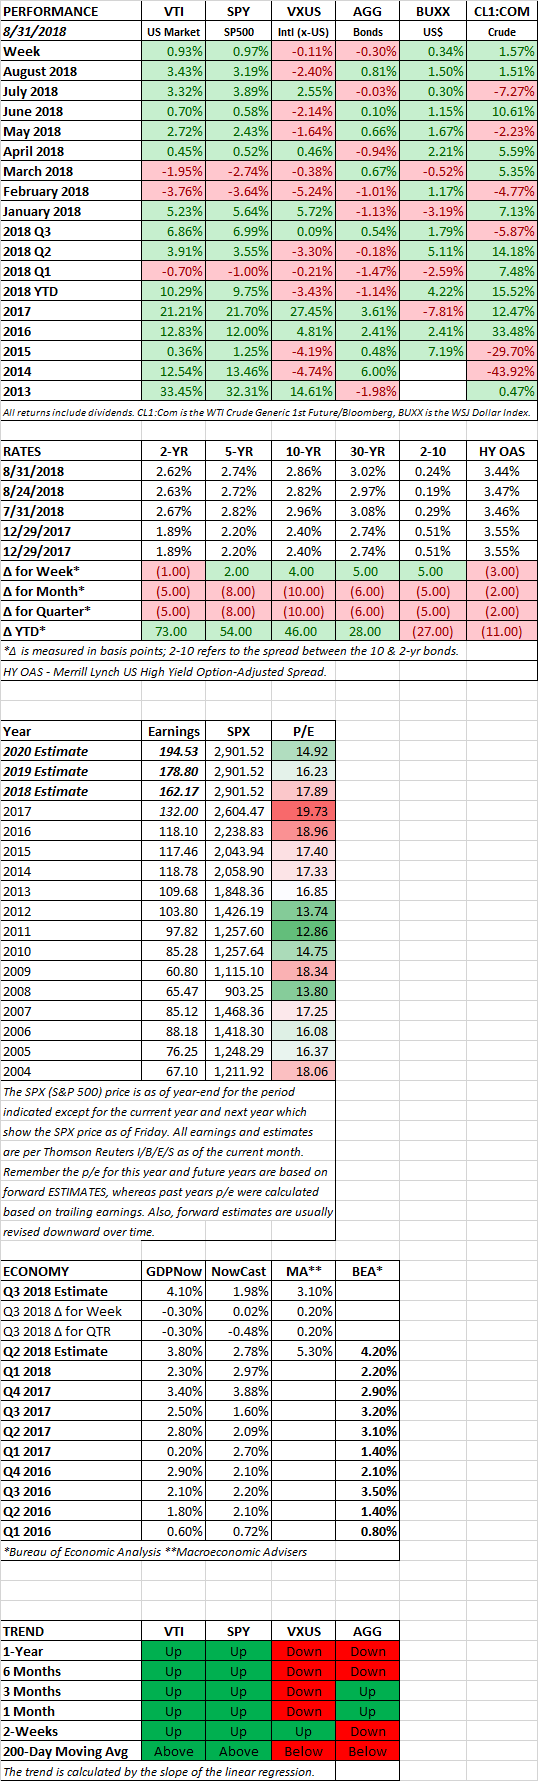
- The forward p/e is now at 15.7, less than the 25-year average of 16.1.
MARKET RECAP
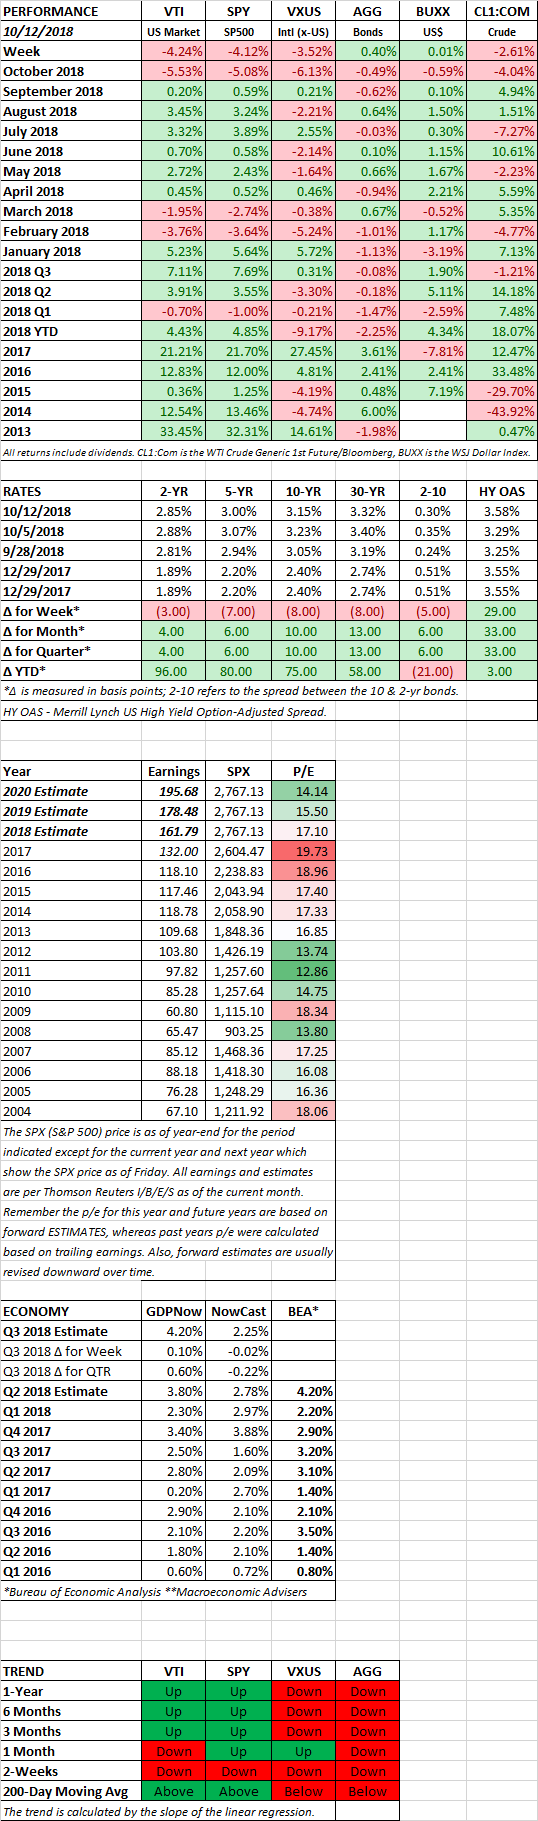
Stocks fell hard on Wednesday and Thursday, leading to a 4.24% decline in the US and 3.52% for international equities on the week. US stocks have now fallen 6% since the September 20 high. Small stocks, which hit their high on August 29, entered correction territory on Thursday, down 10.3%, before a small rally on Friday.
With the 6% drop, the S&P has now fallen by more than 5% off its peak for the second time this year. This has happened nine times in the last 12 years. So a drop of 5% or more at least two times during the year is nothing out of the ordinary. But that doesn’t matter it can’t get worse from here.
Higher interest rates took some of the blame for the drop in prices. President Trump was leading the bandwagon, saying that the Fed was “out of control” for raising interest rates. Trump also stated that “I think I know about it better than they do” in regards to monetary policy. So maybe Trump should double as Fed Chair also. We wrote back on July 22 that Trump was setting up Fed Chair “Powell to be the fall guy” in the event the economy was to slow down. But if higher interest rates were to blame, it was the long end of the curve that seemed to cause most of the concern. The Fed has more of an influence on the short end.
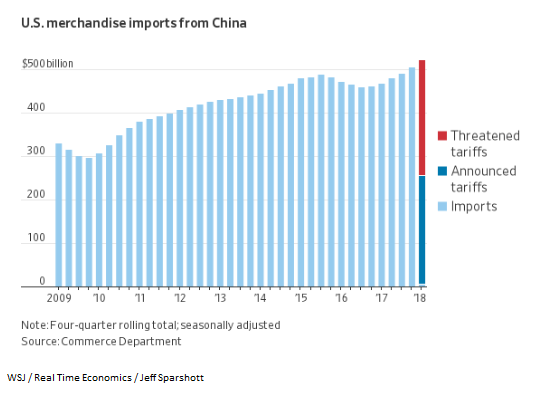
Trade tensions also share the blame. The US and China appear no closer to resolving their differences. Tariffs, which are set to rise further in a few months, are a tax paid for by Americans. Tariffs also mean higher prices, which means higher inflation, which means higher interest rates.
While the US economy continues to look strong, the global outlook has weakened. In a new report, the International Monetary Fund wrote that “downside risks to global growth have risen in the past six months and the potential for upside surprises has receded.” The IMF now projects global growth at 3.7% for 2018-2019, that is down from 3.9%. The IMF wrote that “In the United States, momentum is still strong as fiscal stimulus continues to increase, but the forecast for 2019 has been revised down due to recently announced trade measures.”
You can throw in earnings fears into the blame group. PPG, the maker of paints and coatings, revised their earnings outlook lower. The company said that rising costs for raw materials and oil, as well as lower demand from China, are impacting profits. The stock fell 10% on the news. Overall earnings estimates for the S&P 500 for 2018 reached their peak on September 14 at $162.25 according to Thomson Reuters, and have since fallen slightly to $161.79. 2019 estimates have also fallen, again, just slightly, by 0.23%, since September 7. But previous to September, estimates had been on a slow climb higher for several months. So the subtle change in earnings estimates might be hurting the market.
One positive signal is that as stocks have fallen, at least one valuation metric is now on the undervalued side. The forward p/e ratio for the SP500 is now at 15.7, versus a 16.1 long-term average. However, higher interest rates and further inflation could push future earnings estimates down.
SCOREBOARD