Week Ending 3/28/2024

MARKET RECAP

  • SPX +0.39%
  • The SPX was up 10.2% for the quarter and managed 22 record closes along the way. It was the best performance for the first quarter since 2019. The market has been up more than 8% in Q1 16 times since 1950, the average gain for the rest of the year in those instances was 9.7% according to Dow Jones Market Data. Only one time did the market drop, and that was in 1987.
  • The Personal Consumption Expenditures Price Index, excluding food and energy, was up 2.8% year over year and 0.3% for the month, matching estimates. Core PCE was up 2.5% and 0.3% compared to estimates of 2.5% and 0.4%.
  • Consumer spending was up 0.8% for the month, beating the 0.5% estimate.
  • The VIX closed at the ridiculously low level of 13.01, indicating no fear out in the equity market.

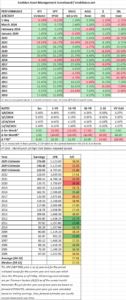
SCOREBOARD

Week Ending 3/22/2024

MARKET RECAP

  • US stocks +2.25%, international +0.76^%, bonds +0.74%, bitcoin -8.2%.
  • Powell said the Fed is still on pace for three rate cuts this year. This is despite higher-than-expected inflation numbers in each of the last two months. It’s like he wants to make a point that three cuts are coming, no matter what. I don’t get the rush.
  • Of course, markets rallied on the news.
  • The 2-year and 10-year treasury yields have now been inverted for about 430 days, the longest streak ever, and still no recession. Everyone was certain the inversion would lead to a recession, but not yet.

SCOREBOARD

Week Ending 3/15/2024

MARKET RECAP

  • US stocks -0.28%, international -0.41%, bonds -1.19%, crude +3.57%.
  • CPI was up 3.8%, higher than expected.
  • PPI was up 0.6% in February versus the economists’ estimate of 0.3%.
  • CPI and PPI have been moving in the wrong direction but the market is acting like everything is just fine and that interest rates will fall later in the year. Economists are generally abandoning their recession calls. Jamie Dimon said the world is pricing in a 70-80% chance of a soft landing. He gives the soft landing 50% odds and 50% for stagflation.
  • Retail sales were up 0.3% versus an expectation of 0.4%.
  • Bond yields increase; the 2-year is up by 24 basis points to 4.72%, and the 10-year increased by 22 basis points to 4.31%.’
  • The S&P 500 has not fallen by more than 2% since October, which is the longest streak in six years.
  • According to S&P Global Ratings, companies worldwide are defaulting on their debt at the fastest rate since 2009.
  • The Intelligence Advisors Sentiment Report showed bullishness (of market newsletters) measured at 60.9%. The last time the measurement was greater than 60% was in April and July of 2021.

SCOREBOARD

Week Ending 3/8/2024

MARKET RECAP

  • US stocks -0.18%, international +1.28%, bonds +0.76%.
  • Nonfarm payrolls increased by 275,000, beating the estimate of 198,000. But January hiring was revised downward by 124,000.  The unemployment rate increased to 3.9%. Average hourly earnings were 0.1% higher compared to January. much lower than the 0.5% increase in January.
  • Through March 1, the SPX has been up 16 out of 18 weeks, the first time that has happened in 53 years, according to Deutsche Bank’s Jim Reid.
  • The SPX is trading at 21x forward earnings.
  • Nikki Haley dropped out of the Republican race, setting up a rematch nobody wants. Trump seems to have an edge in the polls, but I think Biden will win. The Democrats have between now and election day to remind everyone of life under Trump, especially January 6th and Trump’s behavior during and after.

SCOREBOARD

Week Ending 2/23/2024

MARKET RECAP

  • S&P 500 +1.66%.
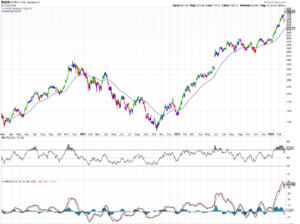
  • Fueled by AI demand for their chips, NVDA continues skyrocketing to a market capitalization of almost $2 trillion. CEO Jensen Huang said AI is hitting a “tipping point” and that “Demand is surging worldwide across companies, industries and nations.” Earnings were up eightfold.
  • International markets are rallying. Japan’s Nikkei 225 hit a record high for the first time since 1989.
  • Unemployment claims fall to 201k.

CHART OF THE WEEK

SCOREBOARD

Week Ending 2/16/2024

MARKET RECAP

  • The SPX hit a record on Monday but closed 0.4% lower for the week. US stocks -0.18%, international stocks +0.92%, bonds -0.54%.
  • Higher inflation put a pause on recent market advances. CPI was up 0.3% for the month and 3.1% for the year. Core inflation was up 3.9%. The SPX fell 1.4% on the news but gained back ground as the week went on.
  • PPI was up 0.7% year over year versus expectations of +0.3%.
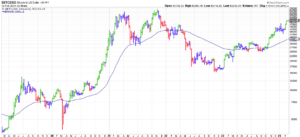
  • Bitcoin cracked the $50,000 level (see the chart below).
  • Retail sales were down a seasonally adjusted 0.8% in January; economists expected an increase.
  • Unemployment claims fell to 212k.
  • Trump v Biden (the highlights below are from the article in this week’s Barron’s – “Trump vs Biden: Who Can Handle the Reins of a Hot Economy)
    • Debt
      • Under Biden, debt will most likely exceed 100% of GDP.
      • Trump added $8.4 trillion to the debt.
      • Biden will add about $4 trillion.
      • Neither party has shown any serious interest in reducing the debt or at least slowing its growth.
      • For now, the debt is manageable.
    • Taxes
      • Many parts of the 2017 tax cuts expire starting in 2025.
      • Marginal rates for individuals will increase.
      • Estate tax exemption will be cut in half.
      • Deduction limits for state and local taxes will change.
      • Trump will try to make those extensions permanent, which would cost $3.5 trillion, according to government agencies.
      • Trump is also thinking about corporate rate cuts.
      • To do either will probably require cuts in spending.
      • Biden will extend tax reductions for households with less than $400k in income.
      • Biden would pay for that by increasing taxes on the wealthy and those with the highest income.
      • He would increase corporate taxes, including a tax on buybacks.
      • He might cut some spending.
    • Tariffs
      • Trump’s tariff strategy from his time as President has been judged “at best a wash” or “mildly negative”, according to MIT economist David Autor.
      • Biden’s main thrust has been to prevent China from getting US technology.
      • Trump says he would increase Chinese tariffs to 60%. That would be a $300 billion tax increase to American consumers, according to Erika York of the Tax Foundation.
      • The threat might be stagflation, lower growth, higher prices.
    • Federal Reserve
      • Powell’s term ends in May 2026.
      • Biden hasn’t spoken on Powell’s reappointment, but Trump has indicated no.
      • Trump does not respect the Fed’s independence.
      • Biden does.

CHART OF THE WEEK

SCOREBOARD


Week Ending 2/9/2024

MARKET RECAP

  • SPX hit a new record and closed above 5,000.
  • US stocks +1.52%, SPX +1.37%, Nasdaq +2.31%, R2000 +2.54%, international +0.79%, bonds -0.84%.
  • SPX and Nasdaq up 14 out of the last 15 weeks.
  • Earnings are coming in 6.9% higher than expectations, suggesting 9% earnings growth.

CHART OF THE WEEK

The S&P 500 breaks 5,000 and hits an all-time high.

SCOREBOARD

Week Ending 2/2/2024

MARKET RECAP

  • US stocks +1.26%, the S&P 500 is at a record high. International -0.14%, bonds +0.69%. Oil drops by 7.35%.
  • The jobs report hammered expectations; non-farm payrolls were up by 353k versus a 185k estimate. Average hourly earnings were up by 0.6% m/m and 4.5% y/y. The unemployment rate remained steady at 3.7%. The only negative was a decline in the average workweek to 34.1 from 34.1, but the bad January weather gets the blame.
  • Q1 growth is estimated to be 4.2% by GDPNow.
  • As expected, the Fed kept interest rates steady.

GRAPH OF THE WEEK

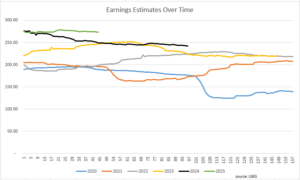
The chart below shows how earnings estimates have progressed since 2020. The black line represents 2024, and the green line represents 2025. In both cases, you see a slight decline as time goes on. That is not unusual, as reality hits as we get closer to the actual year-end dates.

SCOREBOARD

Week Ending 1/26/2024

MARKET RECAP

  • US stocks +1.08%, international stocks +1.35%, bonds + 0.05%.
  • The S&P 500 and the Nasdaq have been up 12 of the last 13 weeks.
  • According to the Stock Trader’s Almanac, three key indicators give a glimpse of what the rest of the year might look like, they are the Santa Claus Rally, the First Five Days (of the year), and the January Barometer (performance for January). When all three are positive, the SPX has been up 90.3% of the time. But this year, only two of the three have been positive because the market was slightly down for the first five days. When one of the three has been negative, the SPX is up only 59.5% of the time, 25 of 42 years, with an average gain of 2.9%.
  • The Fed meets this Wednesday and is expected to keep interest rates the same.
  • The Personal Consumption Expenditures (PCE) index was up 0.2% for December and 2.6% year over year. The Core PCE (x-energy and x-food) was up 2.9% compared to last year.
  • Preliminary GDP for Q4 came in at 3.3%, beating estimates of 2%, indicative that the economy continues strong.
  • After releasing its earnings, TSLA dropped 12% and is now down 26% year-to-date.
  • MSFT joins Apple with a market cap greater than $3 trillion.
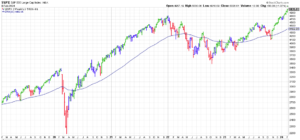
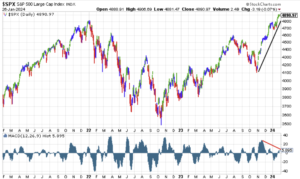
  • The SPX has been on fire, see the positive sloping black line on the chart below. However, the MACD technical indicator is showing a negative divergence. A possible sign of some short-term trouble ahead.

SCOREBOARD