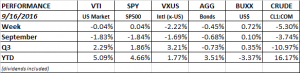
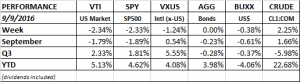
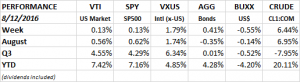
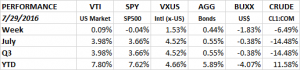
PERFORMANCE
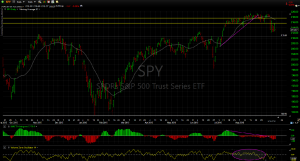
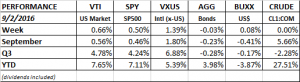
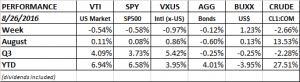
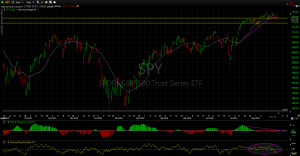
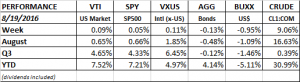
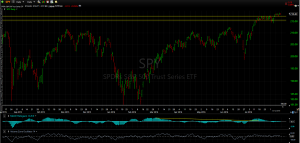
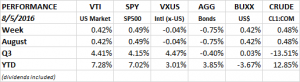
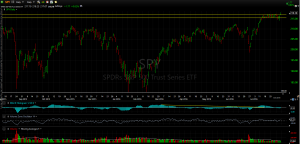
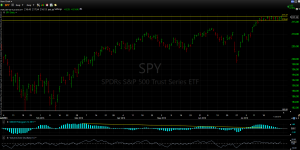
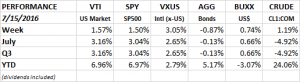
It took 425 days by the SPY (SP500 ETF) hit an all-time high on Tuesday and finished the week higher by 1.50%. The VTI (overall US market) added 1.57% and the VXUS (international x-USA) was up 3.05%. This continues to be a market that hardly anyone believes in, and that may be enough to keep momentum positive. Market breadth (number of companies advancing versus declining) is solid and strong performance by the small caps all are all good technical signs. But the Dow transports are not near their highs. Market analysts like to see transports confirming the action of the overall market. The US dollar was up another 0.74% and oil was up 1.19%.
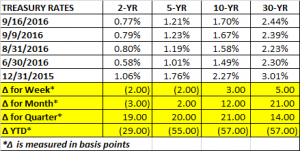
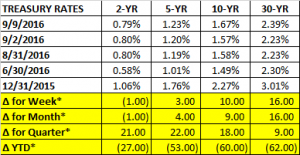
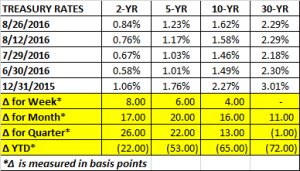
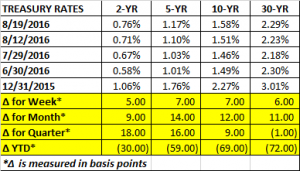
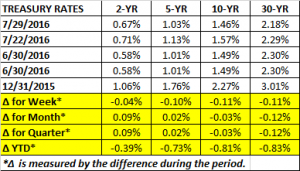
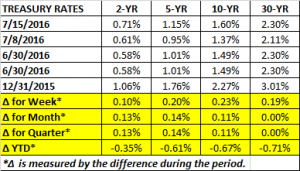
Treasury rates went sharply into reverse. The general consensus going into last week was that rates were headed lower, thus providing fuel for equities to move higher. But that didn’t happen last week. Rates went higher across the curve.
TECHNICALS
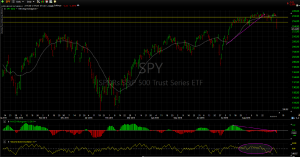
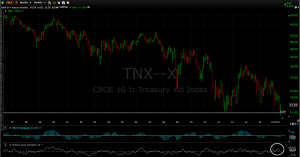
Interest rates have been declining for 35 years. Maybe we saw the bottom last week. As we wrote above, the consensus was that interest rates were still headed lower. But the market had none of it and interest rates reversed higher this past week after setting an all-time record low. The monthly chart below graphs the 10-year Treasury yield (symbol is TNX). After setting an all-time low, the TNX couldn’t hold it, setting up a “spring” (see our May 27th column). There was also a positive divergence with the “volume zone oscillator” (VZO). Notice the white circle in the bottom right of the chart. That sub-graph shows the VZO. The VZO evaluates volume in relation to the direction of the price change. In this example, when the yield on the TNX is moving lower, the VZO was moving higher, resulting in what is called a “positive divergence”. Some technicians would consider that a bullish signal that interest rates would move higher and that is what happened last week.
Of course, there is no technical indicator that is perfect and works all the time. In fact, all college students learn in Corporate Finance that according to the efficient market hypotheses, markets are “weak form efficient.” That essentially means that securities follow a random walk, and that future prices are not influenced by past prices. In other words, looking at technical charts doesn’t help traders or investors. Many people disagree with that hypotheses.
ECONOMY
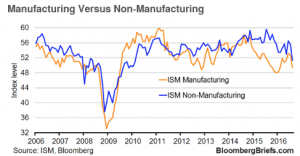
Retail sales advanced 0.6% in June, making it three months in a row. Year over year, retail sales are up 2.60%. Industrial production was up .06% in June, the most in nearly a year. But for the quarter, industrial production was down 1% annualized. Year over year industrial production is down 0.7%.
The Consumer Price Index rose 0.2% in June. Year over year, CPI is up 1.0%, but Core CPI (inflation x food and energy) was up 2.3%, the second fastest pace since 2012. Import prices declined 4.8%, year over year, led by drops in the price of fuel. The pace of decline has slowed over the last nine months. Overall, inflation remains under control.
Mortgage refinancing is up 80.3% year over year as borrowers take advantage of lower interest rates, the fastest pace since July 2012. The Freight Transportation Services Index was up 0.2% in May.
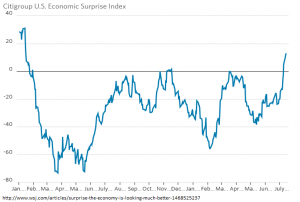
Economic reports have been surprising to the upside. The Citigroup US Economic Surprise Index measures how reports come in compared to consensus. After hitting a recent bottom on May 12, the index has been surging to the upside. Positive surprises in economic news will generally move markets higher and that has probably helped move the market to new highs.
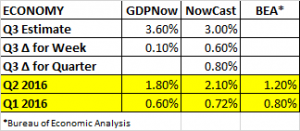
GDP
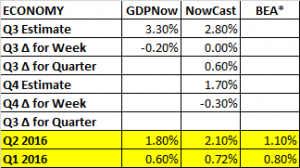
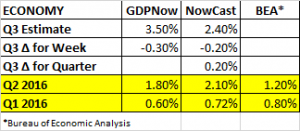
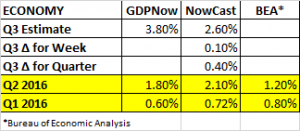
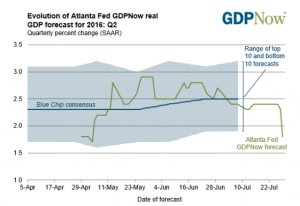
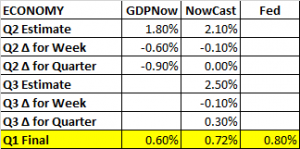
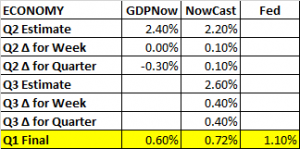
The Atlanta Fed’s GDPNow estimated Q2 growth remained steady at 2.4%. The NY Fed’s Nowcast estimate increased by 0.1% to 2.20%. The Nowcast estimate for Q3 moved up by 0.4% to 2.60%. It is very early to nail down the Q3 numbers, but right now the trend over the first three quarters of 2016 is going in the right direction.
JOLTS:
Job openings dropped for the first time in six months, falling 4.9% in May. Hires were down by 1%, the third straight monthly decline. Both declines are consistent with late cycle labor market activity.
DOLLAR STRENGTH
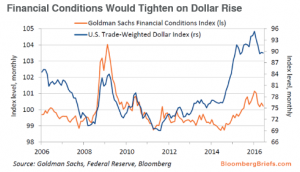
The US Trade-Weighted Dollar Index is a measure of the value of the US dollar compared to other world currencies. The index was started in 1973 with a base value of 100. Today, the value is 90.62. The high this year was 95.80 in January. Between June 2014 and March of 2015, when the dollar was spiking, the index increased by 23%. Economists consider a 4% move in either direction as similar to a 25 basis point change in the interest rate. That would mean the 23% move would be equivalent to a 1.4375% increase interest rates. That move, coupled with the December rate increase, would have a net effect of higher rates of 1.69% since March of 2014, possibly help explaining the sluggishness of the economy and the hit to corporate profits. The worry now is that the dollar may strengthen further on Brexit fears.
DO LOW RATES REALLY HELP THE ECONOMY?
That was the question in Kopin Tan’s Streetwise column in Barron’s this week. Tan notes that U.S. households have $14 trillion in debt but 7x more in assets including $26 trillion in cash and fixed income assets. Deutsche Bank strategists write low rates can be “a sizeable net tax, not a subsidy.”
SUMMARY
The equity markets set a new high after 425 days. Ultralow interest rates helped that move, but rates have gone up over the last week. Economic news has been tilted slightly positive of late.