Notes from Barron’s 5/12/2014

Up & Down Wall Street

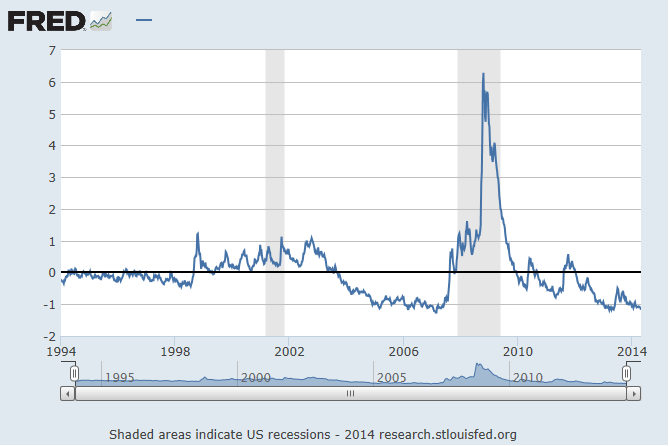
There has been a big rush to buy long-term government bonds, both here in the US and overseas. Long-term rates priced in higher short terms rates than are likely resulting in a yield curve that is too steep. Thus, yields are now moving lower, the opposite of what all the experts thought would happen. Randall Forsyth writes “investors are flocking to safety in the form of low-yielding bonds and so-called defensive stocks sporting high price-earnings multiples. That the true conundrum.”

Hard to Get

HollyFrontier (HFC) – first quarter profit was cut in half from prior year, shares down 5% last week. HFC refines oil in Permian Basin. 2.4% yield with plenty of cash on balance sheet. 11.3x 2014 earnings. Stock can get to $62 (+26%) according to Edward Westlake of Credit Suisse.

A Cheap Play on Alibaba’s Growth

China Mobile (CHL) trades at 11x estimated earnings. Stock has been flat since 2008. Yield is greater than 4% but might drop slightly this year. EV/CF =3.4 based on estimated EBITDA. Government owns 74%. Has been using a 3G network but now rolling out 4G. Has 62% market share in China.

Alibaba needs high speed 4G for growth. Priced at $48 Bernstein analyst Chris Lane has a $67 price target. Matt Ring at Penza says there is “incredible downside protection from both the low valuation and the significant net cash position.”

Risk is that the cash can end up being used for political projects. Minimal FCF this year due to capex.

What the smartest investors are buying now?

Einhorn is short ATHN and said stock could fall 80% from its recent high. Bill Ackman likes FNMA. Larry Robbins likes HUM and WLP. Philippe Laffont was bullish on LBTYA. Zach Schreiber was bullish on VLO and MPC. Jeff Gundlach is bearish on housing stocks. Jim Grant pushed OGZPY. Chris Shumway likes MCO. Mariko Gordon is bullish on EFII, FUL, PCRX. Columbia student Michael Guichon pitched FIATY, trades at 3x EBITDA. Michael Novograts says Brazil can rally if President Rousseff loses in the election.

Flowserve Sees Big Opportunities to Grow

Shares have tripled since 2011 to $75 and trades at 16.9x 2015 estimates but Lee Caleshu of Roosevelt Investment Group see $5 per share next year at an 18 p/e for a $90 price. Earned $3.41 in 2013. Guidance is for between $3.65 and $4.00 this year on a 3 to 6% increase in revenue.

Two Stocks in the Recovery Zone

Brinks was hit with a $122m write down due to currency devaluation in Venezuela. At $25 trades for an EV of 3.8x EBITDA. Competitor Loomis trades for 7x. Jeff Kessler at Imperial Capital thinks margins can get back to 5 to 6% with earnings rising to $1.90 next year. He has a $27 price target.

Big 5 Sporting Goods (BGFV) is down 44% since last May to $12.07. Hurt by falling gun and ammunition sales. Looking to improve margins and comparisons should start getting easier. Mark Smith of Feltl has a $19 price target.

Healthy Profits in Protein

Farha Aslam of Stephens likes Tyson. “Tyson is managed for consistent growth. They have committed to delivering 10% earnings per-share growth annually and to maintaining a very strong balance sheet.”

“They have an active program in place to buy back 34.6 million shares.”

Aslam also likes Pilgrim’s Price (PPC).


Jeff Gundlach interview on Bloomberg

Gundlach was interviewed by Tom Keene. Here are some of his points:

1. “The funding of retirement benefits and health care benefits will start to worsen the deficit again, starting around 2017, and we don’t really know how we are going to deal with that.”

2. Bond yields are being held down by baby boomers that are retiring and need conservative investments.

3. In 6 to 10 years government financing needs will increase and this will put pressure on interest rates.

4.High yield is completely overvalued.

5. Baby boomers selling homes to fund retirements in future years will hurt homebuilders.


April Economic Report

The economy continues to advance, albeit slowly. The GDP came in for the first quarter basically flat, with a 0.1% advance. This was a big miss. GDP increased a strong 3.4% in the back half of 2013 so a drop to 0.1% is significant, but the weather was terrible in Q1 and did have a real impact although it is hard to blame all of the decline on the weather.  But the economic reports coming in over the last few weeks have been generally positive and point to continued slow growth probably in the 2%+ range over the remainder of the year.

Employment reports have been good and the trend in initial claims has been declining of late. Continuing unemployment claims are down 5% from the end of March and down 10% from the end of February (this is based on the April 25 numbers). Jobs are still not being created in big numbers but they are being created. There is no news of huge layoffs in the system.

Regional activity for the most part is also up. The Chicago PMI was way up but the Milwaukee PMI was down. Reports from the Dallas Fed, Philadelphia Fed, Richmond Fed all were positive by nice amounts. The KC Fed report was down from the prior month. So in general the reports were leaning positive.

The home sale numbers released in April were the big disappointment. New home sales came in much lower than consensus (384k v 450k) and lower than last month (440k). But home prices continue to increase. The S&P/Case-Shiller 20-City Home Price Index increased year over year by 12.9% but this represents a smaller increase for the third consecutive month. Auto sales, released at the beginning of the month were good. Light vehicle sales were running at a 16.3m annual pace above the estimate of 15.84m.

While the economy is not booming it is not reversing either and there appears to be minimal stress in the system. The St. Louis Fed Financial Stress Index which is designed to measure stress in the financial system posted its largest weekly decline in 10 weeks today (report as of April 25 but released May 1) and is now at its lowest level since March 15, 2013.

ST. Louis Fed April 25 as of May 1

Below are the April numbers:

April Economic Report


Barron’s 4/28/2014

Notes from this week’s Barron’s.

WHY AIG COULD DOUBLE IN FIVE YEARS

World’s largest insurer by stock market value. Operations in property and casualty, life insurance, annuities and mortgage guaranty. Combined ratio last year was 101.3% down from 108.5%. Expecting 100.3% this year and 98.9% next year. Josh Stirling of Sanford Bernstein is looking for 93% next year and 90% within five years.

Shifting to property policies from casualty which helps with pricing discipline. More like BRKA.

With company priced less than book repurchases might be an option as cash becomes available. Book value is $69 now, stock is priced about $52, and BV could get to $80 in five years.

ASSESSING PFIZER’S FUTURE

Low p/e, 3.4% dividend and a decent pipeline. P/E less than 14x projected 2014 EPS, half the p/e of BMY. Company might split three ways in 2017. $7b in dividends and $5b in buybacks this year.

BIG MONEY POLL

1. 56% Big Money respondents call themselves bullish or very bullish on US stocks, down from 68% six months ago.

2. 35% are neutral, up from 24% six months ago and 19% one year ago.

3. 73% says market is fully valued, 18% say it is overvalued.

4. Big Money bulls see the Dow hitting 17,418 by year-end and 18.072 by June 30, 2015. SP500 to 2063 by mid-2015 and NASDAQ to 4855 by mid-2015.

5. 60% say US will be best market, 23% think Europe and 14% like emerging markets.

6. 66% are bearish on Gold.

7. 90% are bearish on US Treasuries and 80% on US corporate bonds.

8. Favorite stocks are GE, BAC, C. Tesla is most overvalued.

PREPARING FOR THE BEAR’S RETURN – an interview with Doug Kass

Kass is bearish (surprise). SP500 consensus earnings of $120 are inflated due to corporate profit margins at 60-year highs, normalized earnings are well below $120. Market p/e of 16 is more like 19 using reasonable margin assumptions. Fair value for the SP500 is about 1650, 12% below recent prices.

Kass is long closed-end municipals selling at about a 6% discount like VPV and NQU. Long OCN. Pairs trade – short TSLA and long GM. Short BAC. Long Monitise [MONLUK] – a London company that provides payments on mobile devices. Kass see it as a 5-bagger. Price is about 66 pence. MA and V have a stake in it. Leon Cooperman is the largest shareholder and owns 12%.


Calculating the Intrinsic P/E

I am rebuilding a spreadsheet that I use to value equities and am working on the calculation of the Intrinsic P/E, so to help give myself a refresher I am writing it all out for the benefit of my readers, so enjoy!

The intrinsic p/e is the sum of the tangible p/e and the franchise p/e. The tangible p/e assumes the company has no growth or that it will pay out all of its earnings. The franchise p/e represents the present value of future growth and is broken down into two components, the franchise factor and the growth factor.

I will use an example as shown on page 192 of the 2010 CFA Program Curriculum, Level II, Volume 4.

In the example, the company can generate a return on equity of 15% (ROE) and the earnings retention ratio is 0.60% (b). Earnings next year will be $100 million and the required rate of return is 12% (r).

First, let’s calculate the tangible p/e. The tangible p/e is simply 1 divided by the required return. In this case, that is 1/.12=8.33.

Next, we calculate the two components that make up the franchise p/e.  The two components of the franchise p/e are the franchise factor and the growth factor and the franchise p/e is the product of those two numbers.

The franchise factor would be the first component and it “is meant to capture the return levels associated with” new investments. The formula is:

(1/r) – (1/ROE) = (1/.12)-(1/.15) = 1.66667

The second component is the growth factor. “The growth factor captures the present value opportunities for productive new investments.” The formula is:

(b * ROE) / (r-(b*ROE)) = (.6 * .15) / [.12 – (.6*.15)]  = 3

The retention rate (b) multiplied by the ROE is the growth rate (g), so we can simplify the formula as follows:

g = b * ROE = .6 * .15 = .09

and then the growth factor formula is now:

g / (r-g) = .09 / (.12 – .09) = 3

Now, let’s calculate the franchise p/e:

Franchise PE = Franchise Factor x Growth Factor = 1.6667 * 3 = 5.00

The intrinsic p/e is equal to the sum of the tangible p/e and the franchise p/e.

Intrinsic p/e = 8.33 + 5.00 = 13.33.

If the company earned $100,000,000 the intrinsic value would be 13.33*$100,000,000 or $1,333,000,000. There are additional formulas that take into account inflation but I am not covering that here.

There you have it! Everything you wanted to know about the calculation of the intrinsic p/e.


A big drop in new home sales

New Home sales fell to an annualized rate of 384,000 in March, the lowest rate since last July, a drop of 14.50%. Economists were looking for a 2.3% increase to 450,000. Year over year, sales were down by 13.3% which is the first decline since September of 2011. New home inventory was at the highest level since November of 2010, that is a 5 month supply of homes which put the market in balance between buyers and sellers. Median sales price was up 5.2% year over year, a nice increase but a decline in the rate of increase. The next couple of months will be important to determine if this is a trend or just a temporary drop.