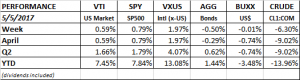
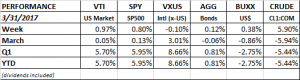
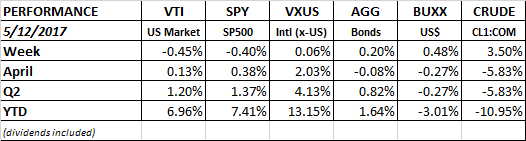
PERFORMANCE
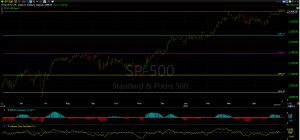
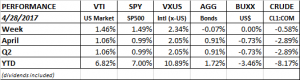
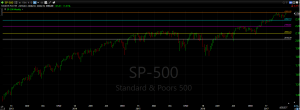
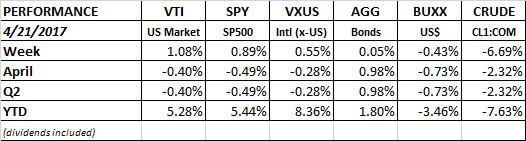
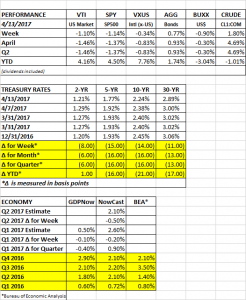
The SP500 cracked through its all time high on Monday and Tuesday, but could not hold the gain and fell slightly through the end of the week. The index was down 0.3% while the NASDAQ managed a 0.1% gain.
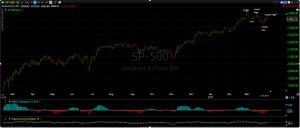
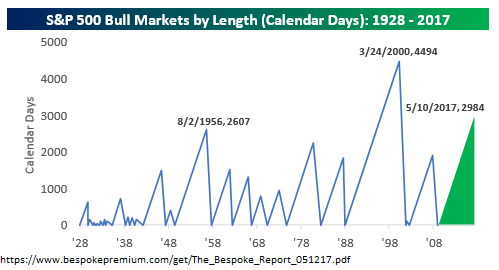
The US bull market is now 2,984 days old. That is the second longest bull run since 1928.
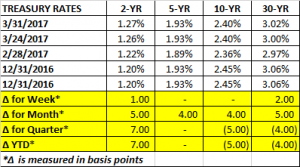
Treasury yields generally fell by a few basis points out to ten years on the treasury yield curve, helping move the bond index higher by 0.20%. The dollar and crude were also up.
Retailers fell hard. Macy’s dropped by 17% on Thursday and Nordstrom was 11% lower on Friday. On-line commerce continues to hammer away at the brick and mortar retailers. Retail overall has been ok. Sales were up 0.4% in April and on-line retail was up 1.4%. Year over year, retail sales were up 4.7%.
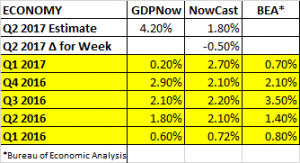
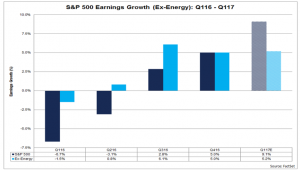
The earnings story for the S&P 500 is positive. Q1 earnings might rise 14% year over year.
International equities were just above break even for the week.
TRUMP FIRES COMEY
Trump fired FBI chief James Comey which brought back memories of Nixon’s dismissal of Watergate special prosecutor Archibald Cox in 1973, in an event that became known as the “Saturday Night Massacre.” That, along with some really bad economic policies such as price controls, set off several years of economic hardship that included 9% unemployment, 12% inflation, a 13% fed funds rate and a GDP measure that sank by 3.2%. The economy is much different now and appears in better shape, but the memories are somewhat eerie.
One thing that might not be so different is that the stocks driving much of the market advance were part of a select group. Then, it was the “Nifty 50”, considered stocks that you could buy and hold forever. Today, we have the FANG, and even more exclusive set.
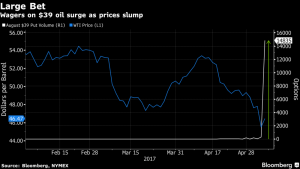
OIL
Oil has fallen 15% this year but rallied 5% in the last six days. Inventory fell more than expected. The international energy agency said that supply and demand are beginning to come into balance, and that inventories might begin to decline if OPEC extends production cuts beyond May. The recent drop in crude might have flushed out the remaining oil bulls. This might be laying the ground work for an advance in oil prices.