
Author Archives: admin
Week Ending 3/11/2016
The market continued its move higher as the overall stock market (VTI) advanced by 0.89%, the SP500 (SPY) was up 1.16% and the international markets x-USA (VXUS) had a 1.54% gain. For the year, the SPY is now off only 0.54%. The aggregate bond index (AGG) was roughly flat for the week, +0.037%.
ECB
The European Central Bank (ECB) announced it would lower the rate it charges banks by 10 basis points and would provide banks with long term cash. The cash would be free of charge but if it was loaned out there would be a 40 basis point cost. Monthly bond purchases would increase to $89b and would include buying non-financial European corporations with investment grade ratings. The market’s initial reaction was negative but then turned positive on that announcement.
ENERGY
The International Energy Association said it saw signs of a price bottom helping increase the price of crude oil to $38.50. Four weeks in a row of stable to higher oil prices have coincided with a four week stock market win streak.
MARKET TREND
The market has put in a strong performance over the last four weeks, but from a technical perspective, while the daily trend is up, the weekly trend is still down. The market needs to put in a higher low on the next downturn for that trend to flip. Nevertheless, this market has had ample opportunities to turn down in the last couple of weeks and has managed to push higher each time.
US ECONOMY
It was a light week for economic news, but we received another positive jobs report. Initial claims for unemployment dropped to 259k, marking the lowest reading of the year and the third lowest reading of this entire economic cycle.
With the generally good recent economic news including the strong employment reports as well as the recover of the equity markets, the chance for a couple of Fed interest rate increases is back on the table. The Fed meets this week. And while we don’t expect an increase this week, the probability for a move in the next few months is markedly higher now.
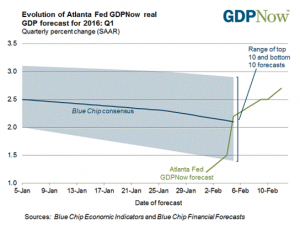
The latest GDPNow forecast from the Atlanta Fed came in at 2.2% on March 9th. Same level as the week before. So US estimated GDP growth for Q1 continues to appear to be positive.
EARNINGS
Companies are in an earnings recession. According to Factset, 99% of companies have now reported earnings. 69% beat their earnings estimate and 47% beat their sales estimate. The market sells at a forward p/e of 16.1, which is above the 5-year average of 14.4 and the 10 year average of 14.2. Looking forward to Q1, analysts have now cut estimated earnings by 8.8%. The 5-year average for the entire quarter is -4%. The estimated year over year earnings decline for Q1 is now -8.3%. At the start of the quarter, the estimated growth was +0.3%. Energy, materials and industrials are leading the decline. The estimated sales decline is -0.8%. Analysts are looking for positive earnings and revenue growth beginning in Q3. On an annualized basis, analysts are looking for earnings to increase 2.7% and revenues to increase 1.6% for 2016.
INCREASED CHANCE OF GLOBAL RECESSION
While economic news in the US has been improving, there has been a decline overseas. The odds of a global recession are now slightly higher than a few weeks ago. The OECD Composite Leading Indicator for OECD countries plus six key nonmember economies fell by 0.1 point in January to 99.1, the lowest level since September of 2009. When broken down by individual countries, only 47% of the composite leading indicators are now above their long term averages. According to Ned Davis Research, when less than one-half of the countries are above their long term averages the global economy has usually been in recession. However, a global recession does not necessarily mean a US recession and for now, the US appears to be continuing in slow growth mode. As we wrote on 2/12/16, when the global economy is in recession but the US isn’t, the loss in international equity indexes has been about 17%, compared to 45% when the US and the global economy is in recession.
SUMMARY
Overall, the equity markets have been strong over the last month. The US economy shows continued slow growth and led by strong employment reports, does not appear to be headed for an imminent recession in the next several months. Overseas, the global economy is slowing and the recession threat is now higher.
Week Ending 3/4/2016
MARKET
It was a very strong week in the equity markets as the overall US stock market (VTI) increased 2.99%, the SP500 (SPY) was up 2.74%, international markets (VXUS) flew higher by 6.03% and the aggregate bond index fell 0.33%.
On a daily basis, the trend is no longer down. The market has put in higher highs and higher lows. Bears still argue this is simply a bull run inside of bear market. They may be right, time will tell. It is not unusual for strong rallies inside of a bear market. But our belief is that for a bear market to take hold, the US economy would have to spin into recession. And the last few weeks, while mixed, the thrust of the economic data has been indicating that the US will avoid recession for now. This is confirmed by the latest GDPNow estimate of Q1 real GDP growth, which moved up to 2.2% from 1.9% last week.
EMPLOYMENT
Non-farm payroll had another strong report, rising 242,000 in February. The prior two months were revised higher by 30,000. The unemployment rate remained steady at 4.9%. The average work week fell by 0.2 hours and average hourly earnings dropped by 0.1%.
Initial claims for unemployment rose by 6,000 to 278,000. The four-week average dropped by 1,750 to 270,250.
Overall the employment reports are positive and show strength in the US economy.
PRODUCTIVITY
Productivity of nonfarm workers fell at a 2.2% seasonally adjusted rate in Q4 of 2015. It was the weakest report since Q4 of 2014. This was not a good number. Only four times since 1994 have there been weaker quarters. Lower productivity coupled with higher wages increases unit labor costs, and at some point, higher unit labor costs will encourage businesses to find ways to reduce those costs. In other words, cut employment or slow its growth.
MANUFACTURING
Factory orders were up 1.6% in January, a seven month high. The ISM Manufacturing report came in at 49.5. A reading of 50 is considered break-even, so 49.5 would indicate a small decline in activity, but that number is better than recent reports and was better than the consensus estimate of 48.5. It is the second straight month with a higher reading (month over month). Recent reports like this might be indicating that the manufacturing sector has stabilized.
NONMANUFACTURING
The ISM gauge of nonmanufacturing businesses fell to 53.4 in February from 53.5 in January. That is the lowest level in two years but still a healthy amount above the break-even level of 50. The reading indicates the US economy continues to expand.
CREDIT QUALITY
Moody’s Investor Service monthly tall of the least creditworthy companies (ie junk ratings with a negative outlook) rose to 274. The all-time high was 291 in April of 2009.
IRS List of Tax Scams to Watch For
IRS list of possible tax scams. Click to watch.
Week Ending 2/26/2016
It was a winning week as four of the main indexes we follow advanced. The overall US market as measured by the VTI was up 1.86%, the SPY was up 1.61%, overseas x-US (VXUS) was up 0.12% and the aggregate bond index (AGG) was up 0.15%.
WARREN BUFFET SETS THE RECORD STRAIGHT
Warren Buffet, in his much anticipated annual letter for Berkshire Hathaway, set the record straight (at least in his opinion) on the US economy and the constant negative attacks by our political candidates.
Buffet writes, “It’s an election year, and candidates can’t stop speaking about our country’s problems (which, of course, only they can solve). As a result of this negative drumbeat, many Americans now believe that their children will not live as well as they themselves do.
That view is dead wrong: The babies being born in American today are the luckiest crop in history.”
Buffet writes that American GDP/capita has increased in real terms by a factor of six since 1930.
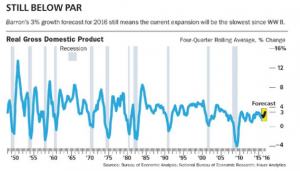
“Some commentators bemoan our current 2% per year growth in real GDP – and, yes, we would all like to see a higher rate. But let’s do some simple math using the much-lamented 2% figure. That rate, we will see, delivers astounding gains.
America’s population is growing about .8% per year (.5% from births minus deaths and .3% from net migration). Thus 2% overall growth produces about 1.2% per capita growth. That may not sound impressive. But in a single generation of, say, 25 years, that rate of growth leads to a gain of 34.4% in real GDP per capita.”
“For 240 years it’s been a terrible mistake to bet against America, and now is no time to start. America’s golden goose of commerce and innovation will continue to lay more and larger eggs.”
PERSONAL INCOME/CONSUMER STRENGTH/INFLATION/GDP
Reports this week show that the much feared threat of recession did not gain traction in January, at least in the United States. Personal income rose 0.5% in January, the biggest increase in eight months. Personal consumption expenditures also rose 0.5%, the most in seven months. This is a good signal for Q1 GDP growth as the consumer spending accounts for 70% of overall growth. Inflation also is picking up, core prices rose 1.7% year over year, close to the Fed’s 2% inflation target. This data suggests the economy is not slipping into recession at this time and would give the Fed more ammunition to increase rates once or twice this year.
The 2015 Q4 GDP estimate was raised up from 0.7% to 1.0%, matching the GDPNow number for Q4. The GDPNow latest forecast for Q1 growth came in at 2.1% on Thursday, down from 2.5% but still an improvement on the Q4 number.
BANKS/ENERGY LOSSES
Energy related losses are now beginning to pile up at the banks. Wells Fargo (WFC) has allocated $1.2b in reserves for potential losses. “If oil remains low for a prolonged period of time, there could be additional performance deterioration in our oil and gas portfolio resulting in higher criticized assets, nonperforming loans, allowance levels and ultimately credit losses,” according to a securities filing on Wednesday. About 2% of Wells $917b loan portfolio is related to oil and gas. JP Morgan (JPM) is adding $500m in reserves bringing the total to $1.32b. The Company said that if oil is priced at about $25 per barrel for 18 months that bank might need to increase reserves by another $1.5b. But JPMs CEO Jamie Dimon says the bank can absorb the losses. “I put [that] in the drop-in-the-bucket category” relative to the strength of the balance sheet.
Banks also have billions in untapped lines of credit that energy companies can draw upon. JP Morgan has $44b in exposure including $30b that is still unfunded. Dimon says a good portion of that is in loans to investment-grade companies and may not be drawn upon. Bank of America (BAC) has $22.6b and Wells $24.6b in unfunded loans.
Regional banks also have exposure. Regions has about $2.9b in unfunded loans roughly matching the amount already outstanding. SunTrust has $3.1b outstanding and $6.2b unfunded.
VENEZUELA
Venezuela’s economy is spiraling out of control. Since Chavez took power, and continuing with President Nicolas Maduro, the country has made just about every single economic mistake that a country could make. Nevertheless, the country managed to cover the $1.5b debt payment on Friday and says they are committed to meeting their international obligations. At least give them credit for that. Senior economic official Miguel Perez Abad said on Tuesday that “the state will honor its debt.” The reason, a default would open up claims to the assets of the state run oil company, including Texas based Citgo, which is owned by the Company and processes hundreds of thousands of Venezuelan oil every day. Venezuela has about $120b of foreign debt including the oil company. The majority of emerging market debt funds hold some Venezuelan debt. The country also has $30b in other debt to private companies like airlines, pharmaceutical companies, etc. They made the payment this week, but unless oil rebounds future payments are in serious doubt.
EARNINGS
The difference between “pro-forma” reported earnings and earnings based on generally accepted accounting principles (GAAP) reached 25% for the 2015 year. That is the biggest gap since 2008. GAAP are the official earnings although companies will tell you that their pro-forma earnings present a more realistic picture of the earnings. A large difference is not a good signal as they tend to occur at times when the economy is having difficulty. The SP500 trades at 17x pro-forma earnings and 21 times GAAP earnings. For 2015, pro-forma earnings were up by 0.4% but down by 12.7% per GAAP. Most of that difference was due to the energy sector. They reported $45b in income on a pro-forma basis but had a GAAP loss of $48b. Other sectors were guilty also but not to the same extent. Materials had a difference of $27b, health-care $53b and tech $42b. Overall, GAAP SP500 earnings were $787b compared to pro-forma numbers of $1.04t.
Week Ending 2/19/2016
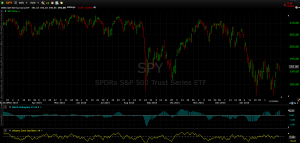
The market picked up where it left off on Friday and put together back to back +1% gains on Monday and Tuesday. For the week, the overall US stock market was up 3.12% (VTI), the SP500 (SPY) was up 2.87% and the aggregate bond index (AGG) was even. The market was led by up by stocks with heavy short interest.
This downturn has been marked by a series of lower highs and lower lows. The SPY, which closed at 192.00, will have to get north of 194.60 to set a higher high to possibly signal a change in trend.
RECESSION THREAT
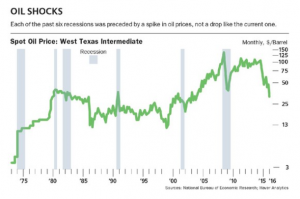
Gene Epstein writes in this week’s Barron’s about the threat of a recession. In each of the six previous recessions, there was a spike in crude prices before the onset of a recession. There is no case of a recession when crude prices were falling as they are currently.
Of course, the threat in this case is that falling crude prices will lead to a wave of defaults impacting banks and high yield bonds. According to Carsen Valgreen of Applied Global Macro Research, these types of loans amount to less than 4% of the banks’ total loan book. So even if half of these loans go bad, it should not be enough to set off a banking crisis.
The US economy continues on its slow growth path, while economic conditions might be on a more slippery footing overseas. According to Michael Lewis, economics chief at Free Market, “in the modern era, there is not a single recession that can be traced to foreign economic woes.”
Epstein concludes that we should be able to avoid a recession, albeit with subpar growth.
OIL
The market was helped by some talk that OPEC members were in discussion to limit production to get the price of oil under control.
HOME BUILDER SENTIMENT
Home builder sentiment fell to its lowest level since May. Time will tell if we have seen the peak in sentiment. In the past, peaks in home builder sentiment often preceded a downturn in the overall business cycle by at least two years.
LEADING ECONOMIC INDICATORS
The Leading Economic Index fell 0.2% in January, marking the second straight decline. Four of ten LEI components declined. But the six-month smoothed LEI number increased. An alternate leading index, made up of the difference between the Coincident Index and the Lagging Index, increased by 0.2%.
JOBLESS CLAIMS
Jobless claims fell again, to 262,000. This is the lowest level in three months.
INDUSTRIAL PRODUCTION/CAPACITY UTILIZATION
Industrial production was up 0.9% in January. This was the first gain in four months and the most since November 2014. Manufacturing output was up 0.5% and the capacity utilization rate increased to 77.1% from 76.4%. These increases show signs that the industrial and manufacturing sector are beginning to stabilize, thereby reducing the near term risk of recession.
HOUSING
Housing starts dropped 3.8% in January. Snowstorms in the northeast might have impacted the number.
Week Ending 2/12/2016
It was another tough week in the equity markets. The US market (VTI) was off 0.94%, the SP500 (SPY) -0.70% and the international markets (VXUS) -3.05%. The aggregate bond index (AGG) was up 0.41%. The market did rally on Friday, as the SPY advanced 2.06% on higher energy prices, better retail sales, and insider buying at JP Morgan.
For the year, the SPY is down 8.45% and it is off 12.58% from its high on May 21, 2015. The market is in a tug of war over the probability of a recession. On one hand, declining equity markets point to higher probabilities of recession, while hard economic numbers point toward continued slow growth. The most recent GDPNow forecast, released by the Atlanta Fed on February 12th, shows Q1 growth at 2.7%. The estimate has increased three weeks in a row and it is up from the 2015 Q4 estimate of 1% growth. Employment numbers are also solid and we had a good retail sales report (see below).
Whether or not the US enters a recession is important in determining possible implications for the market. According to Ned Davis Research, the average loss on the MSCI ACWI international index when the US and the global economy is in recession is 45.2%. But when the global economy is in recession but the US isn’t, the loss has been 16.8%. At the low on January 20th, the SPY was down 15.22%. The ACWI was down 17% from its high on that date. So if there is a recession overseas that the US escapes, a lot of the downside might already be in. As it is, growth around the world seems to also be advancing slowly.
Looking at the SP500, the median drop in a bear market during a recession has been 29.7%. But the median drop in a bear market during an expansion and within a long-term market uptrend has been much less, 19.3%.
WORST START EVER
Through February 11, the SP500 was down 10.96% year to date. That makes it the worst start ever since the index began in 1928. The previous low was in 1948 when the SP500 was down 9.22%. The market finished 1948 up 9.43% from that point.
RETAIL SALES
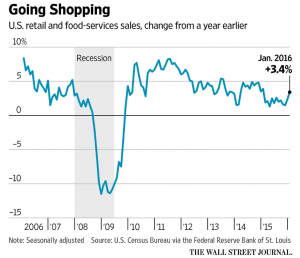
The January retail sales report came in with good numbers. Excluding autos and gas, sales were up 0.4% and they were up 3.4% year over year. December numbers were also revised higher. Consumers might be finally starting to spend their gas savings “dividend.”
EARNINGS
According to Factset, 76% of SP500 companies have now reported earnings. 69% have beat the mean estimate and 49% have topped the sales mean estimate. The blended earnings decline is 3.7% for Q4. 68 companies have reported negative EPS guidance and 17 guided to the upside. The 12-month forward p/e is an even 15 based on the Friday close (1864.78/124.25).
NEGATIVE INTEREST RATES
Fed Chief Janet Yellen was in front of Congress this week. She said a US economic contraction is not imminent. She also said that due to economic uncertainty around the world, the Fed would slow, but not halt, planned interest rate increases. When asked about a negative interest rate scenario, Yellen said that would be a remote possibility. NY Fed President William Dudley said that the debate about negative rates is “extremely premature….the US economy is in quite good shape.”
BANKS
Banks have been hit hard this year. The Financial Select Sector ETF (XLF) is down 14%. Financials are down due to worries about China, lower interest rates, lower energy prices and the spillover from problems in European banks. Credit default swap spreads are increasing in price on all of the major money center banks, but they are not close to the peaks seen in the last crisis. Mike Mayo, a research analyst at CLSA Americas, a long-time bear on the sector, has turned positive on the banks due to their strong balance sheets. In response to the low prices, Jamie Dimon, CEO of JP Morgan, bought about $25m of shares in his Company this week.
SP500 YIELD
The SP500 dividend yield now (2.33%) has a 59 basis point advantage on the 10-year treasury (1.74%). This is the widest spread since 2012. Prior to 2009, we went about 50 years when the SP500 yield was less than the 10-year treasury. According to Bespoke Investment Group, since 1929, there have been five periods where the differential was 50 basis points or more. If an investor bought the index the next day and held for one-year, the returns would have been -19%. +31%, +45%, +32% and +24%. The only negative return was in 1929.
JOBLESS CLAIMS
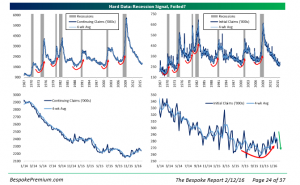
Initial jobless claims came in at 269,000. That was down from last week’s reading of 285,000 and lower than the 280,000 estimate. Continuing claims also declined. This is another signal that fears of a recession, at least for now, are overstated. The JOLTS report shows that layoffs are at lows and employees are feeling comfortable enough to leave their jobs, both signals of a strong job market. This should translate into continued wage gains.
US BUDGET
The US budget came in at a +$55b for January, which was the best January performance in 10 years. The number is also a positive in confirming that the economy is hanging in there. In the last quarter of 2007 and the first quarter of 2008, the balance went negative, indicating economic trouble ahead.
POLITICS
Barron’s cover story this week was titled “Trump, Sanders – Are they killing the market.” We spoke about this in our 2015/2016 Market Review. But as we get closer to the election, and if the possibility of either Trump or Sanders becomes realistic, it could have negative consequences for the market. Of course, either candidate would have to get their radical policies through Congress, something that would be unlikely. Still, some of their proposals would simply be terrible for the United States and the world.
SMALL BUSINESS
The NFIB Small Business Optimism survey fell to its lowest level since March of 2013.
GOLD
Gold has been off to the races in a safe haven trade. The GLD was down 46% from its September 2011 high to its December 2015 low but has since rallied 18%.
2015/2016 Market Review
This is from January 21, but here is a Market Review we did for BlueKey Personal Wealth Planning. We reviewed 2015 and took a look at 2016.
Week Ending 2/5/2017
The US markets continued their decline falling 3.12% (VTI) for the week. Overseas markets dropped 2.32% (VXUS).
Randall Forsyth writes in Barron’s that foreign countries in need of cash, due to the decline in the price of oil, or domestic economic problems (like China), might be tapping into their investments to free up cash for use at home. That might be impacting equity markets around the globe.
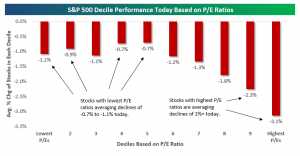
High p/e stocks led the retreat during the big 2%+ sell-off on Friday. LinkedIn (LNKD) dropped about 50%. According to Bespoke, stocks with the lowest p/e’s had average drops from -0.7% to -1.1% while those stocks with the highest p/e’s dropped an average of 1.2% to 3.1%. This analysis was based on splitting the market into deciles and calculating the average declines of the 5 lower deciles and then calculating the five higher deciles. The market has favored growth stocks over value the last couple of years but Friday may mark a change in that sentiment.
EARNINGS
So far 63% of SP500 companies have reported earnings for Q4. According to Factset, 70% have beaten the earnings mean estimate and 48% have topped the sales mean estimate. The blended earnings decline is -3.8%. Assuming earnings end up in the negative, this would be the first time since the first three quarters of 2009 that earnings have declined three quarters in a row. 57 companies have lowered EPS guidance and 14 have raised guidance. 12-month estimated earnings are now $124.29, putting the SP500 at forward p/e of 15.12. Revenue growth has been led by the telecom and healthcare sectors. Energy had the largest decline in revenue.
EMPLOYMENT
Employment numbers released Friday were generally favorable. The unemployment rate fell to 4.9% from 5.0% and a 151,000 new jobs were created in January. The labor force also grew for the third consecutive month. Long-term unemployment hit a new post-recession low. Wages and hours worked improved. On the downside, jobless claims were 285,000 which was higher than expected for the fifth time in six weeks. However, while 285 is greater than some of the low jobless claims numbers we were seeing a few months back, it is less than almost all of the other reports dating back to 2005.
PMI
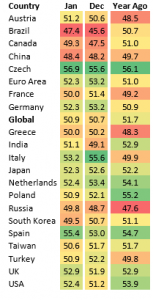
Markit released its Purchasing Manager’s Index for various countries around the world. A PMI reading greater than 50 indicates growth. Of the 20 countries listed, 13 had a PMI greater than 50, two had a PMI equal to 50 and five had a PMI less than 50. Ten of the twenty countries had a month over month improvement. Looking from a global perspective, the PMI improved to 50.9 from 50.7. So growth continues on a global basis at a slow rate.
CREDIT CONDITIONS
There was a negative report this week indicating that credit conditions are tightening. The Senior Loan Officer Opinion Survey showed that credit standards for commercial and industrial loans are starting to tighten. There was also a decrease in these types of loans. In the past, that has been a leading indicator of a recession. However, other types of loans are showing positive growth rates.
ENERGY
The Department of Energy announced that inventories continued to increase for oil, gasoline and distillates. At the same time, demand for oil and gasoline increased. That set up a short squeeze rally that moved the WTI up by 10%. That rally turned the market around from a 1.61% loss to a 0.60% gain on Wednesday.
DOLLAR
The other big news on Wednesday was a massive drop in the dollar. It was the largest decline in the Bloomberg USD index since March 18, 2015.
PRODUCTIVITY
Productivity fell at a 3% annualized rate in Q4 according to the Advance release. Employee compensation increased. The economy had higher wages and flat output resulting in the lower productivity. This could be a bad sign for corporate profits.
CHINA
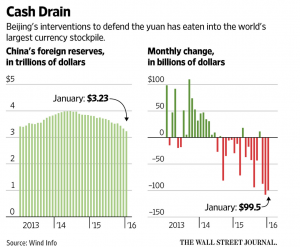
China has been burning through their foreign-exchange reserves, dropping to a 3-year low in January. The government is in a battle with speculators and hedge funds that are betting on a decline in the yuan. China want to maintain a stable currency. For now, their efforts have kept the yuan stable over the last few weeks, the question is how long they can hold out.
SUMMARY
There was plenty of news on the negative side this week. But most every respected economist still does not see a US recession in the near term, although the percentage chances are increasing. The market stalled right at its resistance level of about $95 on the VTI. However, valuations are reasonable. The market is selling at about 15 p/e based on forward earnings and the spread between the dividend yield on the SP500 versus the 10 year treasury bill is at its highest since 2012.
January Recap
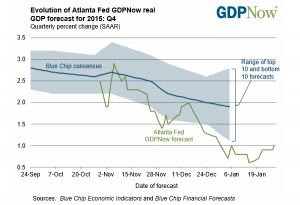
It was the worst start to a year ever, but a small rally towards the end of the month made January the seventh worst opening month start for the US equity markets. According to the Stock Trader’s Almanac, for five of the six other January’s that managed a worse return, gains were positive for the remainder of the year. Fear of spillover effects from China and the price of oil are leading to concern of a recession somewhere down the line. As of now, most economists do not see that happening and are looking to a period of more slow growth ahead. The latest numbers from the Atlanta Fed GDPNow forecast, a week by week estimate of GDP, released on Thursday, show Q4 closing out with a 1% gain. The US Bureau of Economic Analysis released its advanced estimate of Q4 GDP growth on Friday at +0.70%.
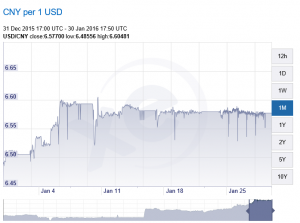
The market got off to a bad start during the first few days of January. There was a trifecta of negative Chinese data that clobbered the market and raised fears of China bringing down the rest of the world economy. The PMI reading out of China was less than 50. The Caixin Manufacturing PMI came in at 48.2, down from 48.6 the prior month but up from 47.2 in September. The currency, the Yuan, also depreciated by about 1.5% during the first week of January (see chart below). Volatilty spiked in the Chinese financial markets as equity price plunged, resulting in the use of newly installed “circuit breakers” that closed the exchanges. This led to even more selling. This combination was lethal and sent equities around the world plunging, the SPY dropped 5.84% by Friday, January 8.
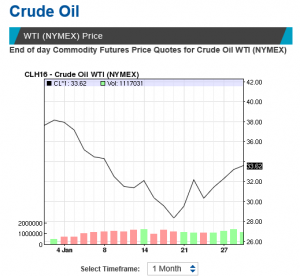
But the damage was not done. The other problem was the falling price of crude oil. Crude oil (West Texas Intermediate) dropped from about $38 per barrel to almost $28 (see chart below) on January 20. Current market prices are well below the marginal cost of production, and if prices don’t rebound there will likely be a wave of defaults in the high-yield fixed income sector. That could lead to negative consequences for the rest of the US economy. Crude began to rebound in the final 10 days of the month, closing January at $33.62. The SPY dropped to a closing low on January 20 of $185.65. That coincided with the low price in oil for the month and put the SPY at 8.94% off of the 2015 closing price at year-end and 12% off the recent high of November 3. On an intra-day basis, the SPY was off 14.21% on January 20th.
As crude oil began to rebound, the market slowly advanced. The market received some surprise news on the last trading of the month when Japan went to negative interest rates on excess reserves. The SPY advanced 2.44% on that. In total, since the January 20th close, the SPY has rallied 4.35%.
Fears that the Fed may move too aggressively and continue on their course of multiple rate increases were somewhat alleviated with their comments of January 27, we are “closely monitoring global economic and financial developments.”
For the entire month, the SPY declined by 4.98%, the overall US stock market as measured by the VTI dropped 5.72%, and international markets (x-US) fell 5.45% (VXUS). In a rush to safety, the aggregate bond index (AGG) moved up 1.24%.
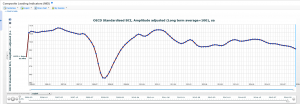
Treasury rates fell. The 2-year dropped to 0.76% from 1.06%, the 5-year to 1.33% from 1.76%, the 10-year to 1.94% from 2.27% and the 30 year to 2.75% from 3.01%. High-yield increased, the Merrill Lynch US High Yield Option Adjusted Spread moved up to 7.75% from 6.95%.The High Yield Corporate Bond ETF (HYG) declined by 1.60%.
Materials (XLB) and financials (XLF) fell 10.71% and 8.85% respectively, while utilities (XLU) led the way with a 4.94% gain. The only other positive sector was consumer staples (XLK) which managed a gain of 0.67%.
The weight of the evidence seems to indicate that the US will avoid a recession, but further downside surprises from China or the price of oil could tip the scales.