Around the Markets – 4/4/13

The market was up 0.41% today after a fall of 1% yesterday. The decline yesterday was the largest in a while and might be a signal of more to come. Since the March 14 high, the market has traded in a tight range and the close has been lower than the open 6 out of the last 14 days, which is a change in behavior from the period between January 1 and March 14. No idea which will the market will break, but it is worth paying attention to.

ValueWalk has run an article on a John Hussman chart that uses the Shiller PE to calculate 10 year returns and compares the projected returns against the actual. The correlation is 0.80. The formula Hussman uses to predict the 10-year return is:

Shorthand 10-year total return estimate = 1.06 * (15/ShillerPE)^(1/10) – 1 + dividend yield(decimal)

The math currently works out to 3.9% projected annual return.

On the other hand, Lee Cooperman spoke today at Portfolios with a Purpose and said that he doesn’t see a better alternative to stocks at the current time.

GOLD AND SILVER

You can see how out of favor gold and silver are by looking at the premium (or lack of premium) in the Sprott Physical Gold and Silver trusts (PSLV and PHYS). Both are trading at close to NAV, something that does not happen often.

Around the Markets – 3/25/13

Housing Investments – The WSJ ran a cover story today highlighting investors that are piling in housing, this time as landlords. Of course, this isn’t news, but one has to wonder if it is a little bit late at this point and how this will all end up. The investments are probably putting an artificial floor on the housing market and making the market seems healthier than it really is. The returns were much higher a year to two and three years ago, not sure how the math is adding up now, unless they are counting on more capital appreciation later and less rental income in the interim. We will see how this all ends up.


Around the Markets – Party like its 1995?

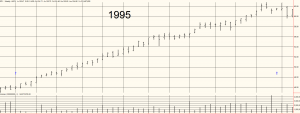
The markets continued its relentless tear last week, making us wonder, when will this advance stall or even decline? Which got us to thinking about 1995, a year that began with a p/e of about 14 (just like the beginning of this year) and a year in which there really wasn’t a decline of any substance the entire year. The market advanced 34% in 1995.

SPY 1995
(the year begins and ends at the blue up arrows)

The Death of a Dictator and a Currency

The death of Hugo Chavez might be followed by his currency, the Venezuelan bolivia fuerte. The currency has lost 21% of its value in the last month. Check out Steve Hanke’s post at the Cato Institute.

Around the Markets – 3/7/13 – Chanos chimes in on Dell

The most interesting story of the day was when Jim Chanos announced on CNBC this morning that he is short Dell. So while just about everyone is arguing that Dell is undervalued and the buy-out price should be much higher, Chanos, perhaps the best short seller out there, is short.

Chanos said, “I’m puzzled here. Are people looking at the balance sheet and the cash flow statement of this company?”

“Looking at the balance sheet at the end of January, Dell had positive working capital plus receivables and long-term investments of about $8 billion,” he said. “They had long-term liabilities of $13 billion. So it’s a negative number before we get to the equity.”

To add to the mix, Carl Icahn has built up a 6% stake in Dell. He values the Company at $22.81 per shares and wants Dell to pay out a $9 special dividend and for shareholders to keep their shares.

For a Company that needs major change to prosper, I don’t see how stripping the Company of cash would be optimal for anyone with any kind of long term interest in Dell.
——————————————————————————————————————

BYRON WEIN -Check out Byron Wein’s March 5th Market Commentary.

INTERVIEW OF THE DAY – Chris Verrone, from Strategas Research Partners, is interviewed on Bloomberg this morning, on technical analysis.

Around the Markets – 3/6/13

Here is our daily peak at some news/observations that caught our attention today:

1. Rich Bernstein compares the current bull run to the 1982-1987 bull market. Check out the chart posted by Dave Wilson from Bloomberg.

2. There is a chart posted on Stocktwits by James Bartelloni that compares stocks that have had parabolic moves in the past. Displayed are AAPL (before the fall), Green Mountain Coffee, Centex Homes and Nasdaq. A clear warning of the danger of these kinds of moves. Of course, optimism was probably greatest at the peaks.

3. Of interest, I am keeping an eye on some of the precious metals and miners (GLD, AUY, PAAS) for a hint of a possible bottom.


Closing out Pairs Trade

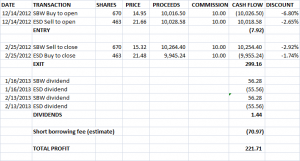
The pairs trade we described on December 14th could be closed out this morning. In that trade, we described how you could go long SBW and short ESD for a net outflow of about $7.92. SBW and ESD are two closed-end funds that invest in emerging market debt, they both have similar risk/return profiles. By doing this pairs trade, you would have been long and short about $10,000 of each CEF.

On December 14th, ESD was trading at a 2.65% discount to NAV and SBW was trading at a 6.80% discount to NAV. The difference was 4.14%, we set a target of closing the trade when the discount narrowed to 1.65%.

As I am writing this, SBW is trading at a discount of 2.92%. ESD is trading at a discount of 1.74%. The spread has narrowed from 4.14% to 1.18%. You could close out this transaction for a profit of $200 plus.

pairs


Please note there could be considerable risk in a trade like this, so always consult a financial adviser and do lots of research.

Assumptions:
1. Short borrow fee of 3.5%
2. No margin fee
3. Commissions of $10 per transaction


Pairs trade with CEFs

A pairs trade is a market neutral trade where an investor goes long one stock (or etf, cef, etc) and short another, usually when the historical relationship between the two is outside the mean, with the objective of closing out the position when the relationship reverts to the mean.

As an example, let’s look at two closed end funds, Western Asset Worldwide Income Fund (SBW) and the Legg Mason Partners Income Fund – Western Asset Emerging Markets Debt Portfolio (ESD).

SBW and ESD share are similar. For starters, both are managed by Western Asset. Below are some pertinent statistics as of 12/13/12.

ESD SBW
Annualized Distribution Rate on NAV 6.47% 6.28%
Total Return on NAV 16.23% 15.46%
Average Portfolio Coupon 7.06% 7.11%
Total expense ratio 1.02% 1.29%

There is not a perfect correlation between the two but they are close.

Closed end funds do not necessarily sell at net asset value (NAV). They can sell at a premium or discount. Taking the current price and the NAV as of yesterday, here are the discounts the two CEFs are selling at.

  Price NAV Discount
ESD 21.66 22.25 -2.65%
SBW 14.95 16.04 -6.80%
Spread     4.14%

Going back about three years and looking at month end data, the average spread between the two is about 0.80%.

A trader/investor can go short the ESD and long the SBW and wait for the spread to narrow and close the position. Assuming the NAVs stay in line with each other, the difference between the closing spread and the opening spread would represent profit, less trading costs and slippage.

As an example, buy 670 shares of SBW at $14.95. Figure a $10 commission (and you can get less), would be an outlay of about $10,026.50. Short 463 shares of ESD at $21.66 less the $10 commission would bring in $10.018.58. The net outflow is $7.92.

Let’s wait and see if the spread narrows to 1.65% and let’s assume the NAV for the two CEFs does not change and let’s assume the price of ESD does not change. These are all big assumptions but this is for illustration purposes. This means that SBW would now be selling at $15.35, or at a discount of 4.30% (15.35/16.04). To close the position sell 670 shares of SBW for $15.35 less commission for $10,274.50 and buy to close the 463 shares of ESD at $21.66 plus the commission for $10,038.58. The net inflow is $235.92.


TRANSACTION SHARES PRICE PROCEEDS COMMISSION NET FLOW DISCOUNT
SBW Buy to open 670 14.95   10,016.50 10     (10,026.50) -6.80%
ESD Sell to open 463 21.66   10,028.58 10       10,018.58 -2.65%
SBW Sell to close 670 15.35   10,284.50 10       10,274.50 -4.30%
ESD Buy to close 463 21.66   10,028.58 10     (10,038.58) -2.65%
Profit (Loss)             228.00

Combined, the profit on this transaction is $228. Not bad for laying out about $8 (understand though that the risk is theoretically infinite). There can be big risks in this trade. The price and/or NAV of the long position in SBW could decline and the price and/or NAV of the short position in ESD could increase, resulting in a loss and maybe a big loss. There are also margin requirements to consider, as well as liquidity, and the impact of taxes and dividends. But this is an example of a possible pairs trade using CEFs.

 

Update on the Hurricane Portfolio

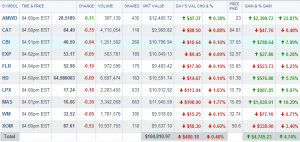
Here is an update on the hypothetical Hurricane portfolio we discussed previously. We are assuming that we bought about $10,000 at the close on October 31, which was a couple of days after the storm. As of the close today, December 3, the portfolio was up 4.74%. In the same time, the SPY was up about 1/10 of 1%. So far, the Hurricane portfolio is beating the market (results per Yahoo Finance).

.