Q3 Recap

Q3 Recap

Summary

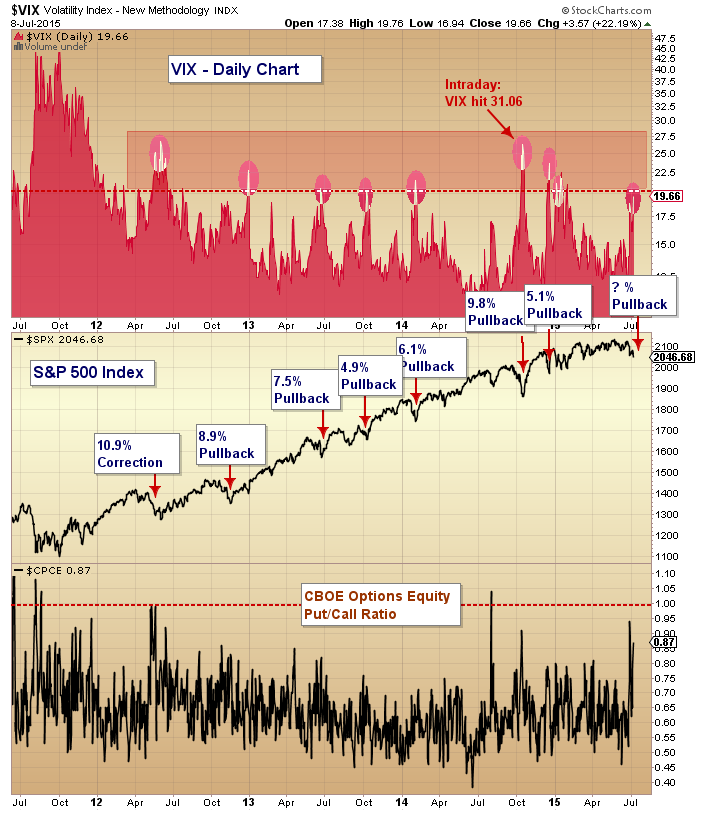
The correction the markets have long been waiting for arrived in Q3. A correction, a decline of 10% or more, last happened in Q3 of 2011. The market hit its high on the SP500 (SPY) on May 21 at 213.50 and at least so far, the low was on August 25 at 187.27, dropping 12.4%. Since then, it has been mainly sideways action bounded by 200 on the top and 188 at the low, with lots of up and down in between. The market closed the quarter on a downswing at 191.63 although the 30th was a positive day.

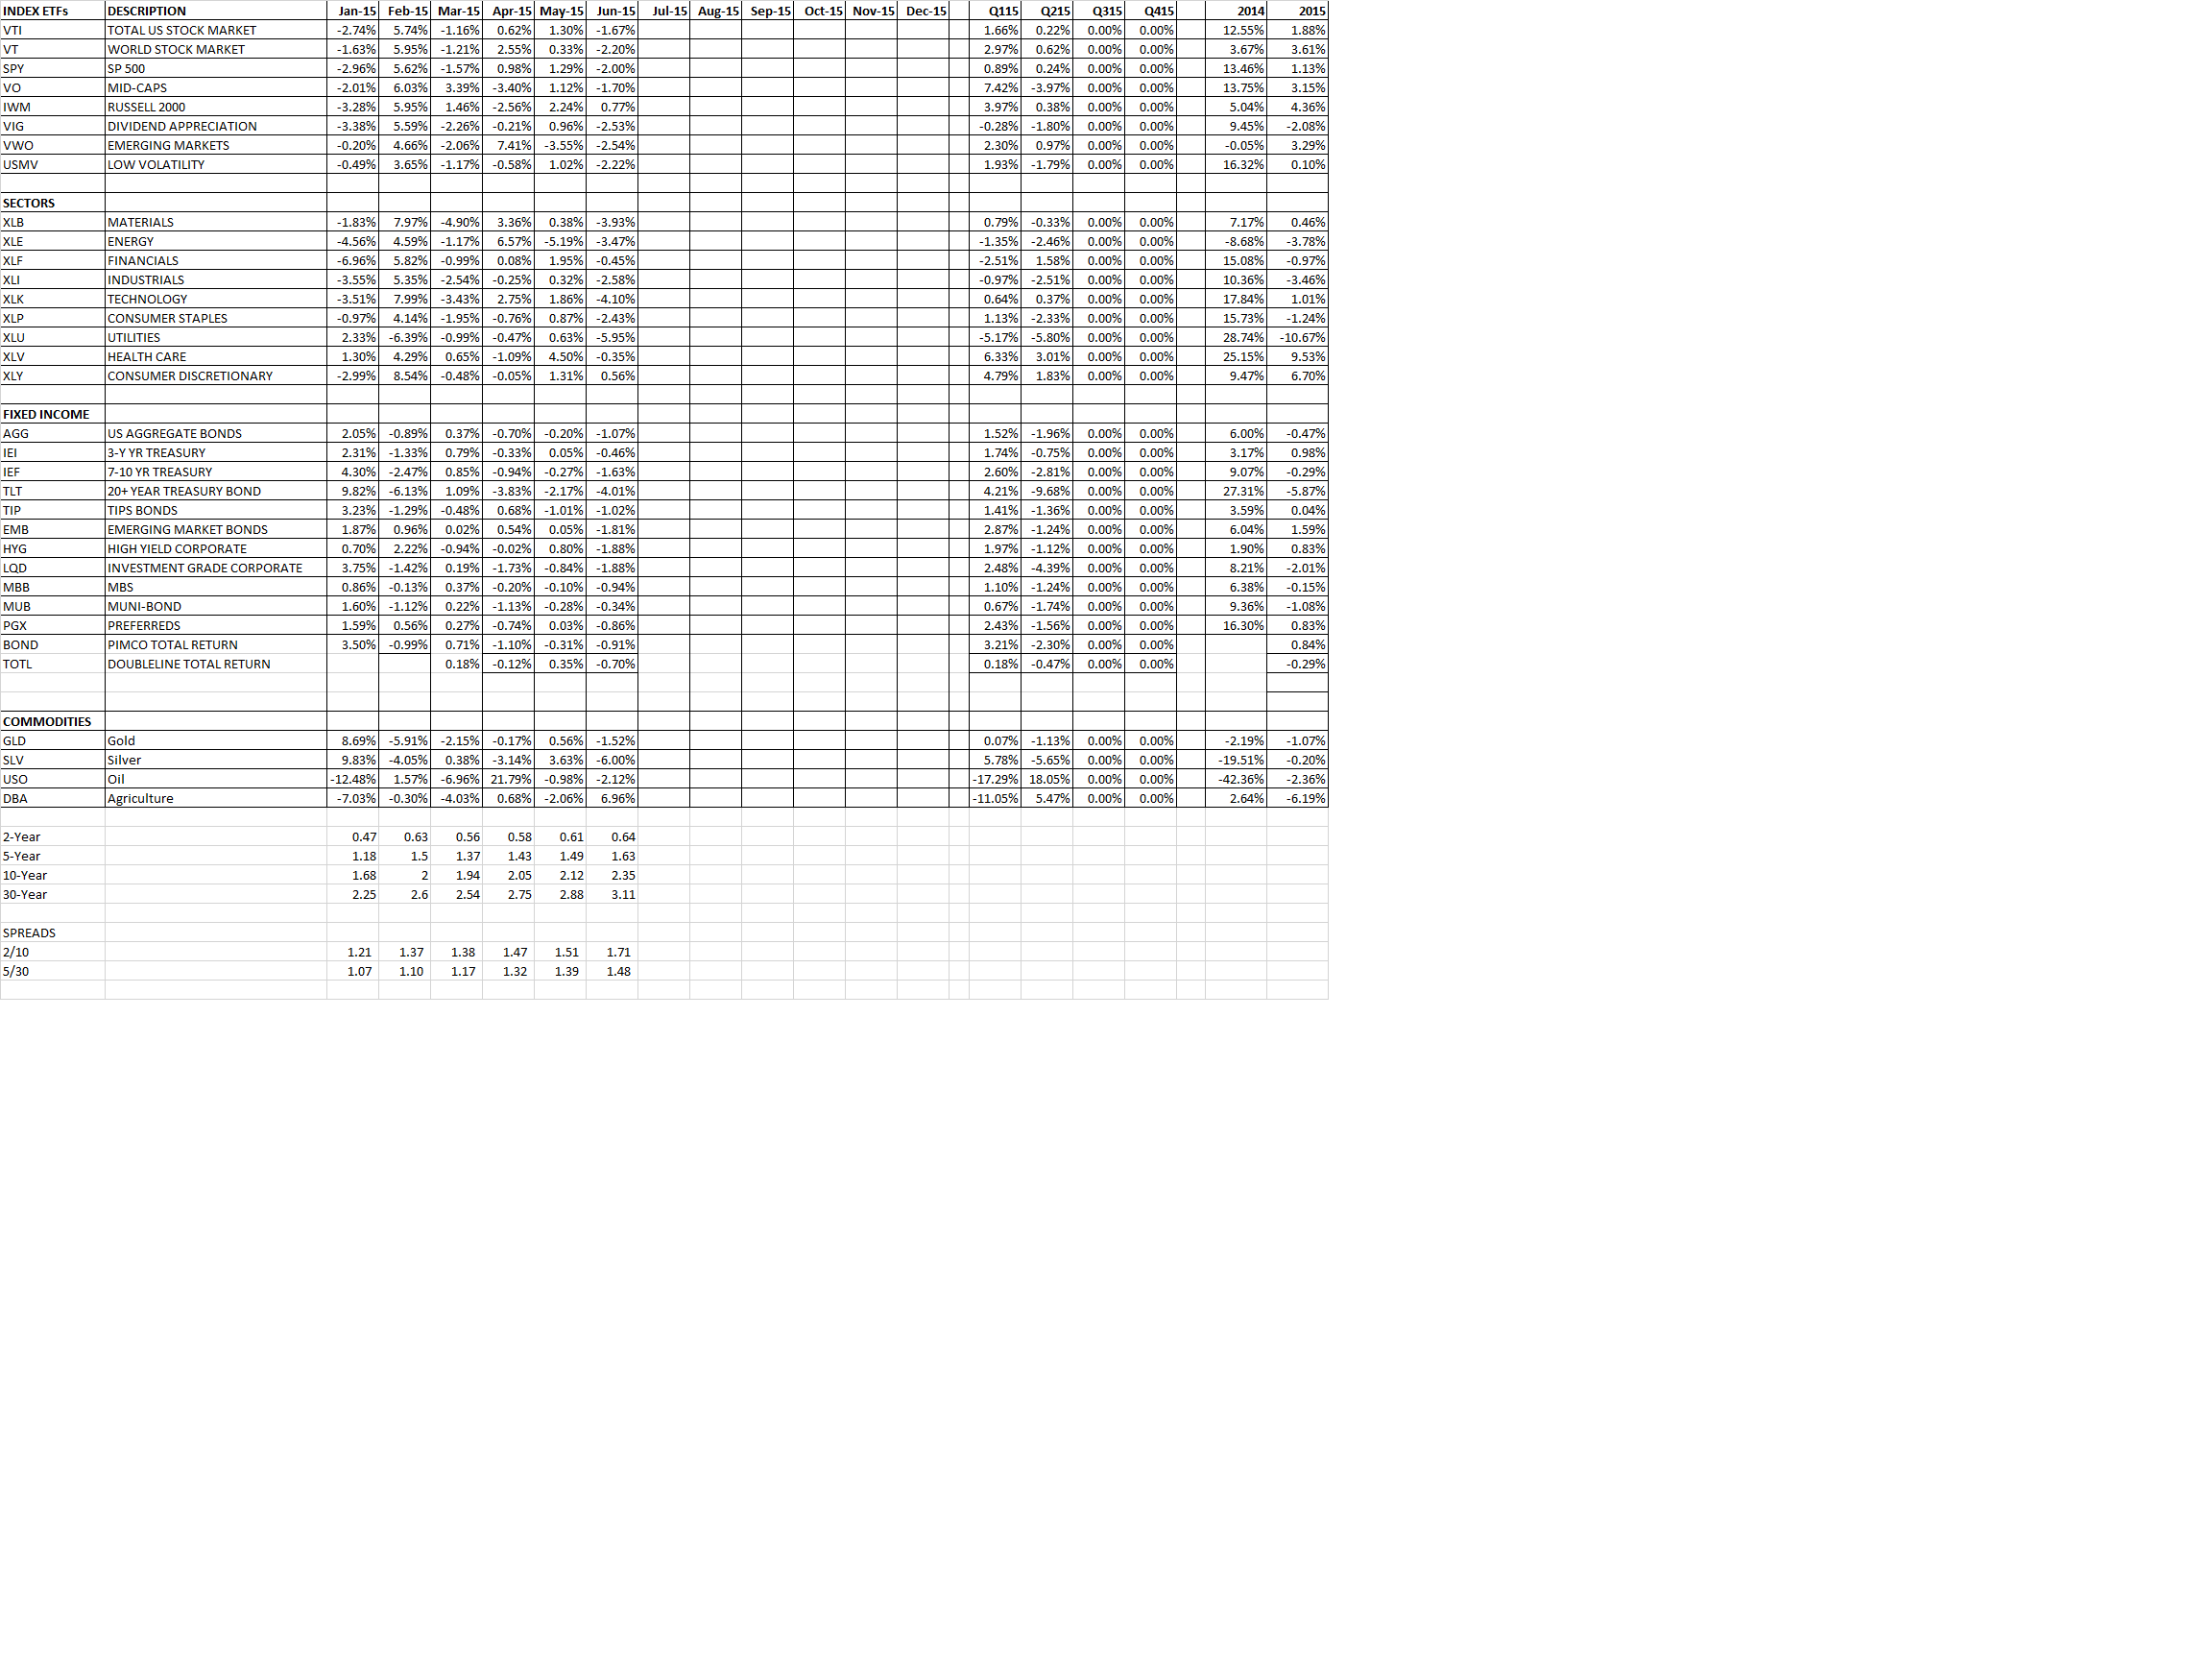
All of the equity indexes were down for the quarter. Emerging markets were hit hardest, down almost 18%, followed by international markets. The SP500 fell 6.44% for the quarter and the overall US markets as measured by the VTI were down 7.28%. The aggregate bond index, which is mostly composed of treasuries, managed a 1.34% advance. All of these numbers include dividends.

INDEX/ETF SEPTEMBER QUARTER YTD
VTI (US MARKET) -2.92% -7.28% -5.53%
SPY (SP500) -2.49% -6.44% -5.39%
VT (INTL MARKETS X-US) -3.24% -9.25% -5.98%
VWO (EMERGING MARKETS) -2.90% -17.95% -15.25%
AGG (AGGREGATE BONDS) 0.81% 1.34% 0.86%

Economy

At the beginning of the quarter the fear was of a Greek default and the uncertainty of a Fed rate increase. After lots of drama, the Europeans managed another deal to kick the can down the road. That settled the markets and allowed for a July advance. But uncertainty about a Fed rate increase, a slowing China, and falling commodity prices doomed the market in August and September.

The Fed still has not raised interest rates, and they might have missed their window. Zero rates should be for an economy in a real crisis mode, as we were back in 2008 and 2009. We have long ago left that era. And while growth has never been gangbusters, it has been slow and steady, and there were numerous opportunities along the way to begin a very slow and gradual liftoff of rates. If the economy were to show signs of slowing, the Fed could simply halt the increases. The problem with artificially low rates is that it encourages activity that would not be optimal had money been priced at market rates. This hurts the economy over time. The other problem is that uncertainty as to the timing of rate increases has caused lots of damage to the market as investors have become ridiculously focused on if, when and how much. As has become the norm for this Fed, they kept to the same script and did not raise rates in September.  The market reaction was not positive. The SPY was up above 200 to the upside in anticipation of an increase, but when the announcement came we closed just below 200 and then the market fell 5.8% to 188.12 over the next couple of weeks. Either the Fed was being too cautious like it often is, or they have greater insight into a slowing economy.

China was cited in the Fed’s statement. And a hard economic landing in China, due to a contracting manufacturing sector has spooked world markets. A slow China led to tumbling commodity prices which devastated emerging markets (see the VWO above) around the world.  China’s direct impact on the US economy is not that big, an estimated 1% or so of the US GDP. But if China’s slowdown hurts the rest of the world that can eventually will hurt the US.

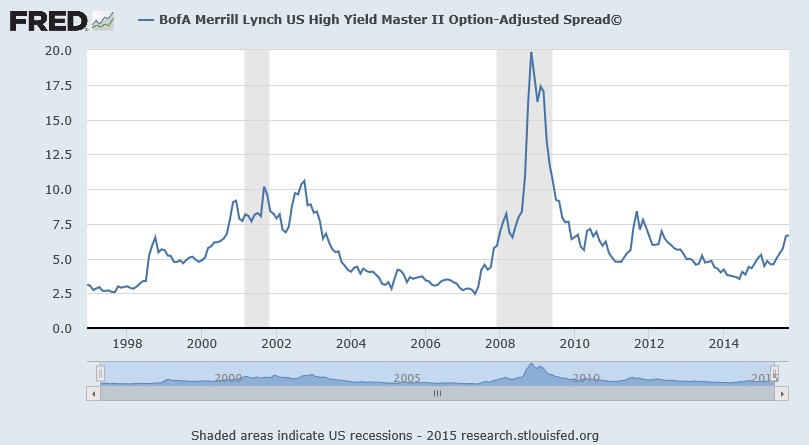
Another negative signal is the rising spread between high-yield and treasuries. A rising spread might indicate the threat of recession.

fred

Markets

While corrections are frightening they are part of normal market behavior. Bigger market declines, called bear markets, defined as a drop of 20% or more, also happen but less so. They are generally associated with recessions. So a lot of the threat of a potential bear market has to do with if a recession is on the way here in the United States. So far that risk is appears low, the US economy seems to be moving slowly forward as it has been (note – employment numbers released on October 2 indicated a slowing economy). Globally, there is a greater threat of a recession due to China.

Another key factor is the valuation of the market. Is the market overvalued, fairly valued, or undervalued? Surprise! There is no clear answer to that. There are valuation models that can put you in either of the three camps.

An analysis of the CAPE ratio argues that this market is still overvalued. The CAPE ratio is the cyclically adjusted price-earnings ratio. It is a 10-year earnings average of the SP500 adjusted for inflation. The ratio is at about 25 and the historic average is about 17. A market fall of 30% would get us to average. However, it can take years for the market to adjust and this has not been a reliable indicator recently. The ratio understands ‘true’ average earnings during an expansion, says Minnesota State University Professor Stephen Wilcox. Changes in accounting methods and taxes over time make it difficult to compare different time periods. The market has been overvalued based on the CAPE ratio for a long time.

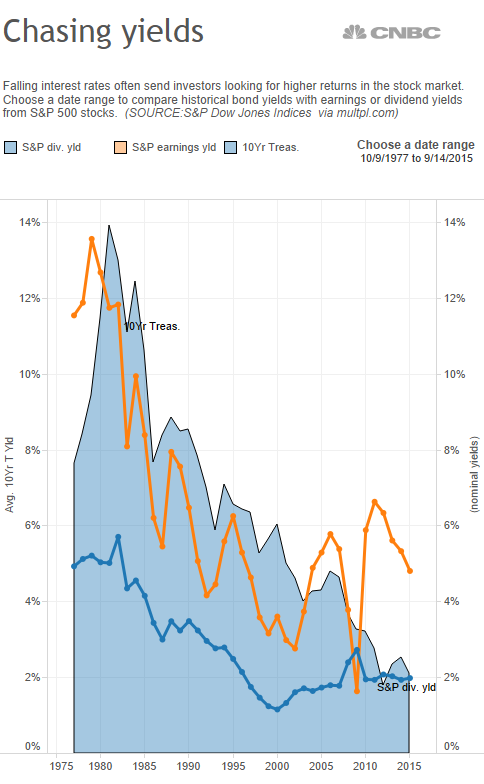
A comparison of the earnings yield of the SP500 versus the 10-year treasury rate shows that the market is undervalued. The earnings yield, earnings divided by price, is normally less than the 10-year treasury rate. But for the last few years, the earnings yield has been greater. Likewise, the dividend yield on the SP500 at 2% is roughly equal to the 10-year treasury yield. This also is unusual. So investors can get the same yield as a treasury and get all the upside of future growth by investing in equities. These are all strong arguments that the market is undervalued.

chasing yields

Performance of Equity and Fixed Income Markets

For Q3, in terms of equity sectors, the REITs as measured by the VNQ managed a 2.14% advance. The VNQ fell 10.52% in the prior quarter but as the threat of interest rate increases seemed to decline the sector posted a slight rebound, not to mention that real estate in the US continues to do well. Energy (XLE) and materials (XLB) got obliterated, falling 17.92% and 16.95%. For the year, there is a trio of double digit losers, energy is down 21.02%, materials is down 16.56% and industrials (XLI) fell 10.45%. The only sector that is up is consumer discretionary which increased by 3.98%.

For fixed income in Q3, the aggregate bond index (AGG) moved up by 1.34%. Long-dated treasuries (TLT) were the big winners, plus 5.79% but that followed a loss of 9.68% in last quarter. High-yield bonds as measured by the HYG fell 4.92%. Year to date the AGG is up 0.86%, the 7-10 year treasuries (IEF) was the sweet spot, increasing 2.90%. Preferreds were also strong (PGX), +2.71%. The HYG is down 4.13% for the year.

On the horizon…

It has been a tug of war between the bulls and the bears so far in September. The SPY is down 1.45% for the month although it was actually up as of this morning. But a good start ended in terrible fashion as the market fell 2.27% from open to high. Aside from China, the market is waiting on the Fed’s decision next week in regards to an interest rate hike.

Personally, I think a small 1/4 point hike is needed and would be a long term positive. We need to get the economy operating based on normal market forces, not artificially low rates. The job market appears strong enough to support such an increase, today’s JOLTS report shows more job openings and tight labor markets. The US economy is doing well. Savers have been starved by a zero rate policy. It is time for a slow (very slow) liftoff of rates.

But another obstacle that hasn’t been spoken about but is now on the near term horizon is the possibility of a government shutdown late this month. Certain politicians may grandstand and essentially force the government to close down.

Given the volatility in the market and the fears about China and the Fed hiking rates, a self-induced wound is something we could do without.

August Recap

August was a tough month as the market took a negative hit. The VTI (US Stock Market) fell 6.09% and the international markets as measured by the VT (ex-US) fell 6.68%. Even the bond market did not end positive as the AGG (aggregate bond index) dropped 0.34%. The VTI is now down 2.70% for the year.

Fear over slowing growth in Chain and worries about the Fed’s first interest rate increase was enough to do the market in. China’s growth, especially in the manufacturing sector, appears to be slipping fast. China also devalued their currency which shook the market.The Shanghai Composite fell 12.49% for the month and is now down 36.49% over the last three months.

The SPY had been trading in a range between 204.40 and 213 since February. That range cracked on between August 21 and August 25. The SPY hit its closing low for August on the 25th at 187.29. That is down 12.17% since the May 21 close of 213.50. That put the market in correction territory for the first time since 2011.

Despite the bad news on China, our best guess at this time is that it will not have a huge negative impact on the US economy. The US economy continues to move along nicely and China represents only about 1% of US GDP. The market was long overdue for a correction and now we have it. It would be unusual for the correction to turn into a full-fledged bear market without a recession on the horizon. However, this does not mean there cannot be some more pain in the equity markets.

July Recap

July was generally a good month unless you were primarily in energy. The SPY led the way up 2.21%, the overall US markets as measured by the VTI increased by 1.70%, world markets as measured by the VT were up 0.50% and the aggregate bond index, AGG, increased by 0.86%.

The energy sector (XLE) declined 7.69% and materials (XLB) were down by 5.04%. Consumer staples (XLP) advanced by 6.36%, utilities (XLU) 6.10%, and REITs (VNQ) were up 5.77%.

Greece dominated the headlines in the early part of the month and the SPY fell to 204.83 on July 8. But that low coincided with an agreement between the Euro countries and Greece and the markets took off from there. The SPY closed at 210.45 on the 31st. The market continues to trade in a range between 204.40 on the downside and about 213 on the upside. This range dates back to February.


SPX pullbacks versus the VIX and Put/Call ratio

Here is a good chart from Andy Nyquist that looks at recent pullbacks in the SPX and its relationship to the VIX and the put/call ratio.

vix pullback chart


We created a similar table a while back that shows pullbacks in the SPY of 5% or more since September of 2005 and what the VIX high and low was. The idea is to see at what level “panic” has set in to mark the end of the pullback.

spy v vix

As of today, the last peak in the SPY was on May 21 at 213.50 and the low was on July 8 at 204.53. That is a decline of 4.2%. During that time, the VIX has risen from 12.11 to 19.97 at the close today, a rise of 65%. In our table the average rise of the VIX has been 70.8% and the average high was 30.10, but that includes 2007 and 2008. Just looking at 2012-2014 the average decline was 7.55%, the average VIX high was 22.29 and the average percentage rise in the VIX was 65.90%.

Mid-Year Update

The SPY (SP500) was down 0.26% for the quarter but including dividends the index scraped out a total return of 0.22%. Year to date the SPY was up 1.11% including dividends. The VTI (overall US stock market) was up 1.88% and the VT (international markets x-US) was up 3.61%. The Dow Jones Industrial Average was down 1.14%. The AGG (aggregate bond market) fell by 1.07% year to date. All of these returns include dividends.

The market got hurt in the final two days of the quarter because of the fear of a default by Greece. The SPY fell by 1.91% the last two days. So the market dropped from a +3.07% to a +1.11% in the closing days.

Greece is the short-term catalyst over the near term and can push the market in either direction at this point.

The first-half of this year was the first time that both the Dow Jones Industrial Average and long-term Treasuries (-4.7%) fell during the first six-months of a pre-election year. Despite the fall in the final couple of days of the quarter, most sub-industries are still trending higher. The equity markets are high based on traditional valuation metrics on a historical basis, but when you factor in current interest rates, market valuations seem about right. In early May, when the market was higher than it is now, Warren Buffet said “the market, based on normal interest rates, is on the high side of valuation, not dangerously high but on the high side of valuation. On the other hand, if these interest rates were to continue for ten years, stocks would be extremely cheap now.” The SP500 has not had a correction of 10% in 914 days, the third-longest such period ever.

Aside from Greece, what has spooked the market is higher interest rates. The Fed has alluded to higher rates for what seems like years now but has been extremely cautious to make the move. June was supposed to be the first liftoff date, but that didn’t happen. So we are probably looking at September. Whenever it is, the Fed has made it clear that they will be very cautious when it comes to raising rates so we do not expect a rapid rise barring some kind of shock to the economic system.

But the fear of a rise in rates did hurt anything that pays a decent dividend in the last quarter. REITs and utilities got hammered. The Vanguard REIT ETF (VNQ) lost 10.52% for the quarter and the Utilities SPDR Fund (XLU) lost 5.84%. There are now some compelling values in both sectors and the reaction might have been overdone.

The economy continues to plod ahead on a slow but somewhat steady course. That is the case in the US and around the globe. Ex-Greece, Europe is doing well. 88% of Eurozone countries report PMI readings above 50. PMI stands for purchasing managers index and is an indicator of the economic health of the manufacturing sector. A PMI of more than 50 would represent an improvement over the previous month. Japan and India also improved while China was less than 50 but the rate of contraction has slowed there. The United States reported 53.6.

A correction is long overdue and can happen at any time, but we do not see such a correction leading to a bear market. We are cautiously optimistic on the equity markets at this time.

Tribute to Jim Grant

Here is a tribute to Jim Grant of Grant’s Interest Rate Observer. Jim recently received the 2015 Loeb Lifetime Achievement Award. Jim is a giant in financial journalism and it is a pleasure to read his publication.

https://vimeo.com/chrisderrico/review/131241569/0f1bbc32bc