
Mark Hulbert writes in Barron’s that “the best bear-market strategy may very well be to stay 100% invested in equities.” He draws this conclusion based on the long-term performance of advisors he follows on this Hulbert Financial Digest.
Author Archives: admin
An explanation of the Fed Rate hike and its impact
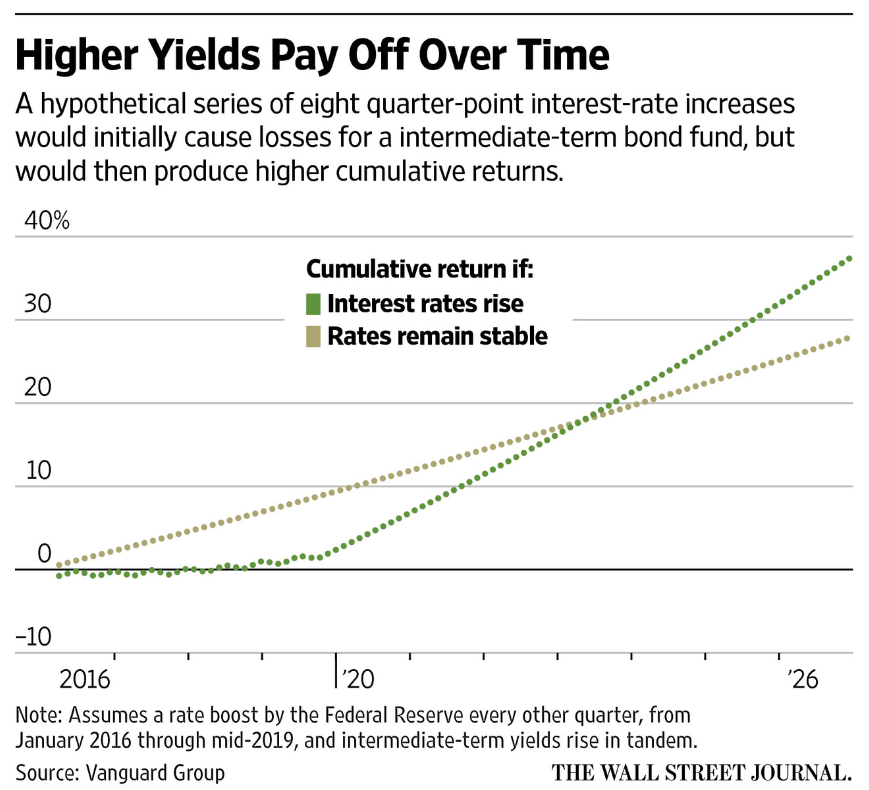
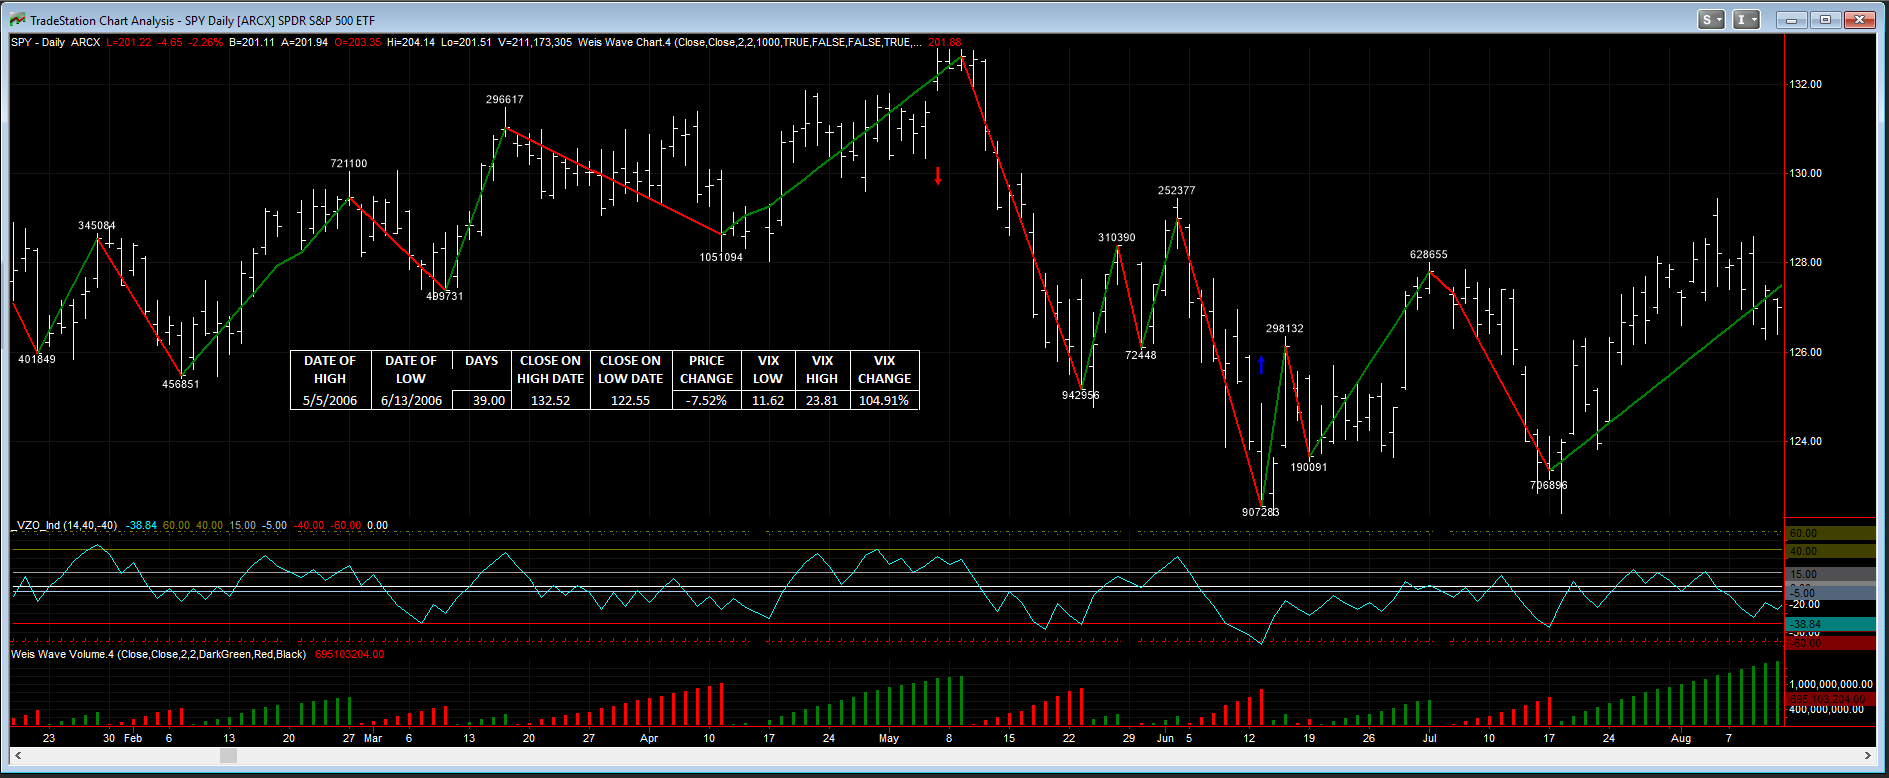
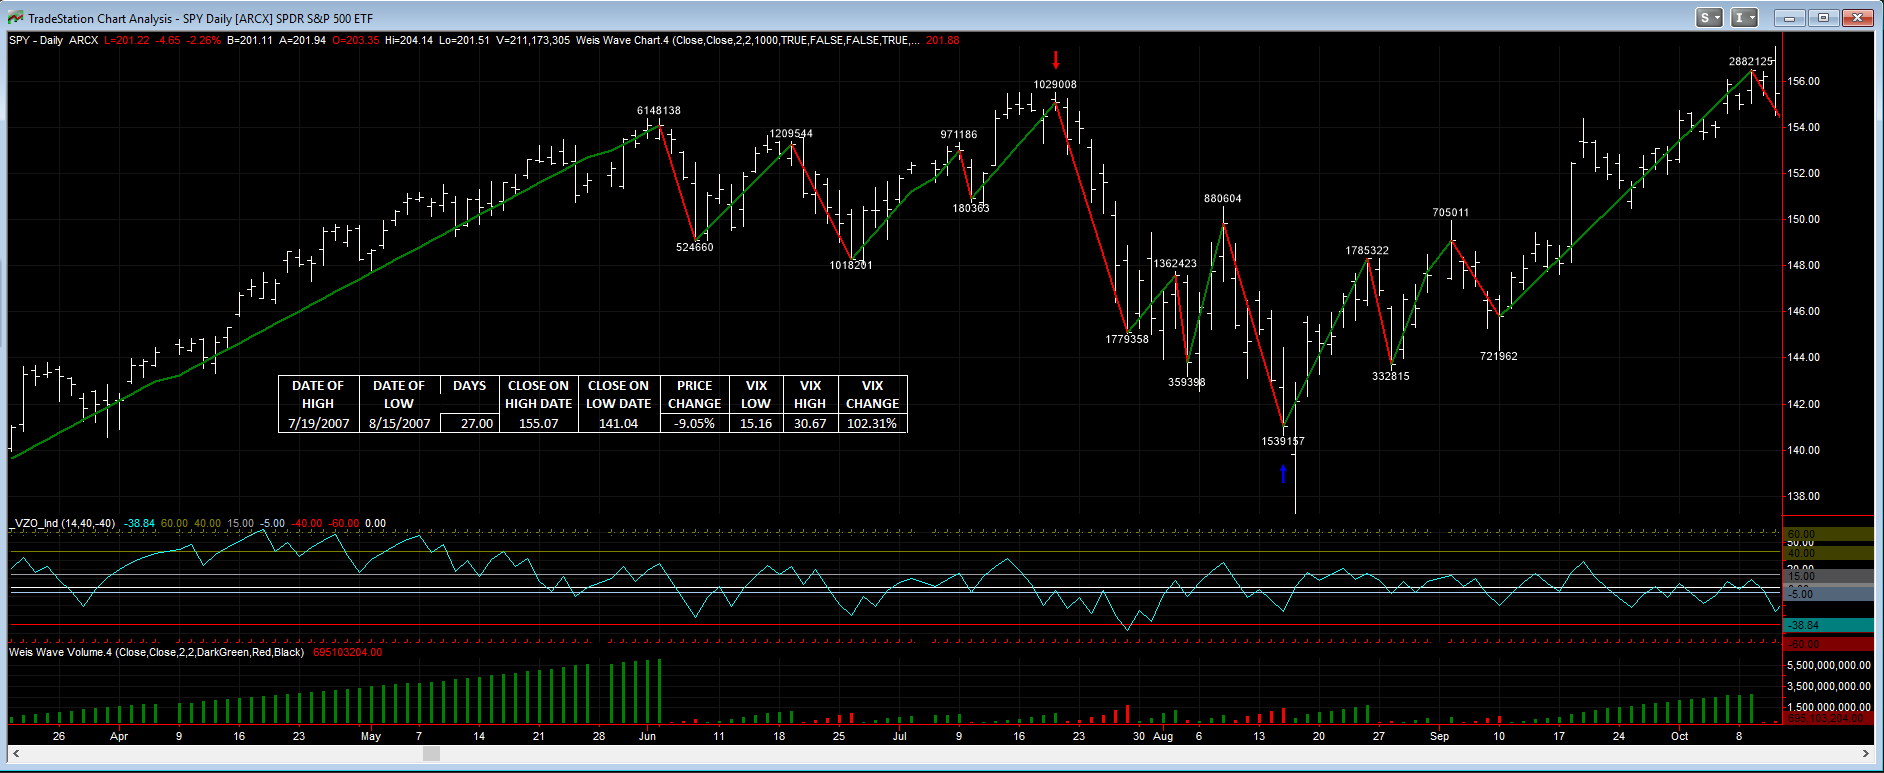
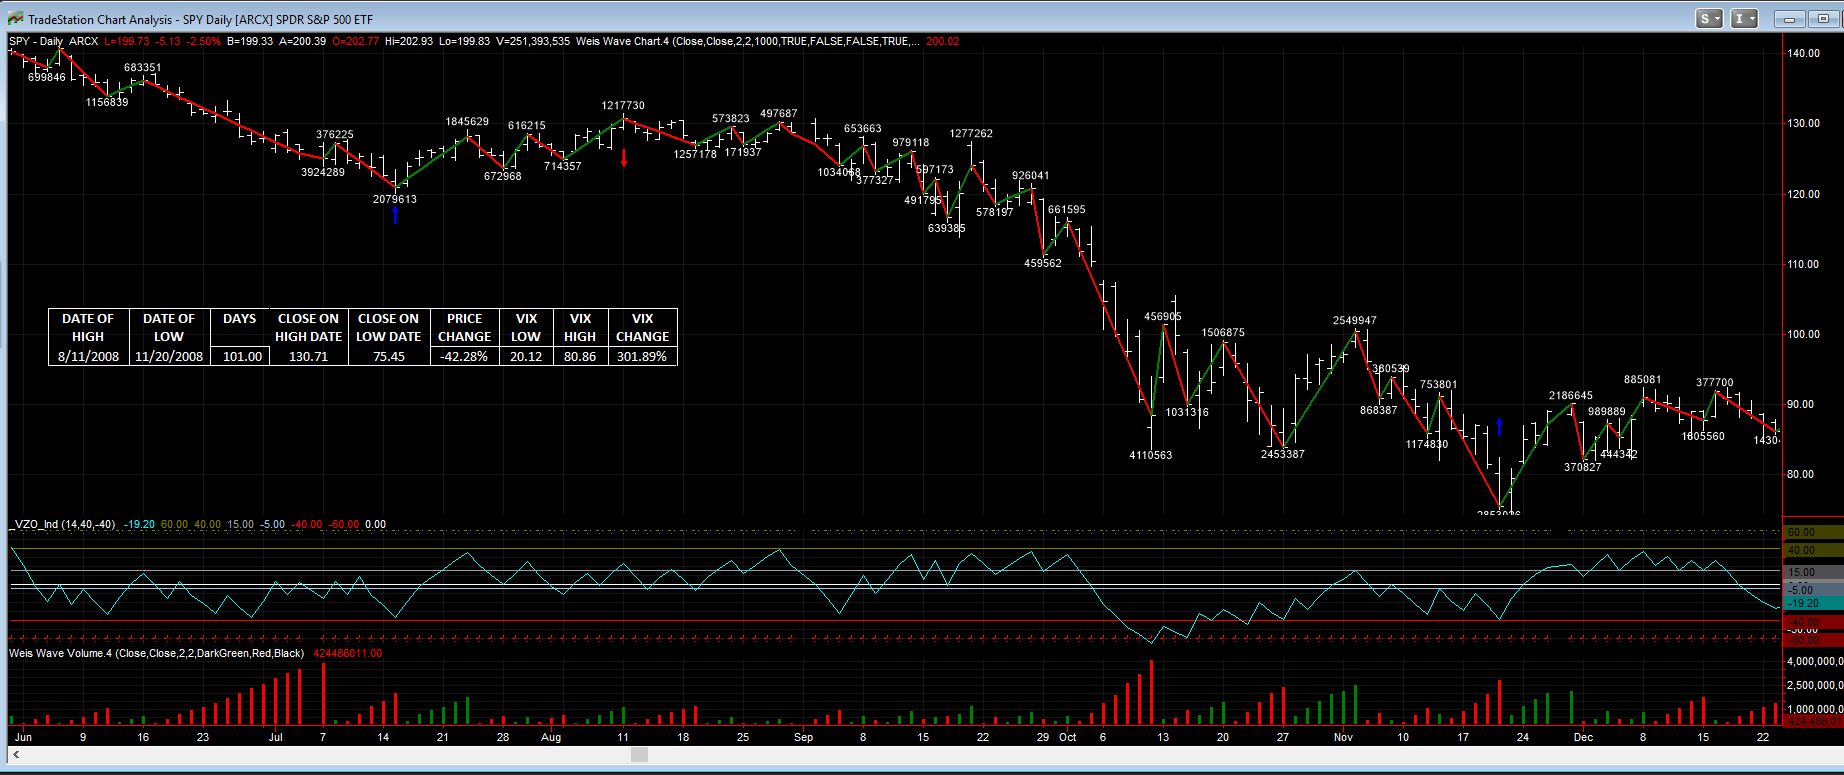
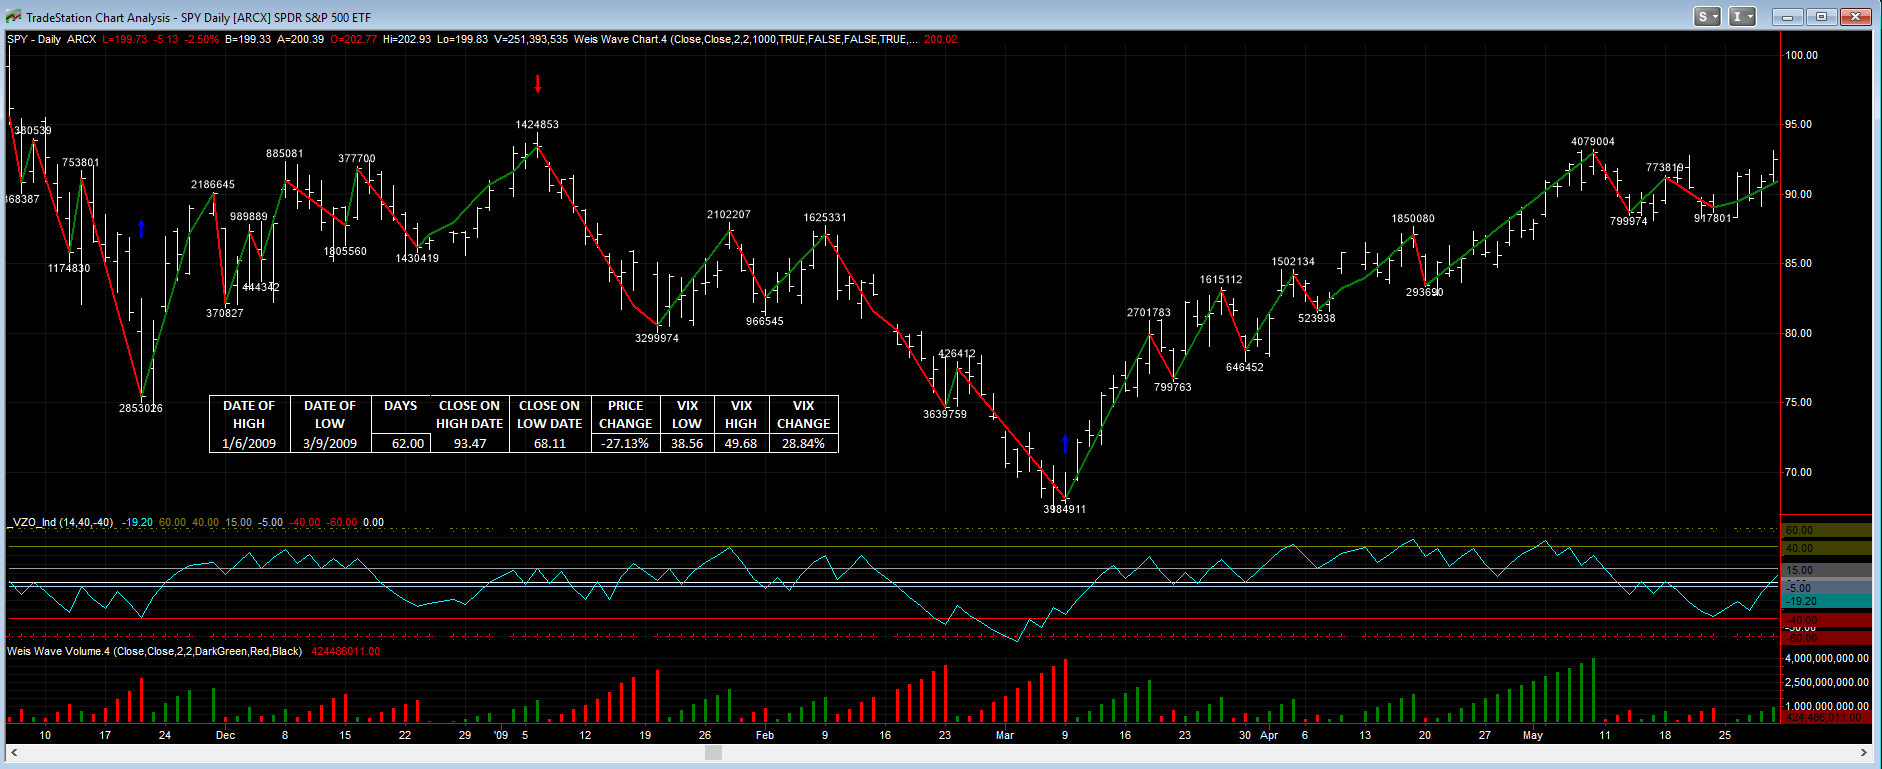
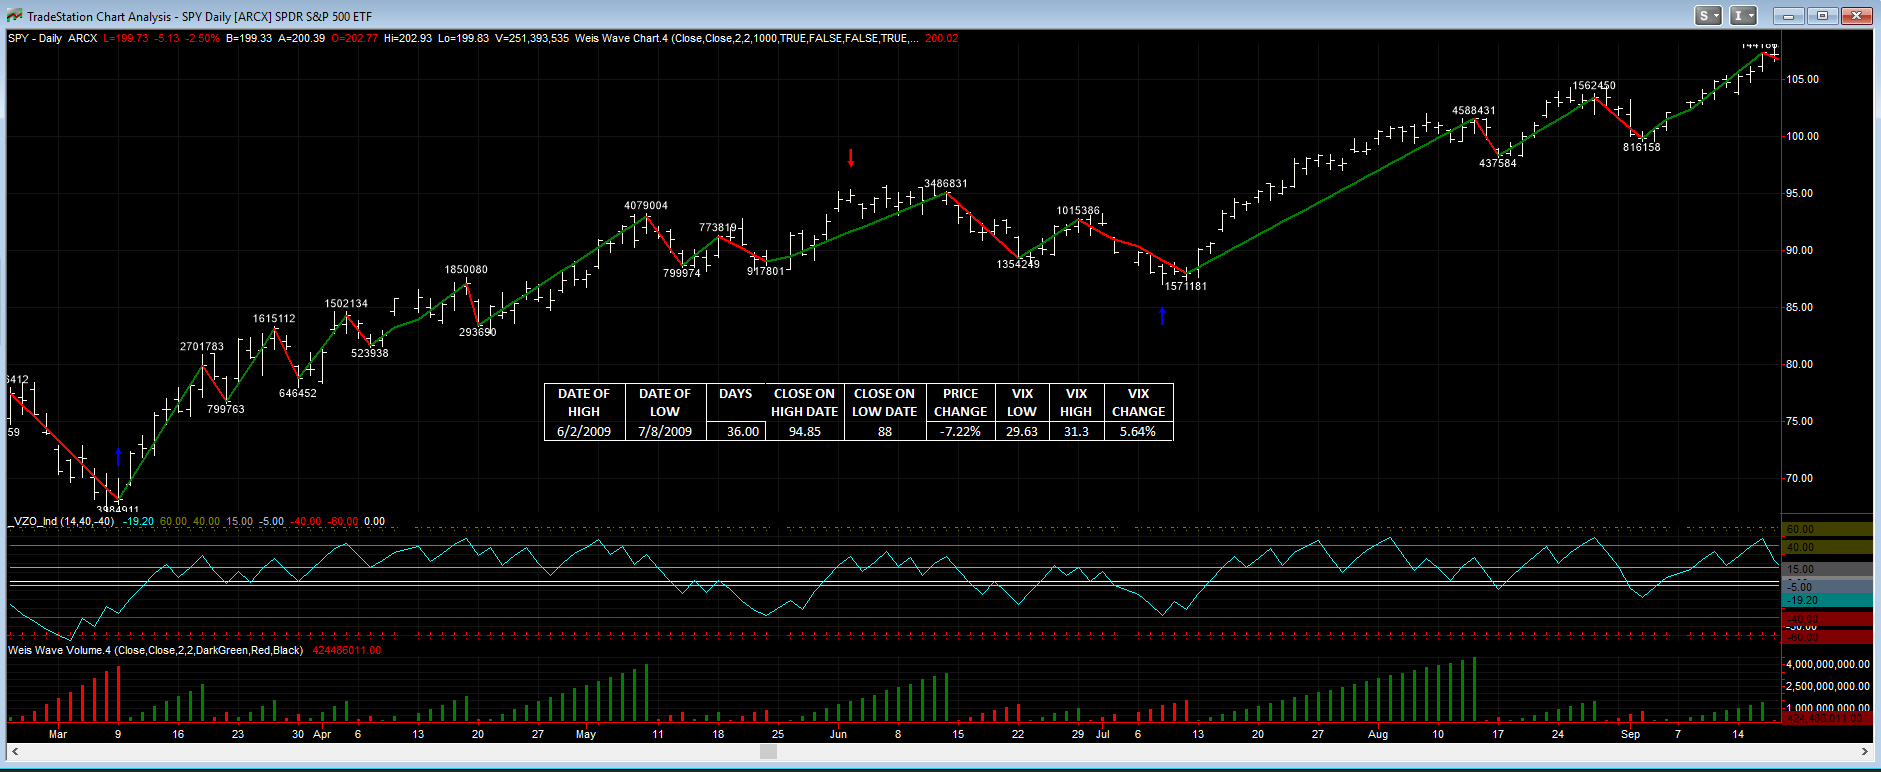
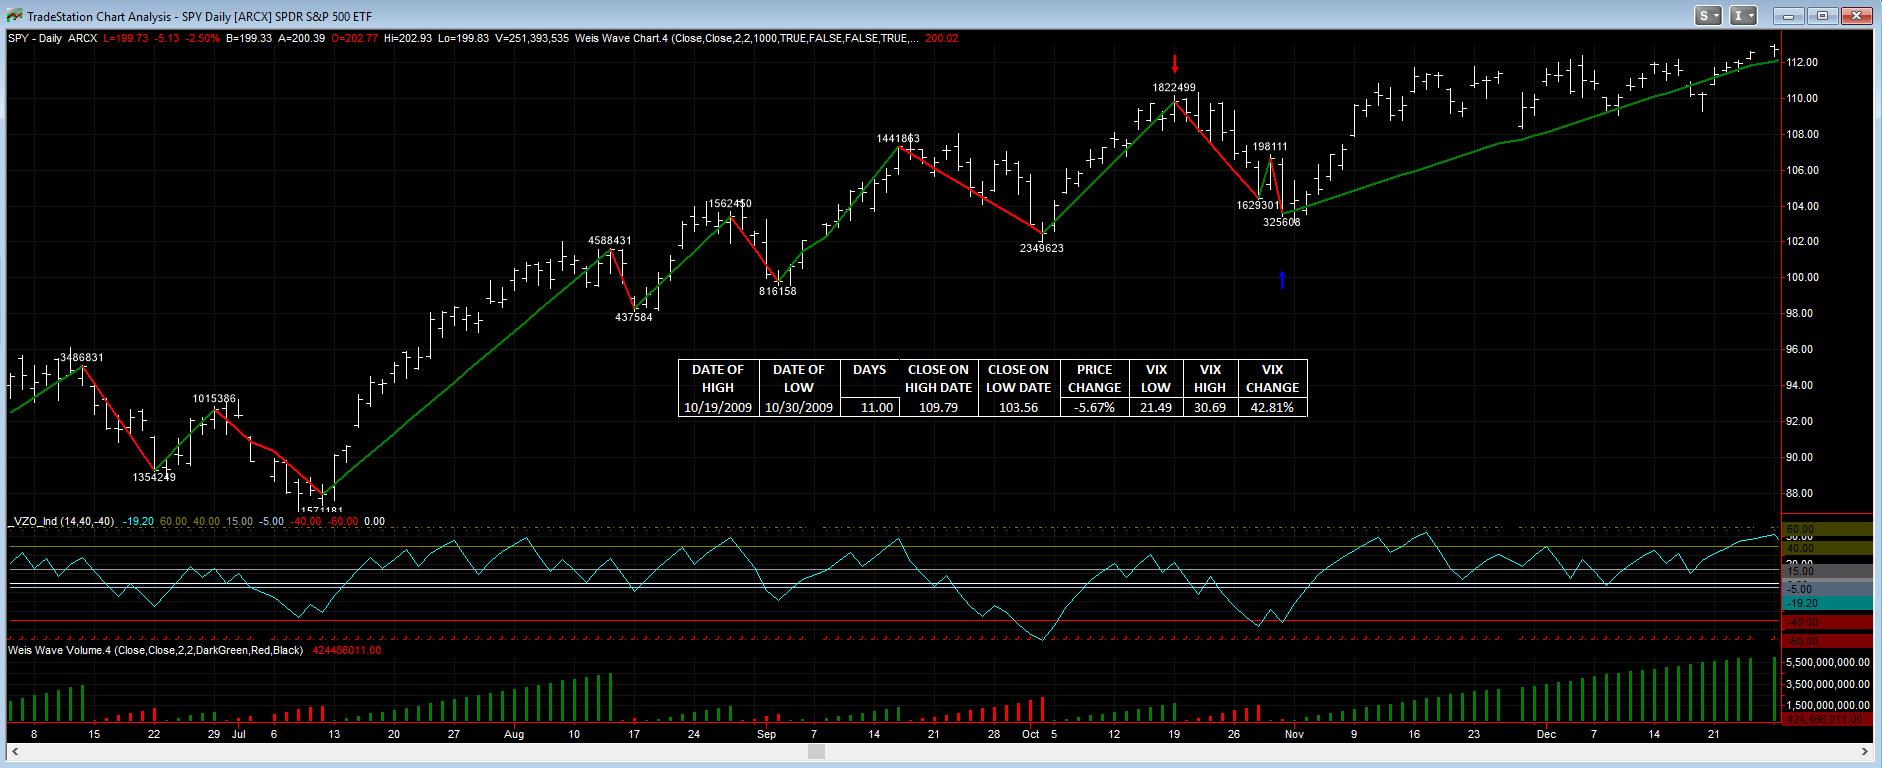
A Look Back at Corrections/Pullbacks
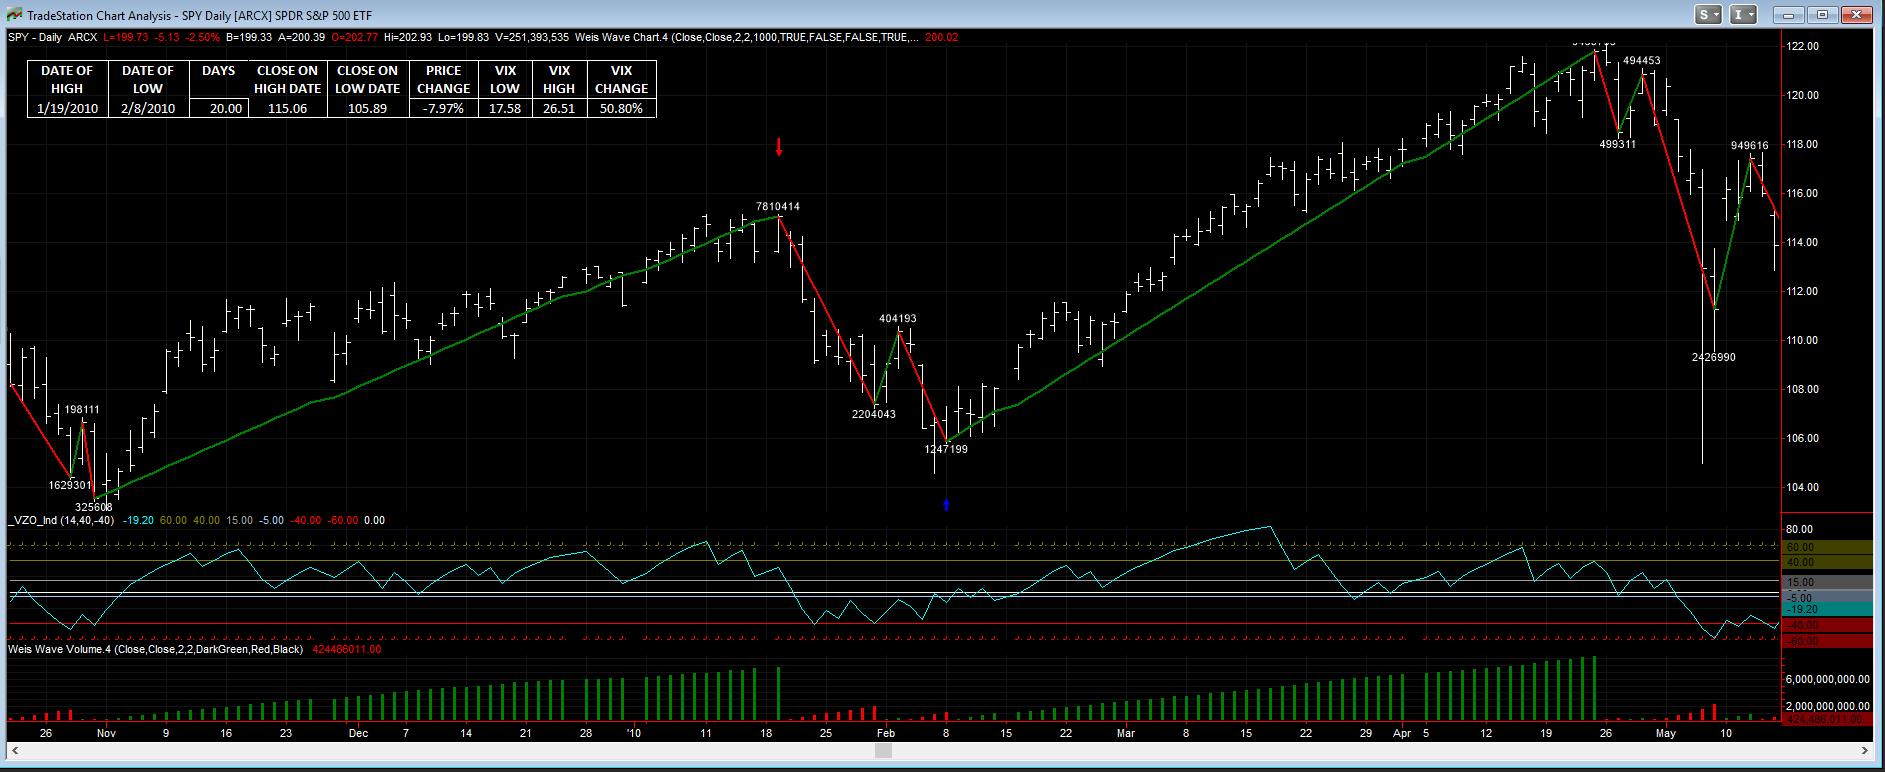
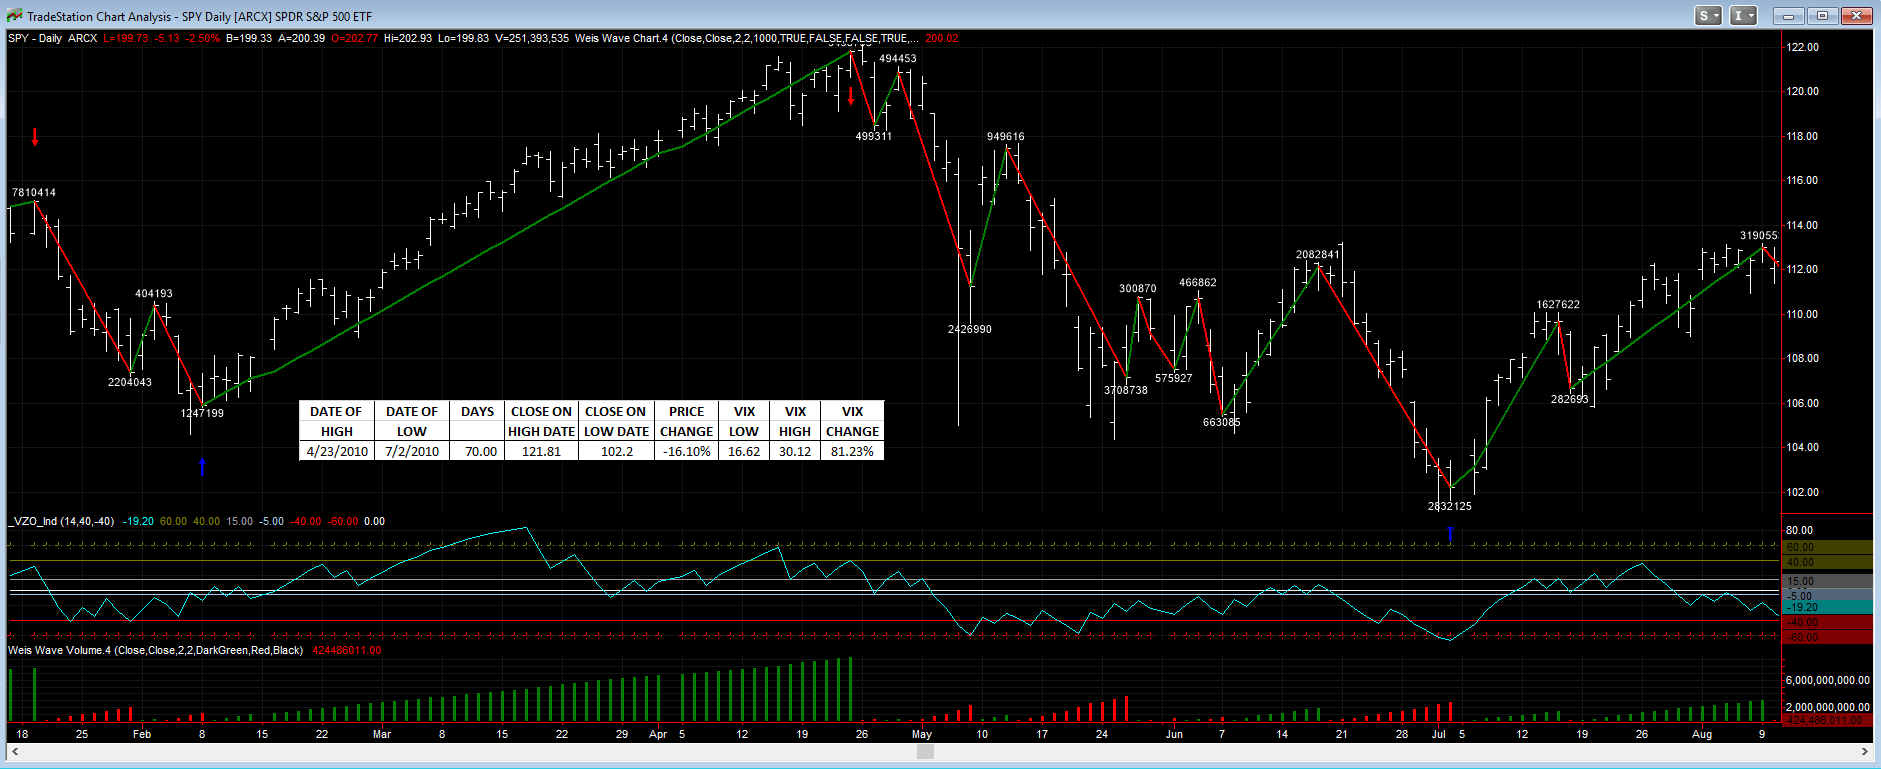
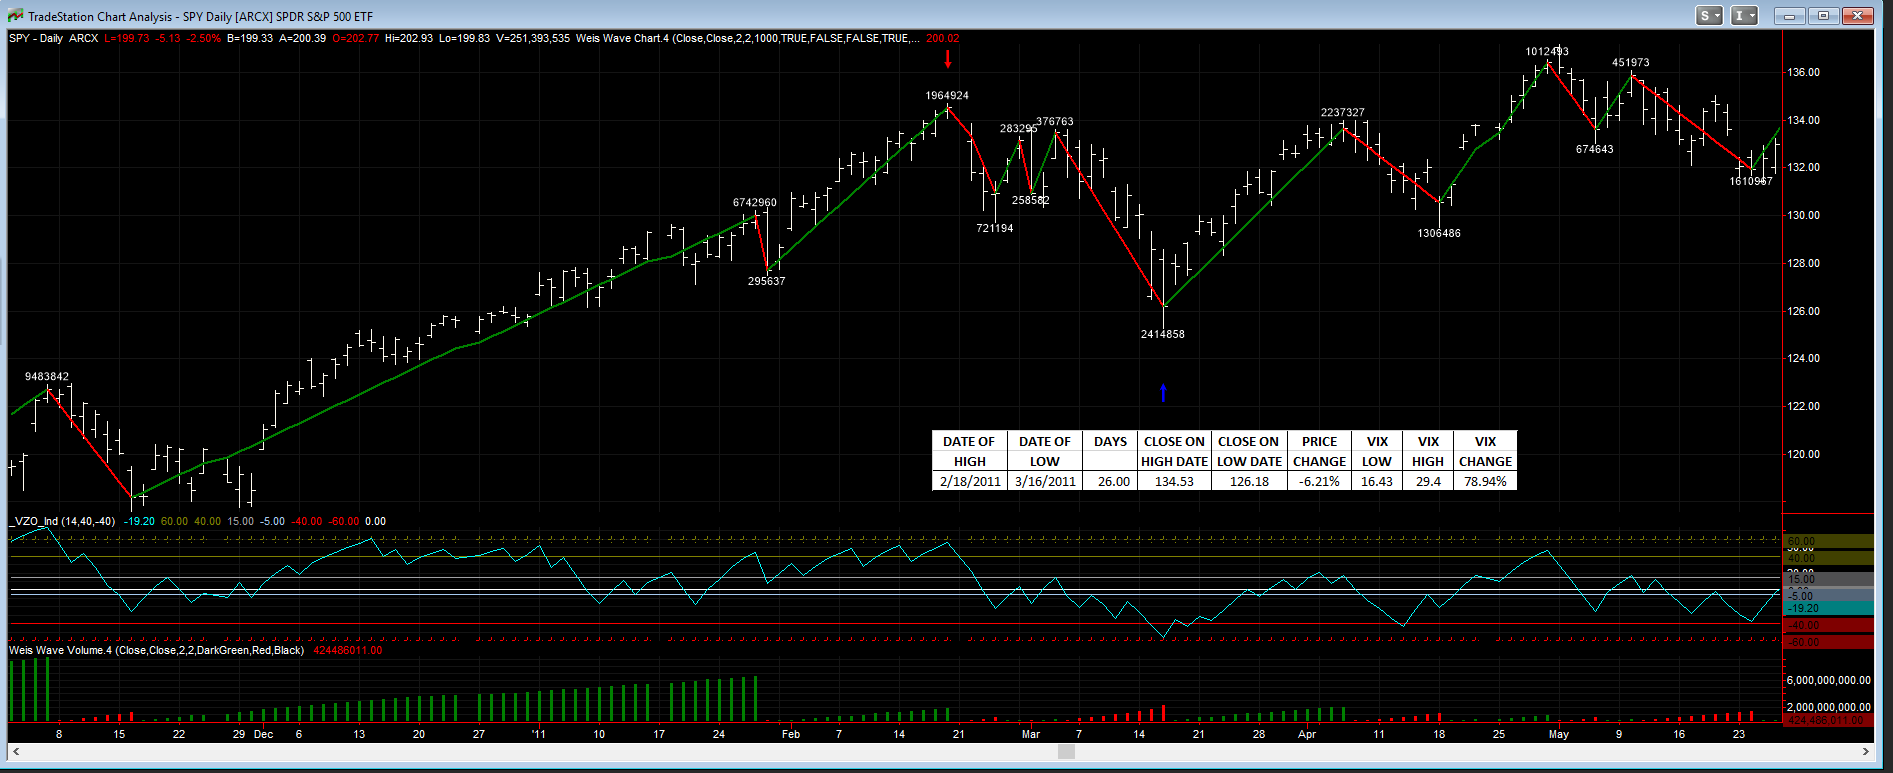
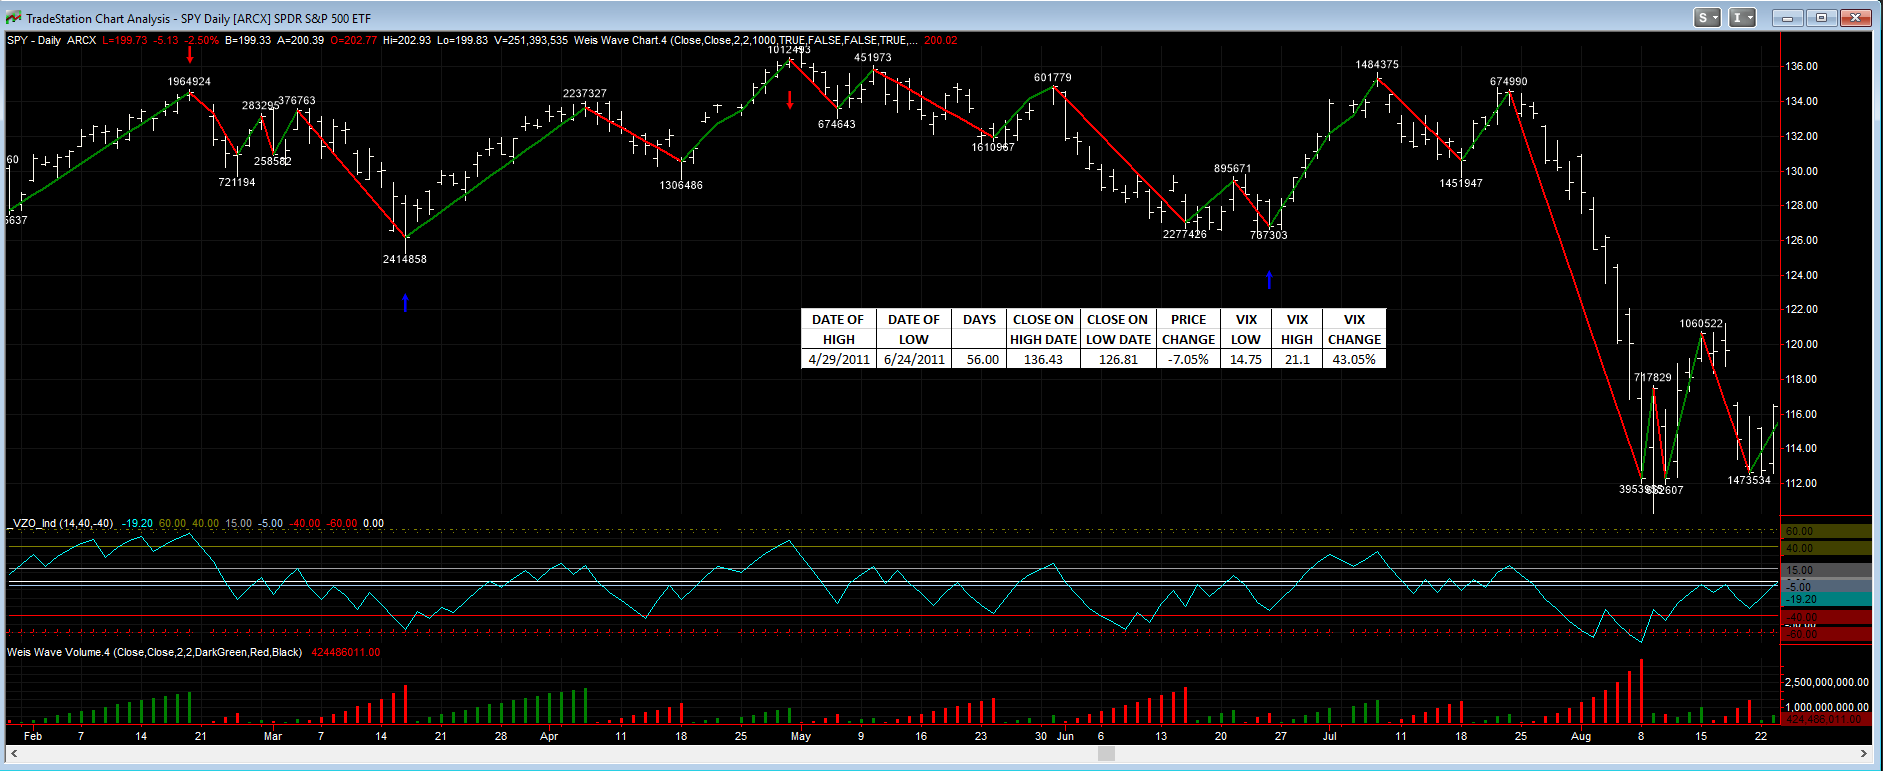
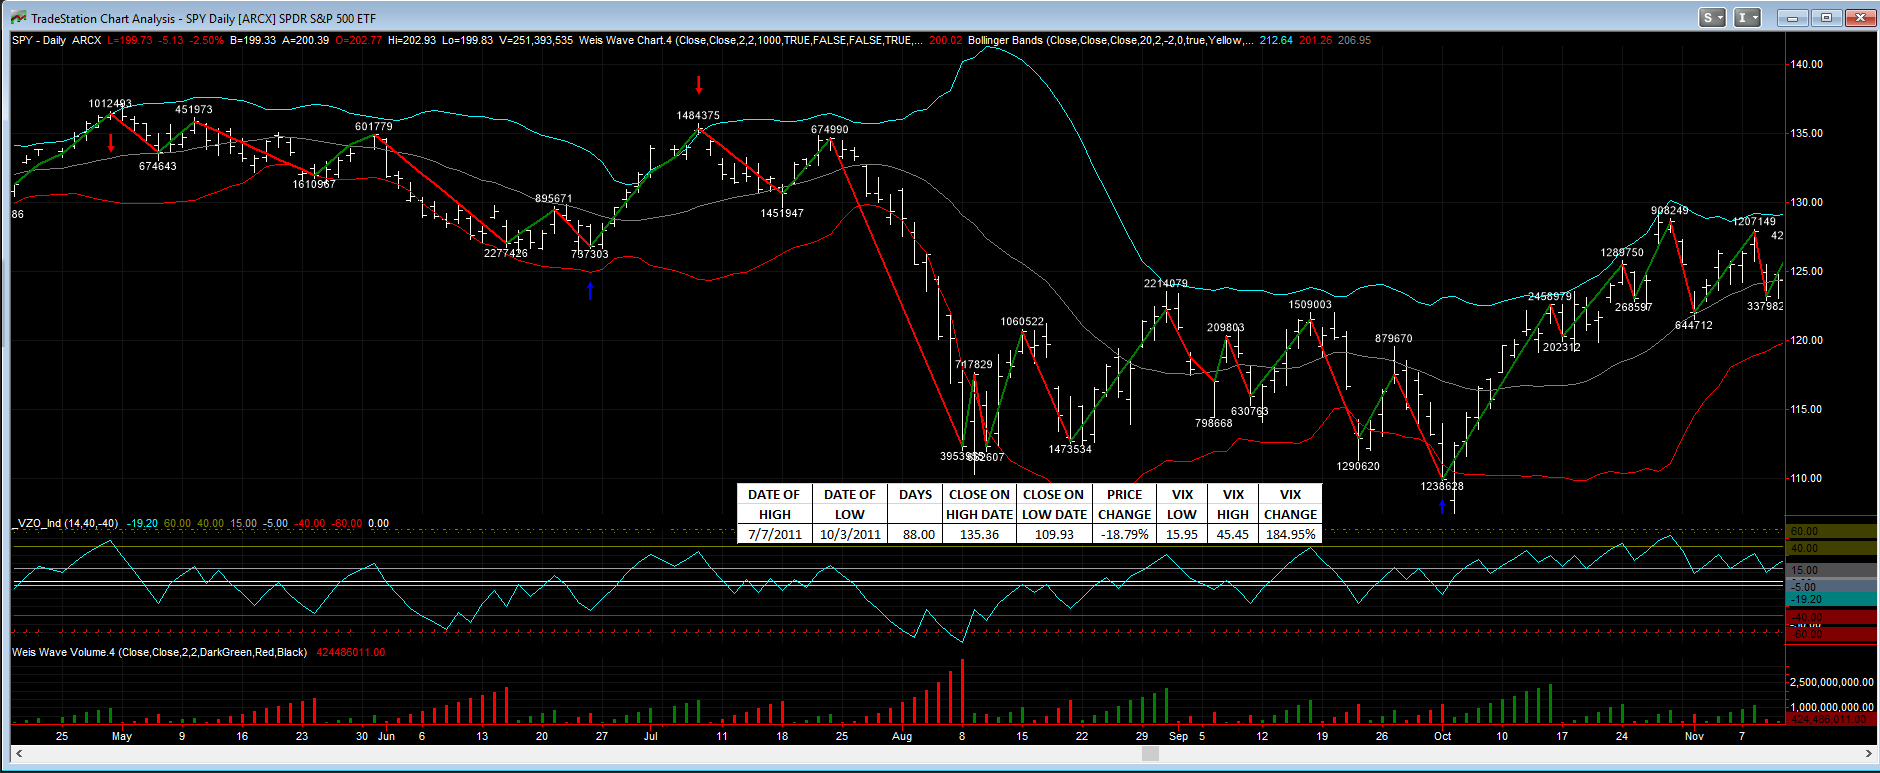
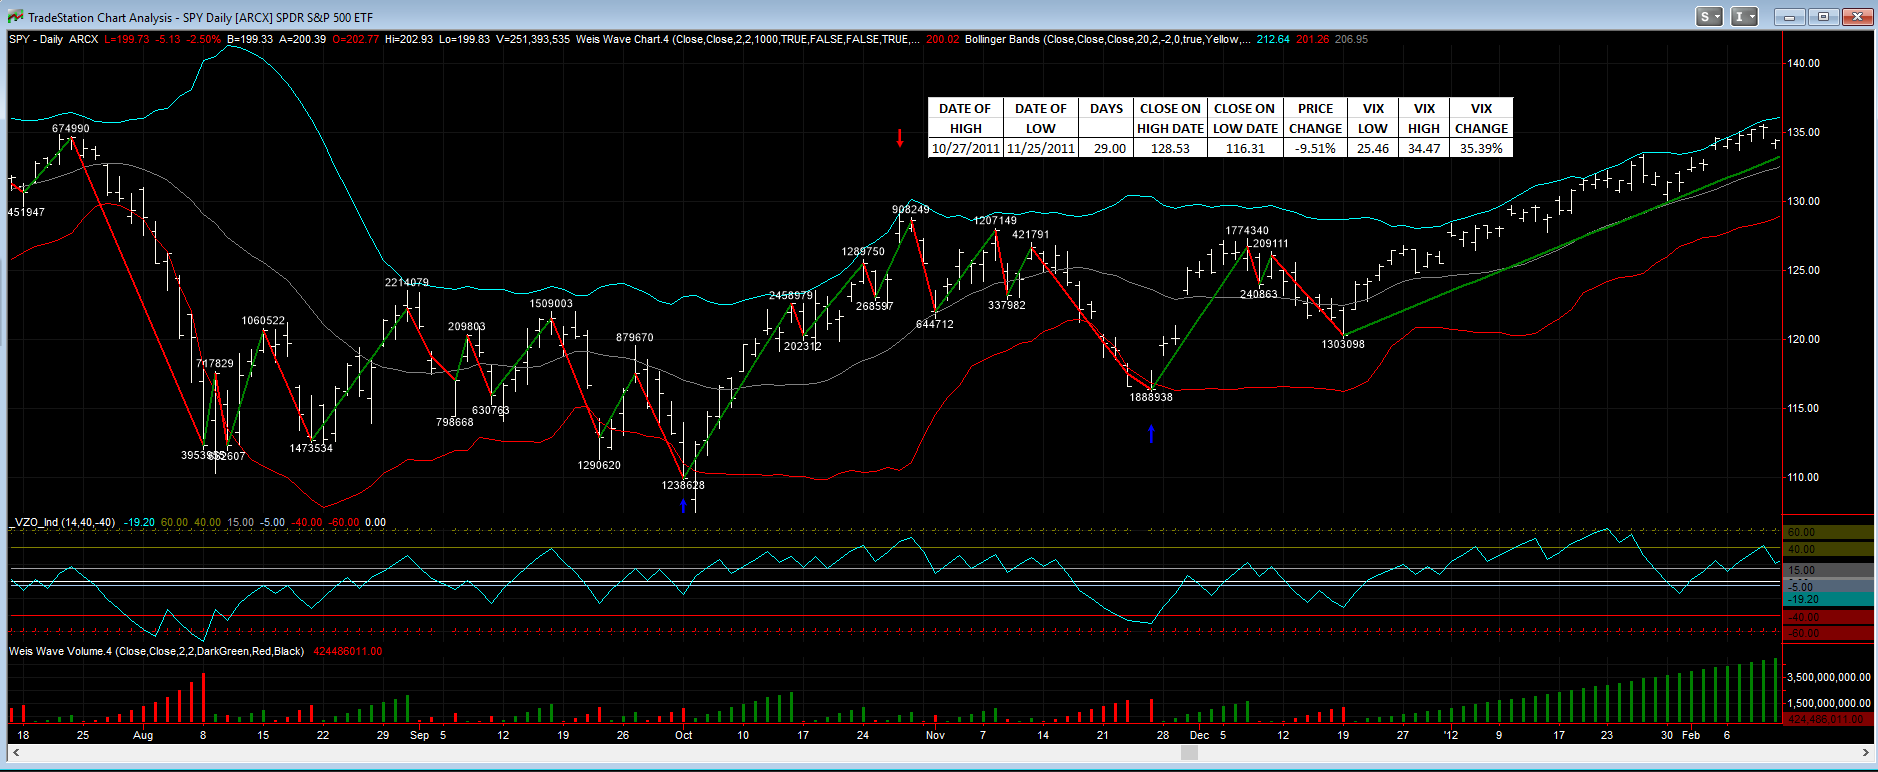
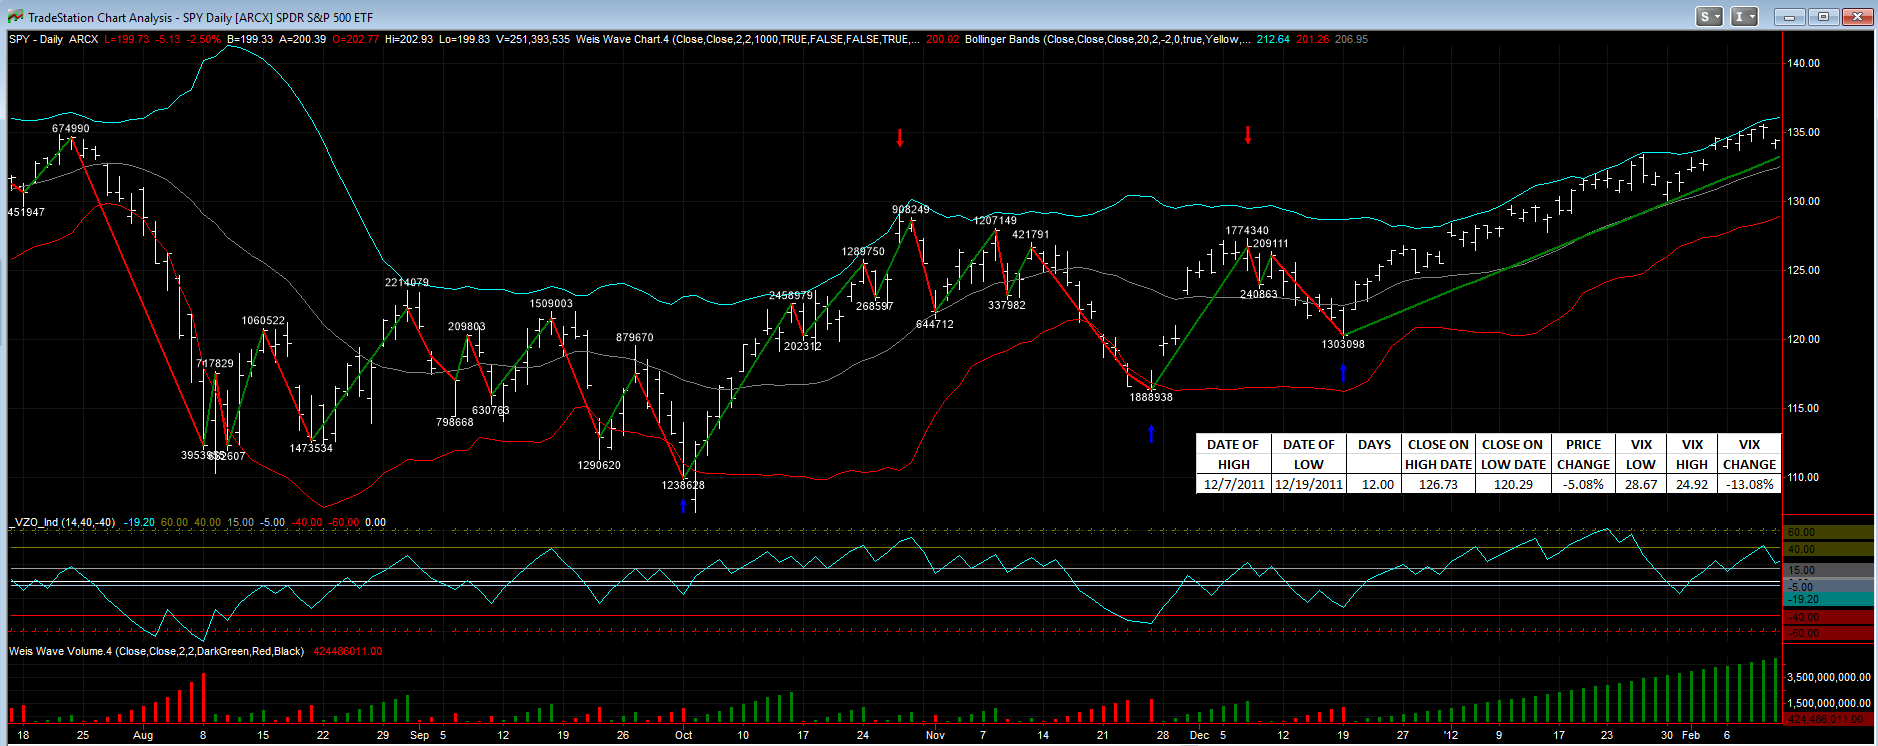
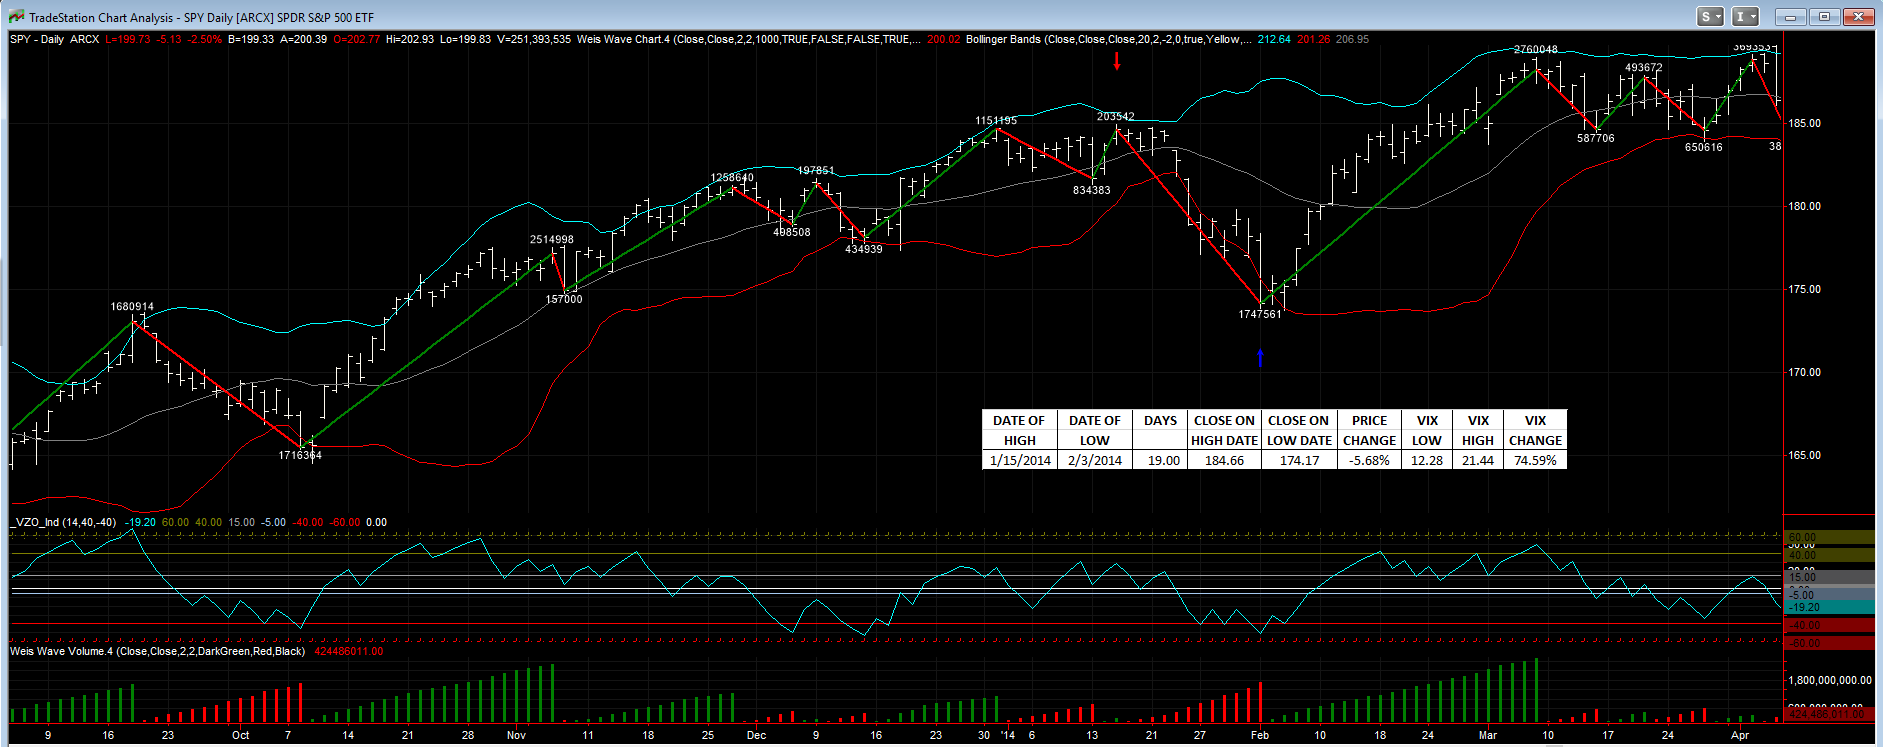
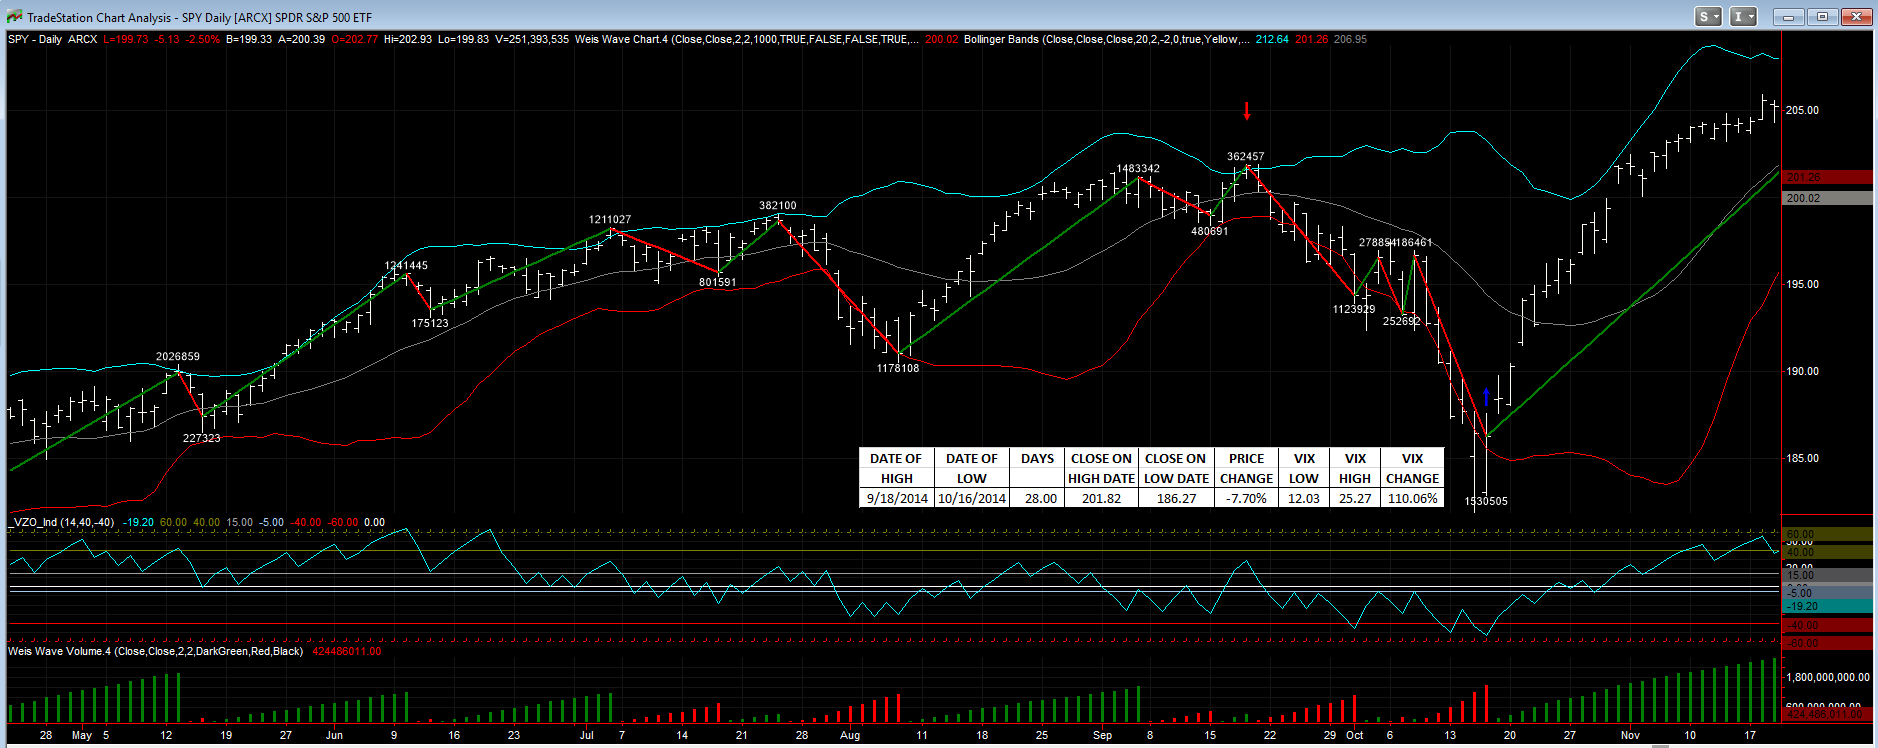
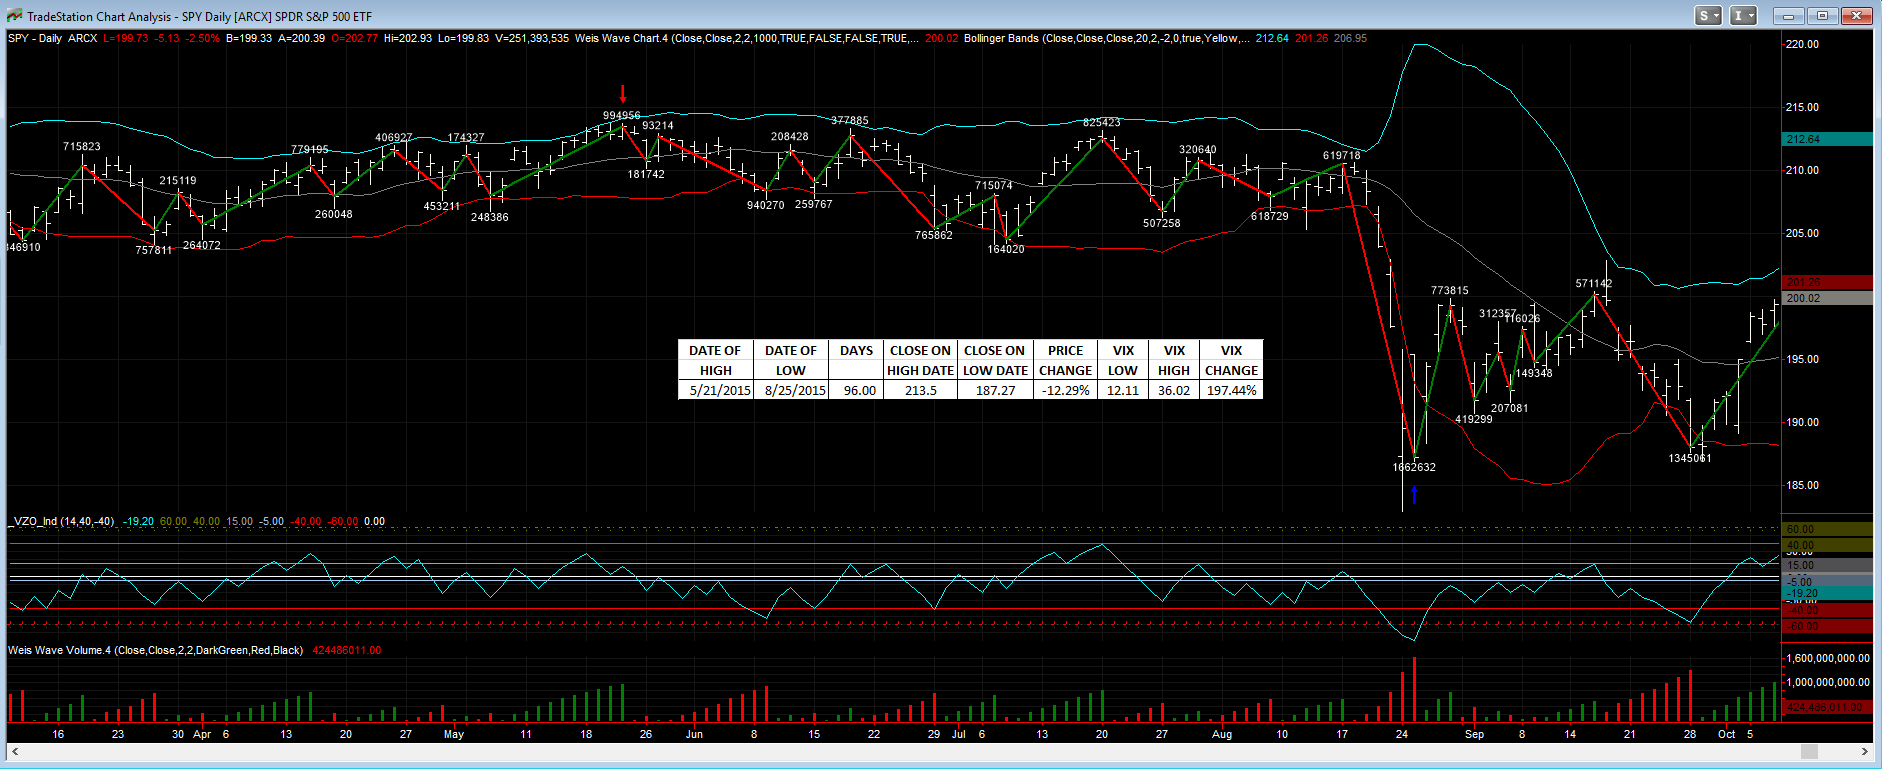
The market is down about 9% from its recent high on 11/3/2015. So we are bordering on a correction, normally defined as a drop of 10% or more. This is not the first correction and it won’t be the last. Here is a look back at pullbacks and corrections since the summer of 2005.
| DATE OF | DATE OF | DAYS | CLOSE ON | CLOSE ON | PRICE | VIX | VIX | VIX |
| HIGH | LOW | HIGH DATE | LOW DATE | CHANGE | LOW | HIGH | CHANGE | |
| 9/9/2005 | 10/13/2005 | 34.00 | 124.60 | 117.43 | -5.75% | 13.5 | 16.47 | 22.00% |
| 5/5/2006 | 6/13/2006 | 39.00 | 132.52 | 122.55 | -7.52% | 11.62 | 23.81 | 104.91% |
| 2/20/2007 | 3/5/2007 | 13.00 | 146.04 | 137.35 | -5.95% | 10.24 | 19.63 | 91.70% |
| 7/19/2007 | 8/15/2007 | 27.00 | 155.07 | 141.04 | -9.05% | 15.16 | 30.67 | 102.31% |
| 10/9/2007 | 11/26/2007 | 48.00 | 156.48 | 140.95 | -9.92% | 18.88 | 28.91 | 53.13% |
| 12/10/2007 | 1/22/2008 | 43.00 | 152.08 | 131.54 | -13.51% | 20.74 | 31.01 | 49.52% |
| 5/19/2008 | 7/15/2008 | 57.00 | 143.05 | 120.99 | -15.42% | 17.01 | 28.54 | 67.78% |
| 8/11/2008 | 11/20/2008 | 101.00 | 130.71 | 75.45 | -42.28% | 20.12 | 80.86 | 301.89% |
| 1/6/2009 | 3/9/2009 | 62.00 | 93.47 | 68.11 | -27.13% | 38.56 | 49.68 | 28.84% |
| 6/2/2009 | 7/8/2009 | 36.00 | 94.85 | 88.00 | -7.22% | 29.63 | 31.3 | 5.64% |
| 10/19/2009 | 10/30/2009 | 11.00 | 109.79 | 103.56 | -5.67% | 21.49 | 30.69 | 42.81% |
| 1/19/2010 | 2/8/2010 | 20.00 | 115.06 | 105.89 | -7.97% | 17.58 | 26.51 | 50.80% |
| 4/23/2010 | 7/2/2010 | 70.00 | 121.81 | 102.20 | -16.10% | 16.62 | 30.12 | 81.23% |
| 8/9/2010 | 8/26/2010 | 17.00 | 112.99 | 105.23 | -6.87% | 22.14 | 27.37 | 23.62% |
| 2/18/2011 | 3/16/2011 | 26.00 | 134.53 | 126.18 | -6.21% | 16.43 | 29.4 | 78.94% |
| 4/29/2011 | 6/24/2011 | 56.00 | 136.43 | 126.81 | -7.05% | 14.75 | 21.1 | 43.05% |
| 7/7/2011 | 10/3/2011 | 88.00 | 135.36 | 109.93 | -18.79% | 15.95 | 45.45 | 184.95% |
| 10/27/2011 | 11/25/2011 | 29.00 | 128.53 | 116.31 | -9.51% | 25.46 | 34.47 | 35.39% |
| 12/7/2011 | 12/19/2011 | 12.00 | 126.73 | 120.29 | -5.08% | 28.67 | 24.92 | -13.08% |
| 4/2/2012 | 6/4/2012 | 63.00 | 141.84 | 128.10 | -9.69% | 15.64 | 26.66 | 70.46% |
| 9/14/2012 | 11/15/2012 | 62.00 | 147.24 | 135.70 | -7.84% | 14.51 | 17.99 | 23.98% |
| 5/21/2013 | 6/24/2013 | 34.00 | 167.17 | 155.73 | -6.84% | 13.37 | 20.11 | 50.41% |
| 1/15/2014 | 2/3/2014 | 19.00 | 184.66 | 174.17 | -5.68% | 12.28 | 21.44 | 74.59% |
| 9/18/2014 | 10/16/2014 | 28.00 | 201.82 | 186.27 | -7.70% | 12.03 | 25.27 | 110.06% |
| 5/21/2015 | 8/25/2015 | 96.00 | 213.50 | 187.27 | -12.29% | 12.11 | 36.02 | 197.44% |
| 11/3/2015* | 1/8/2016 | 66.00 | 211.00 | 191.92 | -9.04% | 14.54 | 26.39 | 81.50% |
*The correction that started on 11/3/2015 is still in progress.
SEC adopts new Crowdfunding regulations
On October 30, 2015, after three and a half years of proposals, comments, and discussion, the Securities and Exchange Commission (SEC) announced its final rules on equity crowdfunding for small businesses. The forms that funding portals use to register with the SEC become effective on January 29, 2016, while the final regulations take effect on May 16, 2016.
Small businesses considering this new financing alternative will want to review the new regulations carefully.
Recap for December/Q4/2015
Major market indexes finished just about flat in 2015, but that disguised some pain as many stocks and sub-indexes were in the red for the year. The SPY was the star performer, up 1.27% for the year (including dividends), the overall US market (VTI) gained 0.36%, and international markets (x-US) lost 4.20%. The aggregate bond index (AGG) managed a gain of 0.48%.
For Q4, the SPY advanced 7.02%, VTI 6.24%, VXUS 2.57%. The bond index (AGG) fell 0.51% as the Fed raised interest rates in December. However, the year did not end on a good note despite the positive Q4 returns for equities. For December, the SPY dropped 1.73%, VTI -2.13%, VXUS -2.18% and the AGG -0.19%.
The market topped out on May 21, and then suffered a 12.29% correction that ended on August 25. The market rallied from there but did fall 5.2% between November 13 and December 20th.
Underneath the positive SPY and VTI numbers, most equities were down. Take out eight large-cap out performers like MSFT, AMZN, FB and GOOGL/GOOG, and the SP500 would have down by 4% according to Jessica Binder Graham of Goldman Sachs.
For the year, the midcaps (VO) fell 1.35%. Small-caps as measured by the IWM fell 4.46%. Dividend growers fell (VIG) 1.92%. Emerging markets (VWO) were down 15.82%. The big winner was large cap growth as measured by the QQQ, up 9.43%. Materials (XLB) were down 8.65% and energy (XLE) was down 21.47%. Consumer discretionary (XLY) was up 9.93%.
Market Timing is Back in the Hunt
An article in Institutional Investor, written by researchers at AQR, suggests that small adjustments from market timing signals, as opposed to binary (all in or out) decisions, might help performance. Click for the article.
What Happens to Your Bond Fund When Interest Rates Rise
November Recap
The market etched out a gain in November. The overall US market as measured by the VTI gained 0.63%. The SPY was up 0.39%. International x-US (VXUS) dropped 1.32% and the aggregate bond index (AGG) fell 0.42%. The treasury curve flattened slightly. The 2 and 5-year notes were up by 19 and 13 basis points while the 10 and 30 year both increased by 5 basis points.
The financial sector (XLF) was the big winner, plus 1.99%. Higher anticipated interest rates was the driver. On the flip side, utilities dropped 2.13% for the same reason. Commodities took a major tumble. Gold (GLD) was down 6.75%, silver (SLV) down 9.19%, oil (USO) down 12.69% and agriculture (DBA) down 3.62%. Commodities were hurt by more weak economic news from China. Imports fell 19% there.
During November it became clear that the Fed will hike rates in December. Strong job numbers are too favorable to ignore. October payroll was up 271,000 versus an estimated 185,000. The unemployment rate dropped to an even 5.00%. Average earnings were also up.
The anticipated interest rate hike dropped the SP500 3.6% for the week ending 11/13. But it rallied the following week when minutes released by the Fed made clear that the pace of interest rate increases would be slow.
Terrorism tried to interfere with the markets with a brutal attack in Paris by ISIS on Friday night, the 13th. But the market shrugged that off with a 1.5% gain on the following Monday. Later in the month, Turkey shot down a Russian jet. Another indication that the world is becoming a more dangerous place.
October Recap
Score one for bulls. There was lots of fear that the market was headed for tumble coming out of September, but October turned into a positive run as the VTI (US market) advanced 7.88%, the SPY (SP500) +8.50% and the VT (international x-US) +6.86%. The SP500 is now back into the middle of the range it held from February until August. However, a good portion of the advance is made up of a smaller list of higher cap “momentum” stocks such as AMZN, GOOGL and FB. If you look at the overall US market (VTI), it is just cracking the bottom of its range. This lack of equal participation may be a warning signal that we moved to far too fast.
The AGG (aggregate bond index) finished a few basis points above breakeven at +0.07%. Treasury rates were up slightly, the 2-year +11 basis points, 5-year +15, 1-year +11 and the 30-year +8.
Credit spreads narrowed during the month, lowering fears that the bond market might be on to something much worse, and providing fuel for M&A. The ECB indicated it might purchase more bonds, lower interest rates in China, and indications that China is in for a softer landing, all helped the markets.
This week the Fed talked tough and indicated there was a good likelihood for a December rate increase. Economic conditions remain similar to September, when it seemed like the Fed would never raise interest rates. But a slightly better outlook from China and a strong market might be pushing the Fed to a more aggressive stance. We will see if they follow through.
Turnaround Friday
Friday turned into a dramatic day. Whether it turns out to be a marker for the end of this correction time will tell. The futures opened higher but when the 8:30 unemployment report came out the market plunged. The report was a huge disappointment and included lower revised numbers for July and August also. The market was down 2.2% at one point. But then it all turned around and the market just kept rising. The SPY closed up 1.49% on the day at an even 195. The SPY now sits on a resistance line that has marked about 12 other high, low or closes in the last 28 days.
The market has had the chance to move lower on each of the first three days in October, but has now closed at or very close to the high on all three occasions. Another positive is that the market normally performs well in the final quarter of the year. We will see if there is any carry through this week.