Elliot’s Paul Singer on how the financial world will end, or almost end.

Elliot’s Paul Singer on how the financial world will end, or almost end.
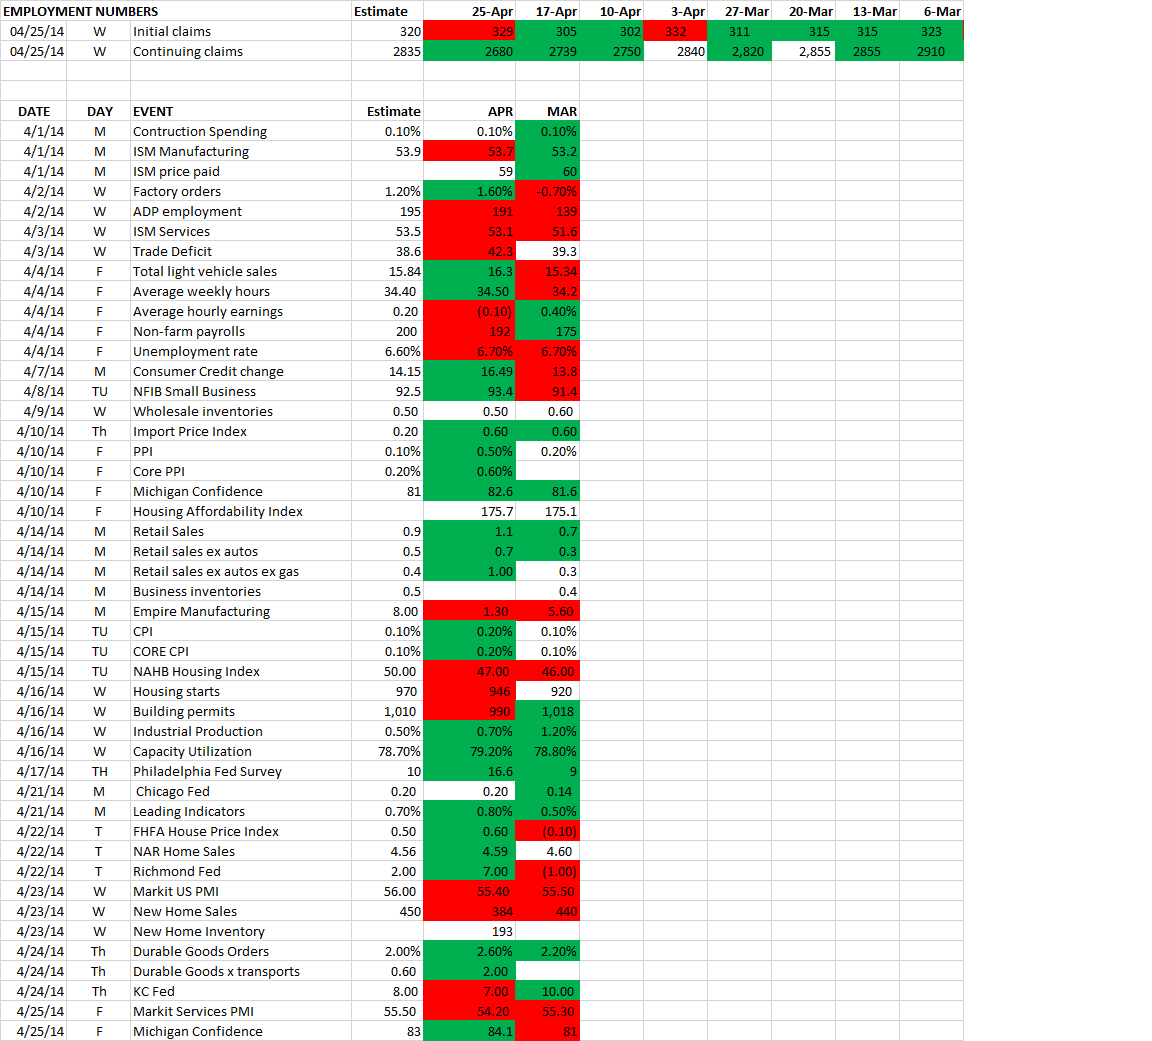
The economy continues to move along and for the most part, slightly better than expected. Stats highlighted in green indicate a better than expected number. Below are the April numbers.
Notes from this week’s Barron’s.
WHY AIG COULD DOUBLE IN FIVE YEARS
World’s largest insurer by stock market value. Operations in property and casualty, life insurance, annuities and mortgage guaranty. Combined ratio last year was 101.3% down from 108.5%. Expecting 100.3% this year and 98.9% next year. Josh Stirling of Sanford Bernstein is looking for 93% next year and 90% within five years.
Shifting to property policies from casualty which helps with pricing discipline. More like BRKA.
With company priced less than book repurchases might be an option as cash becomes available. Book value is $69 now, stock is priced about $52, and BV could get to $80 in five years.
ASSESSING PFIZER’S FUTURE
Low p/e, 3.4% dividend and a decent pipeline. P/E less than 14x projected 2014 EPS, half the p/e of BMY. Company might split three ways in 2017. $7b in dividends and $5b in buybacks this year.
BIG MONEY POLL
1. 56% Big Money respondents call themselves bullish or very bullish on US stocks, down from 68% six months ago.
2. 35% are neutral, up from 24% six months ago and 19% one year ago.
3. 73% says market is fully valued, 18% say it is overvalued.
4. Big Money bulls see the Dow hitting 17,418 by year-end and 18.072 by June 30, 2015. SP500 to 2063 by mid-2015 and NASDAQ to 4855 by mid-2015.
5. 60% say US will be best market, 23% think Europe and 14% like emerging markets.
6. 66% are bearish on Gold.
7. 90% are bearish on US Treasuries and 80% on US corporate bonds.
8. Favorite stocks are GE, BAC, C. Tesla is most overvalued.
PREPARING FOR THE BEAR’S RETURN – an interview with Doug Kass
Kass is bearish (surprise). SP500 consensus earnings of $120 are inflated due to corporate profit margins at 60-year highs, normalized earnings are well below $120. Market p/e of 16 is more like 19 using reasonable margin assumptions. Fair value for the SP500 is about 1650, 12% below recent prices.
Kass is long closed-end municipals selling at about a 6% discount like VPV and NQU. Long OCN. Pairs trade – short TSLA and long GM. Short BAC. Long Monitise [MONLUK] – a London company that provides payments on mobile devices. Kass see it as a 5-bagger. Price is about 66 pence. MA and V have a stake in it. Leon Cooperman is the largest shareholder and owns 12%.
I am rebuilding a spreadsheet that I use to value equities and am working on the calculation of the Intrinsic P/E, so to help give myself a refresher I am writing it all out for the benefit of my readers, so enjoy!
The intrinsic p/e is the sum of the tangible p/e and the franchise p/e. The tangible p/e assumes the company has no growth or that it will pay out all of its earnings. The franchise p/e represents the present value of future growth and is broken down into two components, the franchise factor and the growth factor.
I will use an example as shown on page 192 of the 2010 CFA Program Curriculum, Level II, Volume 4.
In the example, the company can generate a return on equity of 15% (ROE) and the earnings retention ratio is 0.60% (b). Earnings next year will be $100 million and the required rate of return is 12% (r).
First, let’s calculate the tangible p/e. The tangible p/e is simply 1 divided by the required return. In this case, that is 1/.12=8.33.
Next, we calculate the two components that make up the franchise p/e. The two components of the franchise p/e are the franchise factor and the growth factor and the franchise p/e is the product of those two numbers.
The franchise factor would be the first component and it “is meant to capture the return levels associated with” new investments. The formula is:
(1/r) – (1/ROE) = (1/.12)-(1/.15) = 1.66667
The second component is the growth factor. “The growth factor captures the present value opportunities for productive new investments.” The formula is:
(b * ROE) / (r-(b*ROE)) = (.6 * .15) / [.12 – (.6*.15)] = 3
The retention rate (b) multiplied by the ROE is the growth rate (g), so we can simplify the formula as follows:
g = b * ROE = .6 * .15 = .09
and then the growth factor formula is now:
g / (r-g) = .09 / (.12 – .09) = 3
Now, let’s calculate the franchise p/e:
Franchise PE = Franchise Factor x Growth Factor = 1.6667 * 3 = 5.00
The intrinsic p/e is equal to the sum of the tangible p/e and the franchise p/e.
Intrinsic p/e = 8.33 + 5.00 = 13.33.
If the company earned $100,000,000 the intrinsic value would be 13.33*$100,000,000 or $1,333,000,000. There are additional formulas that take into account inflation but I am not covering that here.
There you have it! Everything you wanted to know about the calculation of the intrinsic p/e.
New Home sales fell to an annualized rate of 384,000 in March, the lowest rate since last July, a drop of 14.50%. Economists were looking for a 2.3% increase to 450,000. Year over year, sales were down by 13.3% which is the first decline since September of 2011. New home inventory was at the highest level since November of 2010, that is a 5 month supply of homes which put the market in balance between buyers and sellers. Median sales price was up 5.2% year over year, a nice increase but a decline in the rate of increase. The next couple of months will be important to determine if this is a trend or just a temporary drop.
Questioning the Bulls’ Faith
Jonathan Laing says the market might be setting up for a fall and bases his argument on valuation. First, p/e ratios are overstated at 16x forward multiple. Earnings are overstated because of low interest rates. Profit margins, which are high now, will revert to the mean.
John Hussman looks at price to sales, which is currently at 1.67. This is the highest level since the market high in 2000 and double the norm. Hussman, who has been looking for a big market fall for a few years, sees a 40% drop within the next couple of years.
Laing suspects that ETFs will be the weak spot in the next market fall. ETFs are up to $1.7 trillion and have been untested in a big market sell off.
FOR RAYTHEON, A COUNTDOWN TO LIFTOFF BEGINS
RTN can advance 20 to 30%. Trades at 13x 2015 projected earnings and at a 5% discount to the SP500 with a 2.5% yield. A budget deal will assure stability for a couple of years. EPS was $5.96 in 2013, could be $6.74 this year and $10 by 2016. FCF yield is just under 8.5%.
EXPENSIVE BUT WORTH IT
Google and Red Hat look good, but Twitter, NFLX and AMZN are still too high.
COMING UP ROSES
Home Depot at $77 can get to $95 in the next year. Priced at 17.4x this year’s expected earnings. Company has strong management team. Same store sales were up 6.8% in 2013. $3.76 EPS in 2013, expected $4.43 this year and $5.12 next year. Long term growth of 16.4%. HD has an 11.6% operating margin versus 7.9% at Lowe’s and an inventory turnover rate of 4.7 compared to 3.9 at LOW and 3.8 at Sears. ROE is 35.5%. Buying back $5 billion per year in stock and dividend yield is $1.88. The housing rebound will be the big tailwind.
BEWARE HIDDEN RISKS IN HIGH-YIELD FUNDS
Many low duration, high-yield funds might hold bonds that have a call feature. They are assuming the bond will be called, but if not, duration expands. According to Matt Conti of the Fidelity Total Bond fund, if you look at the Bank of America Merrill Lynch High Yield Master Index, the current duration is 3.5 years but if priced to maturity instead of the call date the duration increases to five years.
In a negative market a longer duration can lead to a momentum effect that prompts more and more selling and lower prices.
Two good bets are BHYAX and AGDAX.
A NEW APPROACH TO VALUE
GVAL is a new ETF run by Meb Faber that owns 100 deep-value stocks in some of the most battered markets. Other value ETFs metioned are FEP and JFK.
DANCING WITH THE MARKETS’ 800-POUND GORILLA
A good interview with Rob Arnott. You should read the entire article in Barron’s, but a few quick quotes:
“The S&P is no bargain. But REITs are OK, and emerging-market stocks are downright cheap.”
“Commodities have gotten a lot cheaper after the crash in god, so they are mildly interesting again.” But they are sensitive to macro conditions.
“What is the real GDP growth of the past 40 years? It’s 2.1%. Yet if you say “I’m expecting 2% growth in the decades ahead,” your are viewed as a pessimist.”
“1% real annual GDP growth in the next 20 years would be totally unsurprising.”
Employment numbers continued to improve and beat expectations. Initial claims were 304,000, an increase of 2,000 from the revised number of the prior week but much better than the consensus number of 320,000. The 4-week moving average was 312,000, which is the lowest number since October 6, 2007.
Continuing claims were 2,739,000 and that is the lowest number since December 15, 2007.
![]()
On February 16 we wrote about using the VIX as a short-term timing signal to get a hint of where the market might be headed. A positive signal that the market might go up would be generated when the VIX closes 2 standard deviations above its 20-day moving average. That happened on April 11. As luck would have it, that marked the low from last week. The SPY closed at $181.51 and has since advanced 2.7%.
A negative signal would be generated when the VIX closes 10% below its 10-day moving average. That happened yesterday when the SPY closed at $186.39.
Of course, this system does not work every time and I am not suggesting to use this as a trading system. It is just a way to see when short-term sentiment might have gotten too extreme. A negative signal on February 7 did not result in any kind of market pullback. The market kept going up. Same in regards to the October 16 signal.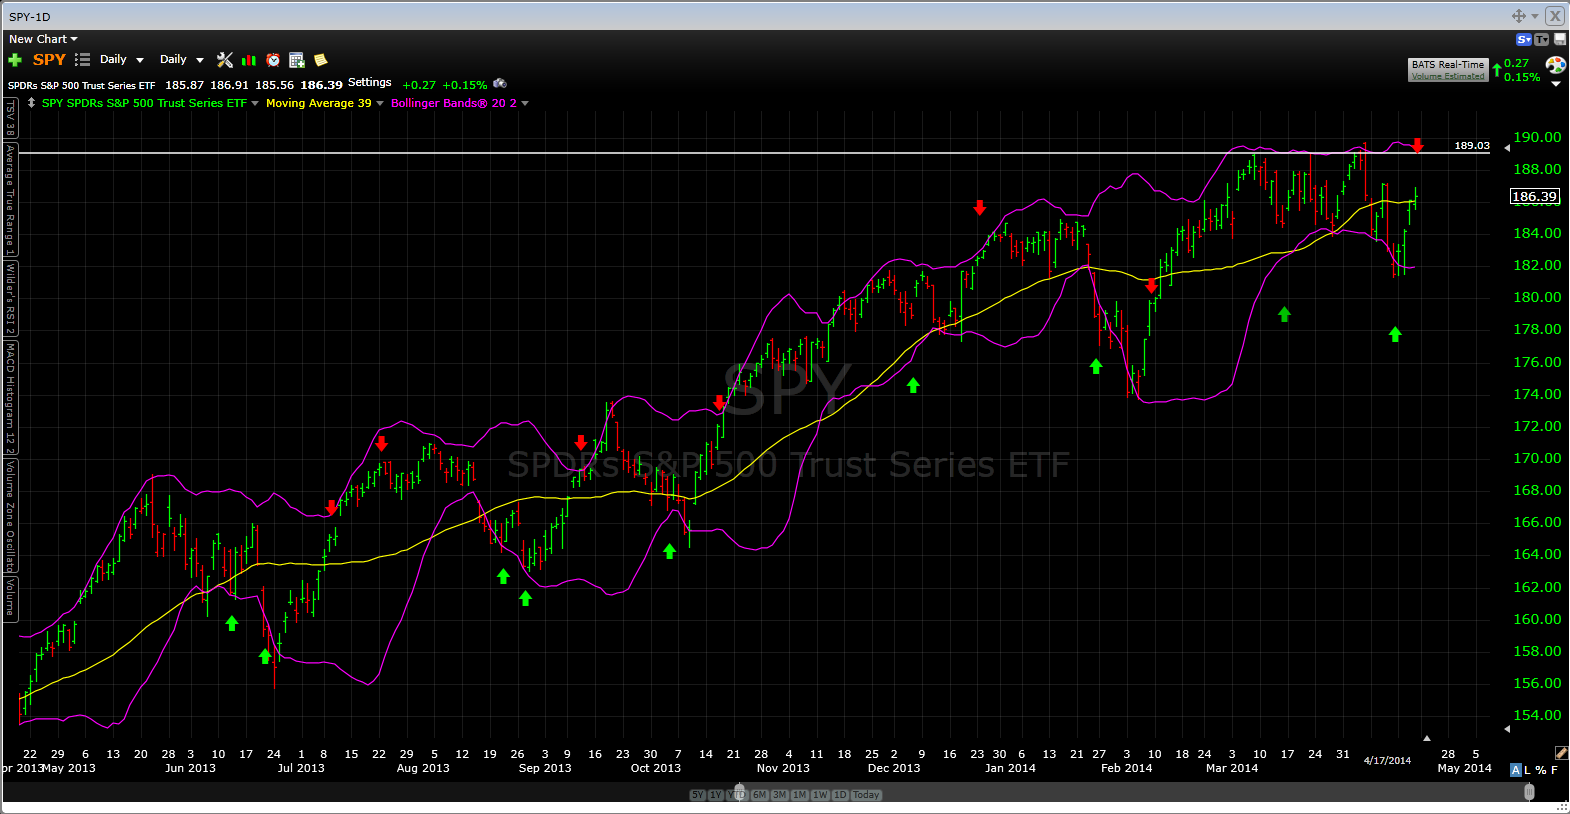
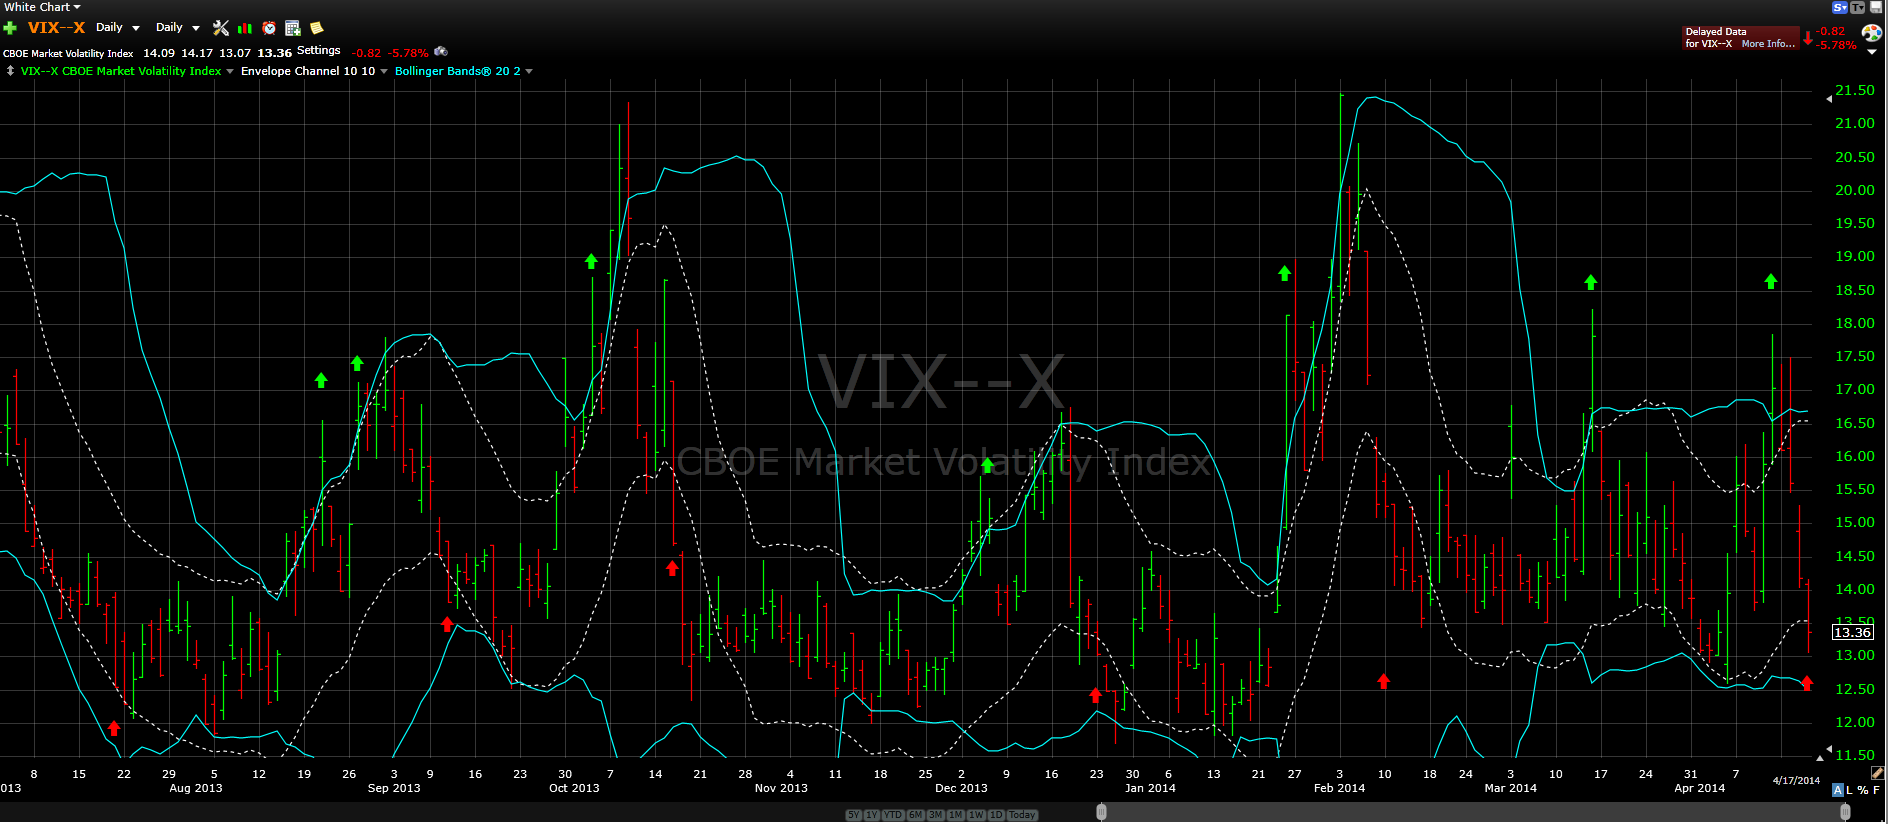
The green arrow indicates fear and the red arrow indicates fear is receding outside of the means as defined in the article.