
On February 16 we wrote about using the VIX as a short-term timing signal to get a hint of where the market might be headed. A positive signal that the market might go up would be generated when the VIX closes 2 standard deviations above its 20-day moving average. That happened on April 11. As luck would have it, that marked the low from last week. The SPY closed at $181.51 and has since advanced 2.7%.
A negative signal would be generated when the VIX closes 10% below its 10-day moving average. That happened yesterday when the SPY closed at $186.39.
Of course, this system does not work every time and I am not suggesting to use this as a trading system. It is just a way to see when short-term sentiment might have gotten too extreme. A negative signal on February 7 did not result in any kind of market pullback. The market kept going up. Same in regards to the October 16 signal.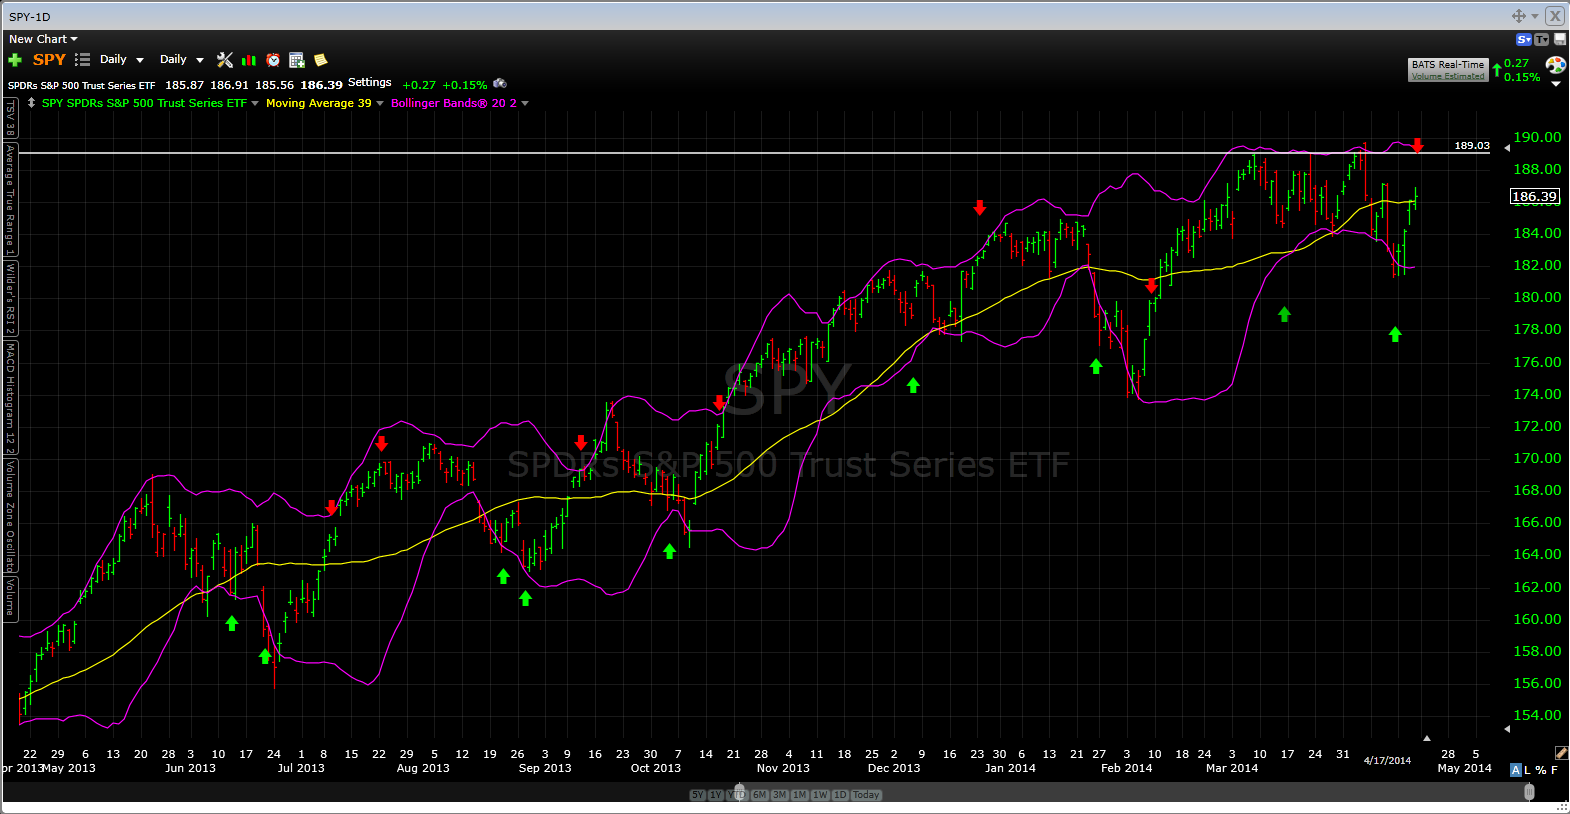
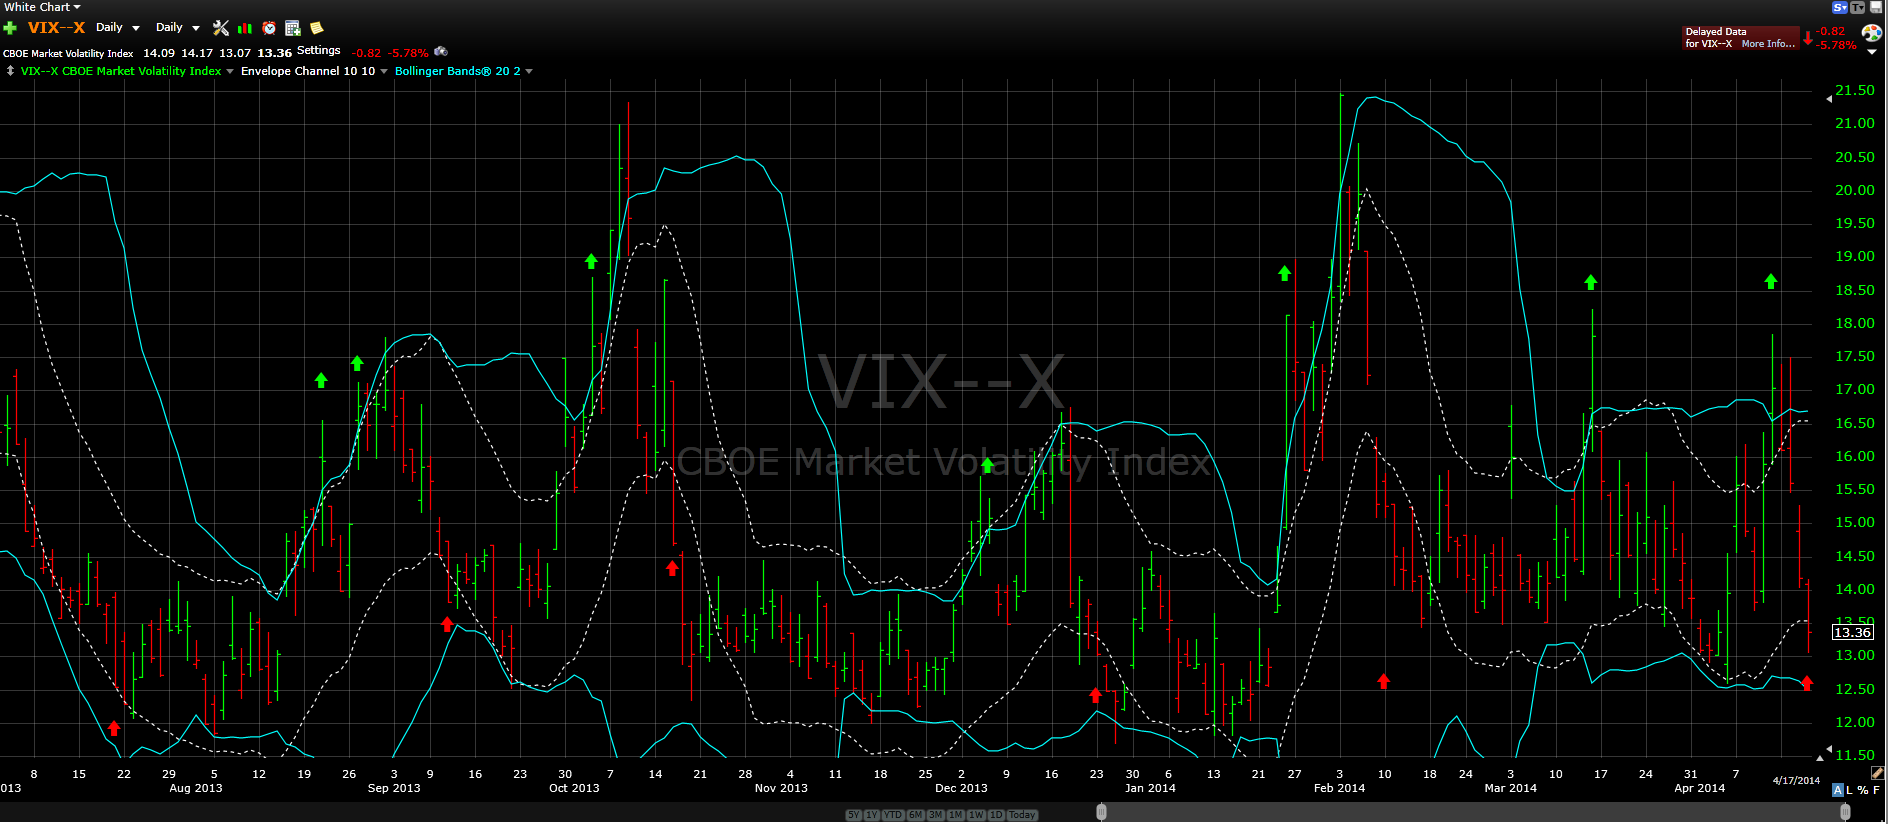
The green arrow indicates fear and the red arrow indicates fear is receding outside of the means as defined in the article.