
HIGHLIGHTS
- Stocks fall by about 5%.
- US equities are now down about 2.2% for the year.
- A wild week of trading.
- Everything you need to know about investing on one index card.
- Volatility ETN’s crash.
- Valuations are now somewhat reasonable.
- US deficits are going to begin to ramp up at a time when they should be falling.
MARKET RECAP
The stock market entered correction territory this week as US stocks fell by about 5% and international equities dropped by 5.25%. US equities are now down 2.2% for the year and we are back to where we were at the end of November. The yield curve steepened by 15 basis points as the 2-year note decreased by 10 basis points and the 10-year increased by 5 basis points.
DAY BY DAY
MONDAY
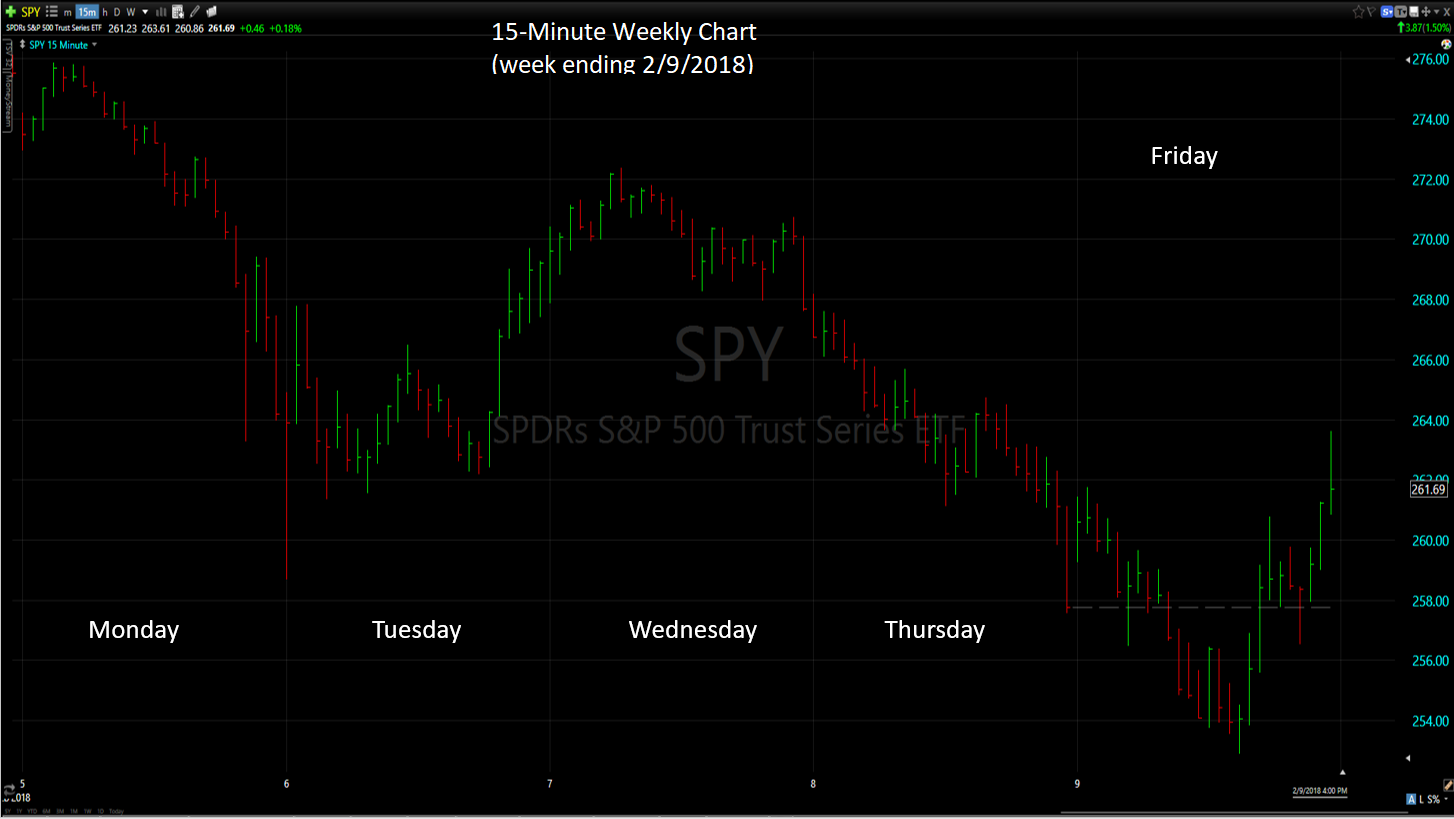
It was a wild week, to put it mildly. On Monday, the SPY (S&P 500 ETF) opened down 0.72%, had a quick rally back to breakeven, and then fell throughout the rest of the day to close with a loss of 4.2% from the Friday close.
TUESDAY
On Tuesday, the market opened down 1.6% and rallied back to close up for the day by 1.97%, that gave some glimmer of hope that the sell-off might be over.
WEDNESDAY
On Wednesday, the market opened down slightly, 0.41%, and then rallied. At the Wednesday high, the SPY was up 1.2%. But from the midday on stocks fell and closed down 0.54%.
THURSDAY
The negative close on Wednesday set up for a really rough Thursday, stocks fell almost the entire day and finished down 3.75%. That put the SPY in correction territory (a decline of 10% or more), down by 10.10% from its January 26th high.
FRIDAY
Friday started out better, opening up by 1.28%, but the market quickly turned south and at its low, the SPY was at 252.92, that was about at 1:45 pm. And at that point, the index was down 11.75% from the January 26th closing high. The price also fell just below the 200-day moving average, a key technical level that many traders watch to judge the broad direction of the market (as in up or down). But stocks had a huge rally from that point and managed to close up by 1.5% for the day, an increase of 3.39% from the day’s low.
For the week, the SPY fell by 5.06%.
INVESTMENT ADVICE ON AN INDEX CARD
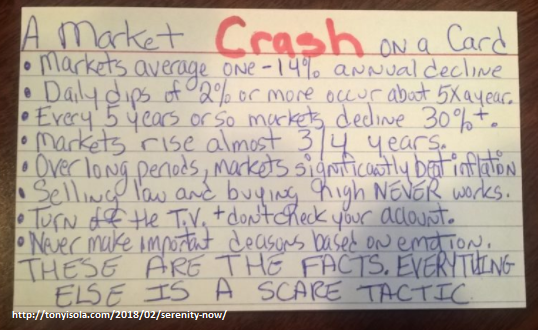
We asked in our commentary for the week ending January 26th, if this was 1987 all over again? The “effortless ease” in which the market was constantly going up reminded us of the 1987 market. That led to complacency and lots of one-way bets on low volatility and a belief that stocks would go up forever. But markets don’t work that way. Over time, they generally go up as the economy grows, but in between, there are often sell-offs, and sometimes they can be severe (much more than we have seen so far over the last week or so). The index card below, which has been floating around Twitter, kind of sums it up!
VOLATILITY
The one-way bets are perhaps best shown in the crash of the XIV. The XIV is an exchange-traded note (ETN) that essentially benefits from markets with low volatility. Low volatility was what we just came out of, we just went the through the longest period ever without a 3% correction and came up just short of the longest period ever without a 5% correction. From December 31, 2016, through its high on January 11 of this year, the XIV was up by 210%, closing at $145. On Friday, the XIV closed at $5.38, a loss of 96.3%. Just this past week, it fell 96.1%. The XIV, and volatility related products like it, are taking the blame for a lot of the market’s fall this week. Traders getting out of the XIV trade supposedly spilled over into selling equities. We wrote about the threat of this on October 15.
CATALYSTS FOR THE SELL-OFF
As we see it, here are the catalysts for this sell-off:
- Overdue for a correction, this set up complacency and one-sided bets on the market moving higher.
- The threat of higher inflation, triggered by the increase in hourly wages on February 2.
- The Fed beginning to unwind the balance sheet, a slow movement from quantitative easing to quantitative tightening.
- Ballooning deficits at a time when deficits should be decreasing (see below).
VALUATION
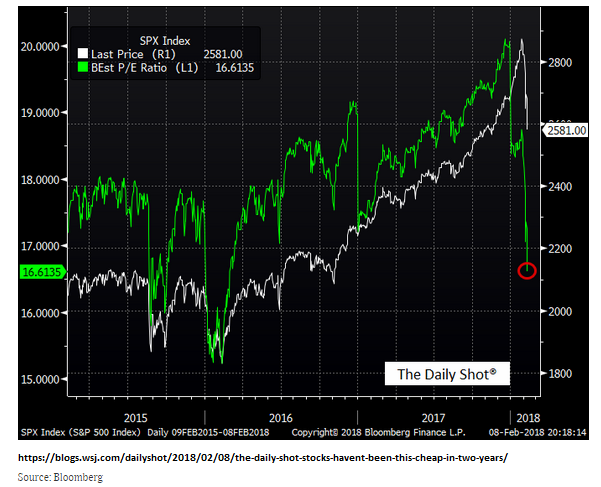
If there is any good news, it is that all of a sudden, market valuations have become much more reasonable. A combination of falling stock prices and higher earnings have the current forward p/e at about 16.9, as of the Friday close, a level not seen since 2016.
The Morningstar measure of the median fair value of stocks that it analyzes, was as high as 1.11 recently, indicating the median stock was overvalued by 11%. Today, the ratio is 0.99, indicating the median stock is now undervalued by 1%!
IT’S A GOOD ECONOMY THAT THREATENS THIS MARKET
A distinguishing characteristic of this correction, compared to all of the others since 2007, is that the primary fear is not an economic downturn, but an accelerating economy that unleashes inflation and leads to higher interest rates, although you can make the case that such a scenario would lead to a downturn at a future point. But for now, the economy continues to look very strong. The most recent estimates of growth for Q1 from the Atlanta Fed’s GDPNow model are 4.00% and from the New York Fed’s NowCast is 3.35%. Those estimates can certainly change, but for now they indicate accelerating growth for this quarter.
DEFICITS
One area that does have us concerned over the long run is the complete disregard by our government in dealing with our budget deficit. The recent tax cuts will add an estimated $1 trillion or so in deficits over the next 10-years. And as if that wasn’t enough, a spending bill passed this week, as part of the legislation to keep the government funded, adds an additional $300 billion in deficit spending. And almost nobody in Congress cares, and the White House certainly doesn’t.
SCOREBOARD
