MARKET RECAP
Equities turned in their best week since 2013, rising about 4.4%. Some market participants think the correction is over, and it is back to smooth sailing from here. We are not so sure. A recent Goldman Sachs report detailed that a typical correction takes 70 trading days to trough and 88 days to recover.
The markets just completed the longest period ever without a 3% correction. We took a look at how the market performed after the next nine longest periods without a 3% correction, going out 90-days, 180-days and one year, as well as what the maximum drawdown was.
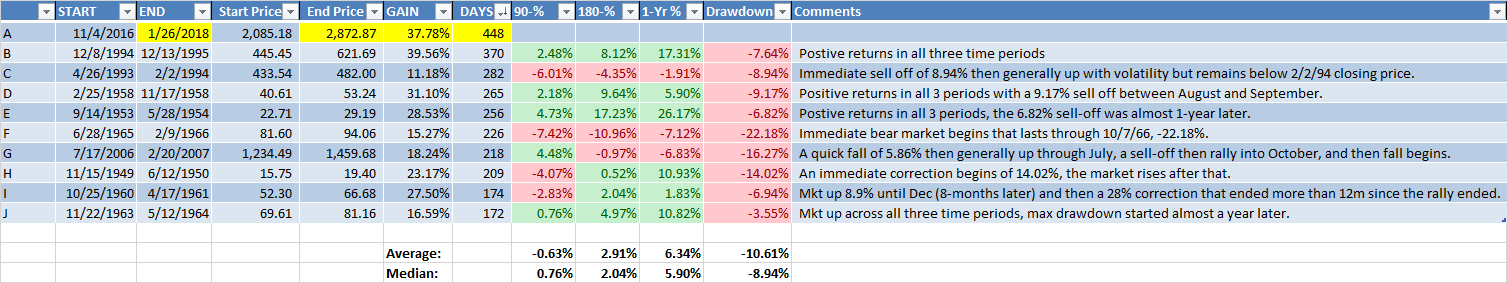
SUBSEQUENT PERFORMANCE OVER 90, 180 AND 365 DAYS
What happens after extended, non-volatile rally ends?
Two of the time periods (C and F above) had losses across the board. The period from April of 1993 until February of 1994 (C), and then the period from June of 1965 until February of 1966 (F).
If you at the percentage gain or loss in 90, 180 and 365 days, and ignore any drawdowns in between, the maximum loss was 10.96% in period F, and that was 180 days after the rally had ended.
In four of the nine examples (B, D, E, and J), the market was up in every time frame measured. The maximum gain was 26.17% one year after the end of rally E.
In two of the examples (H and I), the S&P was down in value 90-days later, but up in the longer time frames of 180-days and one year.
And in the remaining example, G, there was a gain 90-days out but losses at the end of the 180-day and one-year time periods.
The average return over the nine-time periods was -0.63% for the 90-day time-period, 2.91% for 180-days, and 6.34% for 365-days.
The median return was positive across all time frames, 0.76%, 2.04% and 5.90% for 90, 180 and 365 days.
THE END OF THE RALLY LED IMMEDIATELY TO A DECLINE OF 10% OR MORE TWO TIMES
Of the nine periods, two of them, 1966 and 1950 (F and H), were periods where the end of the rally marked the high point before a decline of 10% or more. In 1966 (F), the S&P sold off by 22%, and in 1950 (H), it declined by 14%. Make that three times as we fell 10% on this most recent decline.
MAXIMUM DRAWDOWN
We also looked at the maximum drawdown over the subsequent 12-month period. The thinking was that maybe the end of the rally does not mark the beginning of an immediate decline, but what if it leads to more volatility which is a tip-off to a larger sell-off at some point in the next 12-months.
The maximum drawdowns averaged -10.61% with a median of -8.94%. The smallest drawdown was 3.55% and the largest was 22.18% over the following 12-months. Thus, in all cases except for one (J), volatility did increase to a certain extent.
CALM BEFORE THE STORM
If there was ever a case of the calm before the storm it was the run that started in July of 2006 and ended in February of 2007. The S&P 500 would move sideways to higher until July by +6.4%, then fall through mid-August by 9.5%, then rally to a new high by 11% into October. That would be the turning point for what would be the bear market of 2007 to 2009. In the one-year after the rally ended in February of 2007, the drawdown was 16.27%, but that was just a hint of what was to come. Ultimately, the market declined between October of 2007 and March of 2009 by 56.30%.
SUMMARY
We looked at nine-time periods and price action over the next year. There is only one period that is similar in length to our current period, and that was the rally from 1994 to 1995 (B). In that case, the market remained positive in the three-subsequent time-frames that we measured. Three other time periods (D, E and J) all had positive returns over 90, 180 and 365 days. Two periods had negative returns over all three-time frames (C and F). In two cases, the end of the rally marked the immediate beginning of significant declines of 10% or more (F and H), including one of 22.18% (F). And then in 2007, the bear market began about 8-months later, but most of the damage was done more than 12-months after the end of the rally.
The sample size is too small draw any definitive conclusions, but there is a definite pick up in volatility after these long rallies end as shown by the drawdown numbers, and there were losses of greater than 10% in three of nine examples.
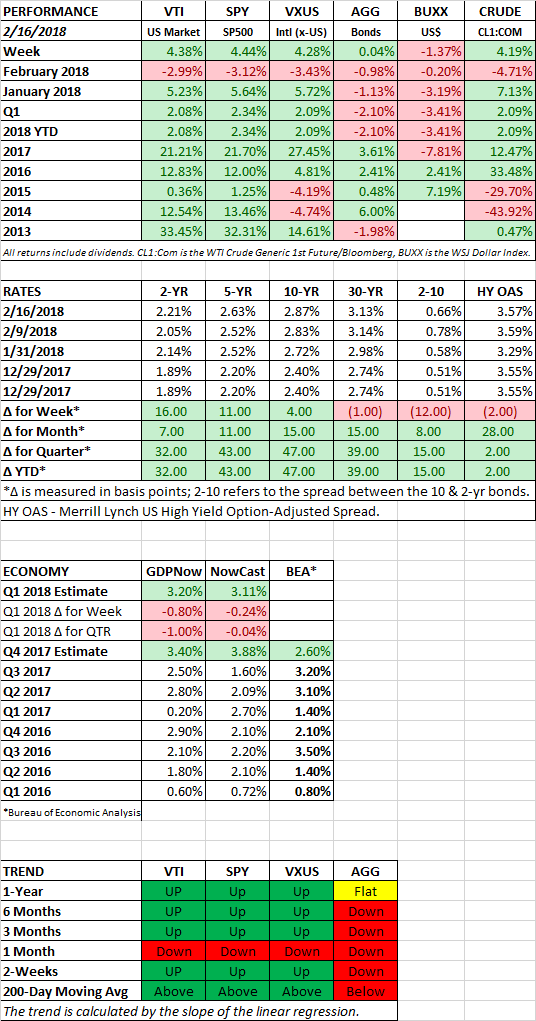
SCOREBOARD