
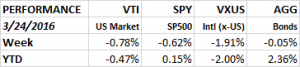
The equity market’s winning streak ended this week as the major indexes fell slightly. The overall US market (VTI) dropped 0.78%, the SP500 as measured by the SPY was down 0.62% and international markets (x-USA) were down 1.91%. The aggregate bond index was about even, falling 0.05%.
BETTING ON VOLATILITY
As the market has moved higher traders have been increasing their bets on volatility ETFs like TVIX or UVXY. These ETFs move counter to the market. So if the market is going down, these ETFs usually go up. With volatility priced low, and with the recent rally in the markets, traders have been anticipating a pullback, hence, the increased demand for these ETFs. TVIX brought in $160m on Monday and UVIX has added $723m over the last several weeks. But the market has a funny way of doing what everyone doesn’t expect. The big run-up off the February lows has had these traders and investors, including ourselves, thinking some kind of pullback might be in order, but the market simply has refused to cooperate, at least so far. Despite multiple chances to decline, including on Thursday when the Dow was down over 100 points in the morning, the market has not followed through on the downside. The market closed at its high on Thursday and pretty much at break even for the day. Similar to past rallies over the last few years, the market might be setting itself to do the unexpected and continue even higher with little pause.
But traders/investors looking for a hedge by going long the volatility ETFs need to be aware of their idiosyncrasies. These ETFs are betting on the VIX index. The VIX is not a stock or a fund or anything like that, the VIX is a complex mathematical formula to calculate the expected volatility of the SP500 based on the weighted average of out of the money puts and calls due to expire in about 30-days. Since the VIX is not anything tangible, no one can actually purchase the VIX. But there are future contracts available on the VIX and that is how these funds get exposure to the mathematical VIX calculation. These futures contracts are settled in cash at expiration. The volatility ETFs are based on buying and selling these futures contracts. The futures contracts do not track the actual VIX dollar for dollar. They go up and down based on many factors including the time left until the contract expires.
And that is why going long a volatility ETF is such a dangerous game. While a trader could hit a big payday if the market falls, especially if it happens quickly and unexpectedly, there is usually a huge wind pushing against the long trader every single day. This is called the “roll yield.”
Normally the near-term futures contract is priced lower than a longer dated contract with an expiration date further out. The futures market is said to be in “contango” when it is in this state. The ETFs will own the near-term (and cheaper) contract, but have to “roll” into the longer-dated (and more expensive) contract over time. So the funds are essentially selling low and then buying high, this eats away at the value of the future contract with each transaction. This differential is the “roll yield” and that is why buying a volatility ETF is a loser’s game over time. The trader is betting that he can overcome the roll yield by a sharp decline in the market and that he can get in and out of the fund before the roll yield eats away at this return.
The VXX is a volatility ETF started in 2009, it is down 99% since its founding. But the fund rallied 42% from December 31, 2015 to the market low on February 12. That is the appeal of these funds. The timing has to be just right for the big payoff.
There are rare times when the volatility markets are not in “contango” but in a state called “backwardation.” This is the opposite of contango. When a market is in backwardation, the near-term contract will be more expensive than the longer dated contract. When this happens, and it is rare, the volatility fund will have a tail wind at its back. The fund would then be selling high and buying low.
Needless to say, volatility ETFs are a high stakes game and not for the faint of heart.
HERE COMES THE WAVE
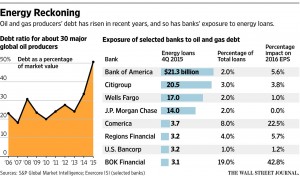
We have been waiting and it is starting to arrive. The percent of energy loans classified as in danger of default will be greater than 50% at some point this year at several of the major US banks. Banks are trying to limit their exposure be selling off the loans at a discount, not renewing the loans and cutting back on credit lines. According to the law firm of Haynes and Boone, LLP, 51 producers with $17.4b in debt have already filed for bankruptcy. The most exposure might be to the regional banks like Comerica and BOK Financial, not the majors, as the majors have already begun the process of writing off the loans and have smaller overall exposure.
ECONOMIC NEWS
Over the last couple of months, we saw some signs that the manufacturing sector, while still not in growth mode, was at least beginning to stabilize. That thesis took a hit backwards when the new durable goods report came out. New orders for products designed to last three years or more fell by a seasonally adjusted 2.8% in February. That report moved the Atlanta Fed’s GDPNow forecast of 1st quarter growth down to 1.4% from 1.9% the previous week. The GDPNow number was north of 2% a few weeks back, but has fallen over the last few weeks, but it is still positive indicating slow growth.
The Chicago Fed National Activity Index (CFNAI) report for February was mainly negative after a strong January report. All of the major categories were lower. The Employment contribution fell to its lowest reading since September. On a positive note, January was revised higher. The three month moving average is showing growth of about 2.6%.
Existing home sales came in at a seasonally adjusted rate of 5.08m versus 5.47m in January. But new home sales increased by 2% in February to 512k annual rate. There appears to be a big mismatch between where the demand is and what the supply is. In other words, there is demand for lower priced starter homes but there is not supply in that price category. According to Trulia, there were only 238k starter homes on the market versus 423,000 in 2012.
The Richmond Fed Manufacturing Index came in very strong, up 26 points to +22, that is the highest level since April 2010. The Composite and Shipments month over month jump was the largest ever, and the New Orders increase was the second highest ever. These increases, together with the increases last week in the Empire Manufacturing report and the Philly Fed report show some strong regional strength around the country.
However, that strength did not carry over to the Kansas City region. The Kansas City Fed Composite Index moved in the right direction, rising six points, but was negative overall, scoring a -6 for March. This was the 13th straight month of a contracting manufacturing activity in that region.
The ATA For-Hire Truck Tonnage Index was up 7.2% for February and was up 8.6% year over year, indicating faster economic growth in Q1.
UNEMPLOYMENT
Initial claims for unemployment remains low, coming in at 265,000 for the most recent reading. The four-week average is 259,750, which is close to the lowest level since 1973. The labor market remains tight.
SUMMARY
Overall, the economic reports had a negative tilt this week, however, we still do not see a recession in the near-term. The market declined just slightly. The market has shown a lot of resilience of late and that might be a “tell” for a stronger market down the line.