MARKET RECAP
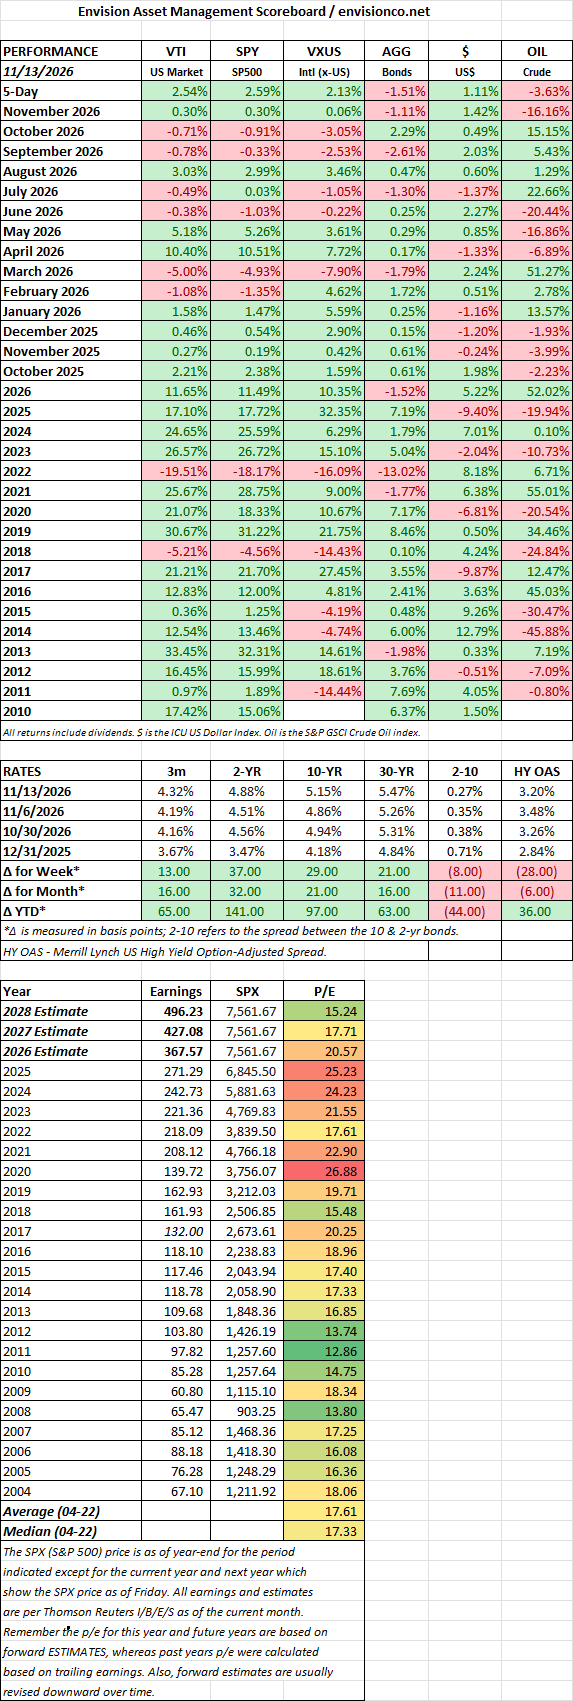
U.S. stocks recovered during the week ended November 13, 2026, despite rising bond yields and renewed volatility in semiconductor shares. The S&P 500 gained 2.51% to 7,561.67, the Dow Jones Industrial Average advanced 2.07% to 52,347.55, and the Nasdaq Composite rose 2.27% to 25,136.27. The S&P 500 and Nasdaq ended four consecutive weeks of losses, with Monday’s strong rebound providing much of the week’s advance.
Friday’s trading was less encouraging. The S&P 500 fell 0.40% and the Nasdaq declined 0.91%, while the Dow edged up 0.10%. Semiconductor weakness remained a source of pressure, underscoring the uneven recovery following the previous week’s selloff. International equities also rebounded: the Vanguard Total International Stock ETF (VXUS) closed at $82.64, up 2.13% from the prior Friday.
Nvidia’s leadership transition was a major corporate development. On November 12, the company announced that Jensen Huang had resigned as president, CEO, and director. CFO Colette Kress became interim CEO while retaining her finance responsibilities, and Harvey C. Jones was appointed board chair. The announcement followed reports concerning Huang’s personal relationships. For investors, the transition raised questions about leadership continuity and Nvidia’s central role in financing and supplying the AI expansion. The company said its operations, customer commitments, and product roadmap would continue without interruption.
Inflation reports reinforced expectations for additional Federal Reserve tightening. October’s Consumer Price Index increased 0.4% for the month, above the 0.3% consensus forecast. Core CPI, excluding food and energy, rose 0.3%. Shelter and food contributed to the increase, while energy prices continued rising at a slower pace than in September. BLS could not publish the usual headline and core annual comparisons because October 2025 survey data were unavailable following last year’s government shutdown.
Friday’s producer-price report offered mixed signals. Final-demand PPI increased 0.3% in October, slightly below the 0.4% forecast, but its annual increase reached 6.5%, the highest since November 2022. The measure excluding food, energy, and trade services rose 0.5% monthly and 4.9% annually. September’s headline monthly increase was also revised upward to 1.4%.
Treasury yields climbed sharply as investors reassessed the interest-rate outlook. The two-year yield rose 37 basis points to 4.88%, and the ten-year increased 29 basis points to 5.15%. The ten-year yield remained 27 basis points above the two-year. Rising yields weighed on bond prices, with longer-maturity securities generally more sensitive to the move. Markets increasingly anticipated a December rate increase from the Fed’s current 3.75%–4.00% target range.
Labor-market data continued to indicate limited layoffs. Initial unemployment claims increased 9,000 to 200,000 for the week ended November 7, from an upwardly revised 191,000. Continuing claims declined 20,000 to 1.697 million for the preceding week. These figures followed the prior week’s stronger October employment report.
Bitcoin and gold both declined. Bitcoin’s reported November 13 daily closing price was approximately $68,249, down 9.90% from the previous Friday. December gold futures ended near $3,880 an ounce, down about 4.5% for the week. Higher yields and expectations of further monetary tightening remained headwinds for assets that do not produce income. Cryptocurrency quotations vary by provider and daily cutoff.
Trade discussions offered another development to watch. U.S. and Chinese officials held a trade-council meeting Friday covering tariffs and agricultural trade ahead of the expected Trump–Xi meeting. No new agreement was announced. Alongside continuing uncertainty over Iran and energy supplies, the talks remained relevant to business costs, supply chains, and the inflation outlook. Nvidia’s November 17 earnings report will provide another important test of demand and confidence in the AI sector.
TECHNICAL ANALYSIS OF THE TOTAL US STOCK MARKET (VTI – see charts below)
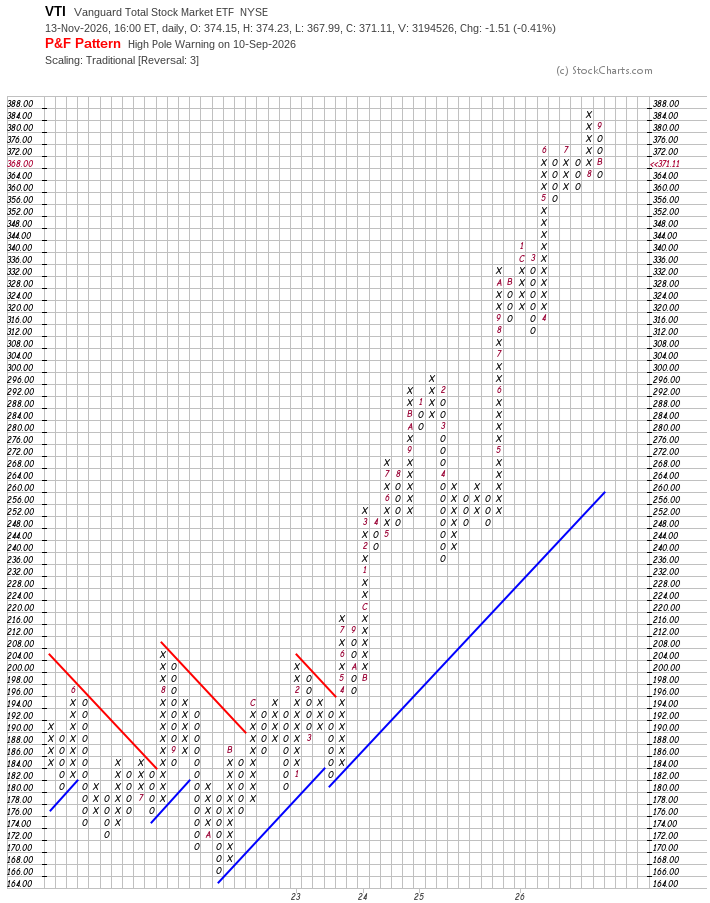
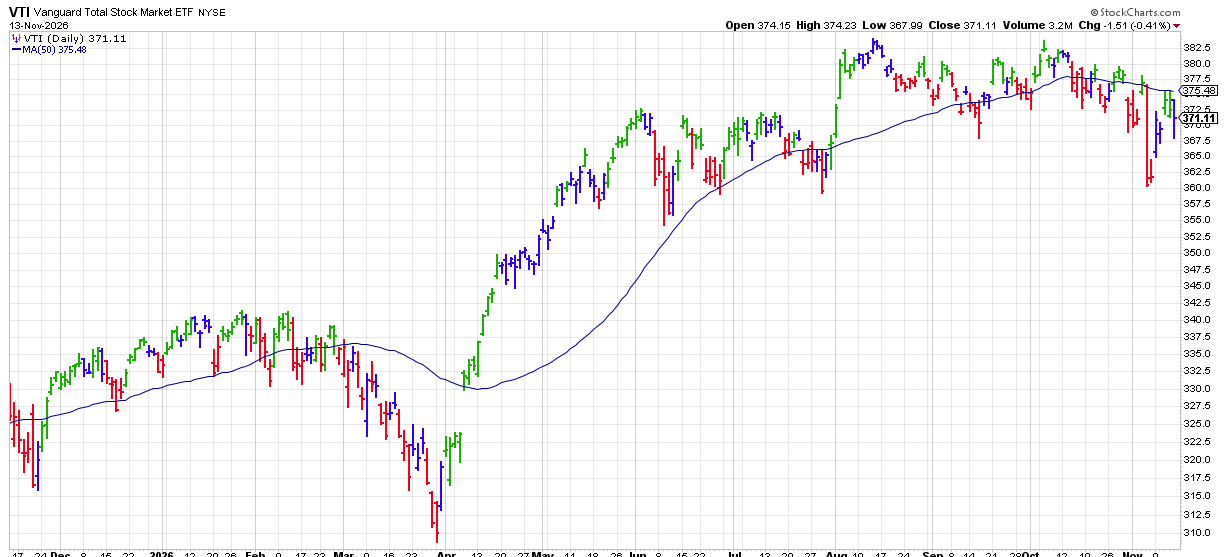
VTI’s longer-term trend remains bullish, but both charts show weakening momentum and a more cautious near-term outlook. The daily chart shows that the strong advance from April through August has transitioned into a choppy trading range, with repeated rallies stalling around $380–$383. At $371.11, VTI is below its 50-day moving average of $375.48, which has flattened and begun turning lower. The point-and-figure chart reinforces that caution: its September high-pole warning indicates that sellers erased a substantial portion of the preceding advance, and the current declining column shows that the recent rebound has not yet produced a meaningful upward reversal under the chart’s settings.
Taken together, the charts suggest a correction within an established uptrend, with the possibility of further downside. Reclaiming and holding $375–$377 would be an initial sign of improvement, while a sustained breakout above the $380–$386 resistance area would provide stronger evidence that the advance is resuming. On the downside, $360–$364 is the key support zone; a sustained break below it would increase the likelihood of a decline toward $353–$357. For now, the longer-term bullish structure remains intact, but the recent bounce needs more follow-through before it can be viewed as a durable recovery.
US STOCK MARKET
SCOREBOARD