RSI Breaks 85 on the 10-Year Yield
The yield on the 10-year Treasury rose by a staggering 16 basis points yesterday to close at 1.54%. That is up by 50 basis points since January 27, about one month ago, and up from the August 2 closing low of 0.52 by 102 basis points.
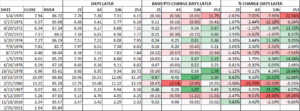
What has been most dramatic is the speed of the increase. A technical indicator called the Relative Strength Index (RSI), developed by J. Welles Wilder in the 1970s does a good job measuring the speed and change of price movements. According to Wilder, an RSI reading above 70 indicates an overbought condition. Yesterday, the RSI, as measured over 14-days, for the 10-year was 85.89. An RSI reading above 85 is rare.
It has only happened three times this century, back in 2007 and 2016. It did not happen at all in the 1990s and only happened two times in the 1980s. When it did happen frequently was the 1970s when it occurred 11 times*. The 1970s was a decade of high inflation and interest rates.
The exploding interest rate makes some sense. As we have been writing about when you are spending trillions like it is nothing, something is bound to happen, whether that be inflation or higher interest rates, or both. It is too early to say if this kind of increase is a foreboding of things to come, but let’s hope not. We do not want to relive the 1970s, at least in economic terms.
*Please note we are only counting the initial reading, so if it happened on day 1, and also on day 2 and day 3 or even a few days later, like day 5, that would count as just one reading.

