Using the VIX has proved effective as a short-term indicator over the last 8 months. The VIX is a measure of implied volatility of the S&P 500 index options. The VIX will go up in value when fear is high, and go down in value when fear is low.
You can use the VIX as a contrary indicator, going short the market when the VIX spikes and going long the market when the VIX dips. We looked at two ways to measure this, first, we used a 20-day Bollinger Band with two standard deviations and second, a 10-day envelope channel with a 10% spread. The Bollinger Band would generally provide a more extreme measure.
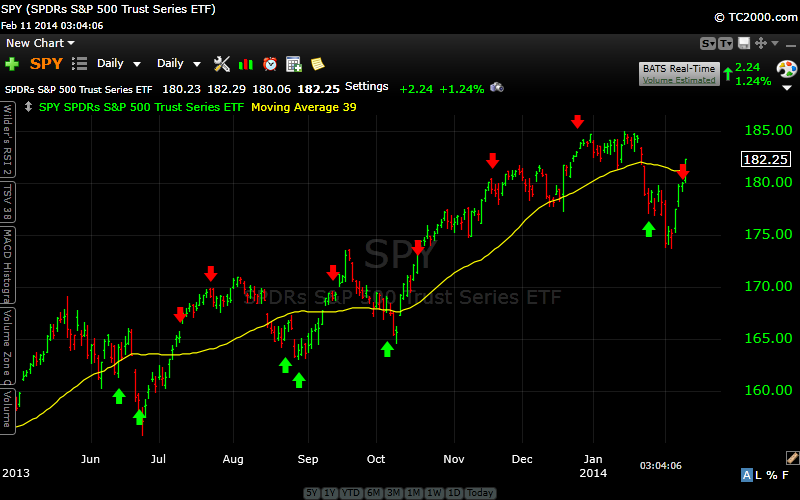
Since the VIX spikes faster when the markets are fearful, we used the Bollinger Band when fear is rising, and then we used the envelope channel when fear was receding. If the VIX closed below the Envelope Channel, we marked the SP500 chart below with a green up arrow, indicating a buy signal. And if the VIX closed above the Bollinger Band we market the SP500 chart with a red sell signal.
We only did this for the last six times, on the upside and the downside, when these signals have occurred. But the VIX has been fairly accurate picking short term tops and bottoms, the only team it clearly failed was on the October 16th down signal.